***Last / Change / Volume data in this table is the closing quote data***
Symbol/Exchange
Company Name
Industry Group |
PRICE |
CHANGE
(%Change) |
Day High |
Volume
(% DAV)
(% 50 day avg vol) |
52 Wk Hi
% From Hi |
Featured
Date |
Price
Featured |
Pivot Featured |
|
Max Buy |
ADS
-
NYSE
Alliance Data Sys Corp
COMPUTER SOFTWARE and SERVICES - Information and Delivery Service
|
$94.76
|
-0.62
-0.65% |
$95.44
|
561,972
59.16% of 50 DAV
50 DAV is 949,900
|
$107.18
-11.59%
|
10/21/2011
|
$97.94
|
PP = $101.15
|
|
MB = $106.21
|
Most Recent Note - 11/18/2011 6:01:31 PM
G - Down today on near average volume for its 5th consecutive loss leading to deterioration deeper into its prior base. Violated support at its 50 DMA line raising concerns and its color code is changed to green.
>>> The latest Featured Stock Update with an annotated graph appeared on 11/17/2011. Click here.
View all notes |
Alert me of new notes |
CANSLIM.net Company Profile |
SEC |
Zacks Reports |
StockTalk |
News |
Chart |
Request a new note
C
A N
S L
I M


|
ALXN
-
NASDAQ
Alexion Pharmaceuticals
DRUGS - Drug Manufacturers - Other
|
$66.18
|
+1.77
2.75% |
$66.29
|
972,497
63.93% of 50 DAV
50 DAV is 1,521,300
|
$70.42
-6.02%
|
9/15/2011
|
$63.20
|
PP = $60.81
|
|
MB = $63.85
|
 Most Recent Note - 11/22/2011 5:38:47 PM
Y - Gain today on lighter volume helped it close back above its 50 DMA line. Deterioration below recent chart lows ($67.72 on 11/10/11) would raise concerns and trigger technical sell signals.
>>> The latest Featured Stock Update with an annotated graph appeared on 11/14/2011. Click here.
View all notes |
Alert me of new notes |
CANSLIM.net Company Profile |
SEC |
Zacks Reports |
StockTalk |
News |
Chart |
Request a new note
C
A N
S L
I M
|
CATM
-
NASDAQ
Cardtronics Inc
DIVERSIFIED SERVICES - Business/Management Services
|
$24.32
|
-0.10
-0.41% |
$24.76
|
152,043
36.05% of 50 DAV
50 DAV is 421,700
|
$28.46
-14.55%
|
11/8/2011
|
$25.99
|
PP = $25.95
|
|
MB = $27.25
|
Most Recent Note - 11/21/2011 1:44:01 PM
Y - Small gap down today for a 4th consecutive loss, slumping under prior highs in the $26 area and raising concerns while testing important support at its 50 DMA line. A violation of its short-term average would raise greater concerns and trigger a technical sell signal.
>>> The latest Featured Stock Update with an annotated graph appeared on 11/8/2011. Click here.
View all notes |
Alert me of new notes |
CANSLIM.net Company Profile |
SEC |
Zacks Reports |
StockTalk |
News |
Chart |
Request a new note
C
A N
S L
I M
|
CELG
-
NASDAQ
Celgene Corp
DRUGS - Drug Manufacturers - Major
|
$61.69
|
+0.37
0.60% |
$62.05
|
3,450,852
89.83% of 50 DAV
50 DAV is 3,841,700
|
$68.25
-9.61%
|
9/16/2011
|
$61.21
|
PP = $62.59
|
|
MB = $65.72
|
Most Recent Note - 11/21/2011 1:46:58 PM
G -Gapped down today for a damaging loss following last week's violation of its 50 DMA line. Color code is changed to green while the slump below its previously noted chart low ($62.71 on 11/01/11) raises greater concerns and triggers a worrisome technical sell signal.
>>> The latest Featured Stock Update with an annotated graph appeared on 11/7/2011. Click here.
View all notes |
Alert me of new notes |
CANSLIM.net Company Profile |
SEC |
Zacks Reports |
StockTalk |
News |
Chart |
Request a new note
C
A N
S L
I M
|
CEVA
-
NASDAQ
Ceva Inc
ELECTRONICS - Semiconductor - Specialized
|
$28.14
|
-0.74
-2.56% |
$29.06
|
171,671
72.65% of 50 DAV
50 DAV is 236,300
|
$35.60
-20.96%
|
10/28/2011
|
$34.38
|
PP = $35.70
|
|
MB = $37.49
|
Most Recent Note - 11/22/2011 5:33:56 PM
Color code was changed to green and it slumped near its 50 and 200 DMA lines to its lowest level since its impressive 10/27/11 volume-driven gap up gain. Based on weak action it will be dropped from the Featured Stocks list tonight. Subsequent gains above recent highs are needed for its outlook to improve. Disciplined investors may note that a breakout above the pivot point cited did not trigger a new (or add-on) technical buy signal since it was featured on 10/28/11.
>>> The latest Featured Stock Update with an annotated graph appeared on 11/2/2011. Click here.
View all notes |
Alert me of new notes |
CANSLIM.net Company Profile |
SEC |
Zacks Reports |
StockTalk |
News |
Chart |
Request a new note
C
A N
S L
I M
|
Symbol/Exchange
Company Name
Industry Group |
PRICE |
CHANGE
(%Change) |
Day High |
Volume
(% DAV)
(% 50 day avg vol) |
52 Wk Hi
% From Hi |
Featured
Date |
Price
Featured |
Pivot Featured |
|
Max Buy |
FEIC
-
NASDAQ
F E I Co
ELECTRONICS - Diversified Electronics
|
$36.98
|
-0.29
-0.78% |
$37.77
|
219,376
50.21% of 50 DAV
50 DAV is 436,900
|
$42.25
-12.47%
|
10/28/2011
|
$40.31
|
PP = $40.88
|
|
MB = $42.92
|
Most Recent Note - 11/22/2011 5:36:13 PM
G - Color code is changed to green as it slumps further below its pivot point, finishing -12.5% off its 52-week high today. Disciplined investors limit losses if a stock falls more than -7% from their purchase price.
>>> The latest Featured Stock Update with an annotated graph appeared on 10/28/2011. Click here.
View all notes |
Alert me of new notes |
CANSLIM.net Company Profile |
SEC |
Zacks Reports |
StockTalk |
News |
Chart |
Request a new note
C
A N
S L
I M
|
GNC
-
NYSE
G N C Holdings Inc
RETAIL - Drug Stores
|
$27.25
|
+0.69
2.60% |
$27.26
|
1,249,772
97.31% of 50 DAV
50 DAV is 1,284,300
|
$27.99
-2.64%
|
10/26/2011
|
$24.60
|
PP = $24.80
|
|
MB = $26.04
|
Most Recent Note - 11/22/2011 5:37:31 PM
G - Gain today on near average volume for its best-ever close. See the latest FSU analysis for more details and a new annotated graph.
>>> The latest Featured Stock Update with an annotated graph appeared on 11/21/2011. Click here.
View all notes |
Alert me of new notes |
CANSLIM.net Company Profile |
SEC |
Zacks Reports |
StockTalk |
News |
Chart |
Request a new note
C
A N
S L
I M
|
HMSY
-
NASDAQ
H M S Holdings Corp
COMPUTER SOFTWARE and SERVICES - Healthcare Information Service
|
$29.11
|
+0.61
2.14% |
$29.25
|
666,481
98.21% of 50 DAV
50 DAV is 678,600
|
$31.99
-9.00%
|
10/27/2011
|
$26.44
|
PP = $28.37
|
|
MB = $29.79
|
Most Recent Note - 11/21/2011 6:09:46 PM
G - Today was its 6th consecutive small loss on near average volume following a negative reversal on 11/14/11 after hitting a new all-time high. Prior highs in the $27-28 area define support to watch on pullbacks.
>>> The latest Featured Stock Update with an annotated graph appeared on 11/4/2011. Click here.
View all notes |
Alert me of new notes |
CANSLIM.net Company Profile |
SEC |
Zacks Reports |
StockTalk |
News |
Chart |
Request a new note
C
A N
S L
I M
|
ISRG
-
NASDAQ
Intuitive Surgical Inc
HEALTH SERVICES - Medical Appliances and Equipment
|
$418.68
|
-2.14
-0.51% |
$423.20
|
282,884
68.54% of 50 DAV
50 DAV is 412,700
|
$449.06
-6.77%
|
10/19/2011
|
$424.69
|
PP = $415.29
|
|
MB = $436.05
|
Most Recent Note - 11/22/2011 5:43:28 PM
G - Inched lower today for a 5th consecutive loss with near average volume. Prior highs and its 50 DMA line define near-term chart support to watch.
>>> The latest Featured Stock Update with an annotated graph appeared on 11/15/2011. Click here.
View all notes |
Alert me of new notes |
CANSLIM.net Company Profile |
SEC |
Zacks Reports |
StockTalk |
News |
Chart |
Request a new note
C
A N
S L
I M
|
MG
-
NYSE
Mistras Group Inc
DIVERSIFIED SERVICES - Bulding and Faci;ity Management Services
|
$21.36
|
+0.11
0.52% |
$21.51
|
90,807
43.85% of 50 DAV
50 DAV is 207,100
|
$23.51
-9.15%
|
10/28/2011
|
$22.49
|
PP = $23.61
|
|
MB = $24.79
|
Most Recent Note - 11/21/2011 6:04:27 PM
Y - Down today for a 4th consecutive small loss on below average volume. It has slumped near its 50 DMA line and prior highs defining important chart support to watch near $21.
>>> The latest Featured Stock Update with an annotated graph appeared on 11/11/2011. Click here.
View all notes |
Alert me of new notes |
CANSLIM.net Company Profile |
SEC |
Zacks Reports |
StockTalk |
News |
Chart |
Request a new note
C
A N
S L
I M
|
Symbol/Exchange
Company Name
Industry Group |
PRICE |
CHANGE
(%Change) |
Day High |
Volume
(% DAV)
(% 50 day avg vol) |
52 Wk Hi
% From Hi |
Featured
Date |
Price
Featured |
Pivot Featured |
|
Max Buy |
MKTX
-
NASDAQ
Marketaxess Holdings Inc
FINANCIAL SERVICES - Investment Brokerage - Nationa
|
$26.65
|
-0.26
-0.97% |
$27.18
|
103,423
42.72% of 50 DAV
50 DAV is 242,100
|
$31.45
-15.26%
|
10/28/2011
|
$29.79
|
PP = $31.05
|
|
MB = $32.60
|
Most Recent Note - 11/21/2011 6:05:49 PM
G - Today's loss was on light volume as it slumped further below its 50 DMA line which is now downward sloping. Prior lows and its 200 DMA line in the $24-25 area define the next support area to watch.
>>> The latest Featured Stock Update with an annotated graph appeared on 10/31/2011. Click here.
View all notes |
Alert me of new notes |
CANSLIM.net Company Profile |
SEC |
Zacks Reports |
StockTalk |
News |
Chart |
Request a new note
C
A N
S L
I M
|
OSIS
-
NASDAQ
O S I Systems Inc
ELECTRONICS - Semiconductor Equipment and Mate
|
$44.33
|
+0.65
1.49% |
$45.02
|
85,808
57.82% of 50 DAV
50 DAV is 148,400
|
$47.39
-6.46%
|
11/1/2011
|
$42.07
|
PP = $45.57
|
|
MB = $47.85
|
Most Recent Note - 11/21/2011 6:06:59 PM
Y - Gapped down today and slumped further below its pivot point with a loss on light volume. Previously noted - "Lighter than average behind last week's gains, not indicative of great institutional (I criteria) buying demand. Volume-driven gains above its pivot point may trigger a technical buy signal."
>>> The latest Featured Stock Update with an annotated graph appeared on 11/1/2011. Click here.
View all notes |
Alert me of new notes |
CANSLIM.net Company Profile |
SEC |
Zacks Reports |
StockTalk |
News |
Chart |
Request a new note
C
A N
S L
I M
|
RAX
-
NYSE
Rackspace Hosting Inc
INTERNET - Internet Software and; Services
|
$40.89
|
+1.33
3.36% |
$41.16
|
1,877,188
118.02% of 50 DAV
50 DAV is 1,590,600
|
$46.50
-12.06%
|
11/8/2011
|
$44.28
|
PP = $46.27
|
|
MB = $48.58
|
Most Recent Note - 11/22/2011 5:40:27 PM
G - Posted a gain today on near average volume, finishing -12.1% off its 52-week high after finding support at its 50 and 200 DMA lines. Color code was changed to green while slumping well below the pivot point previously cited.
>>> The latest Featured Stock Update with an annotated graph appeared on 11/10/2011. Click here.
View all notes |
Alert me of new notes |
CANSLIM.net Company Profile |
SEC |
Zacks Reports |
StockTalk |
News |
Chart |
Request a new note
C
A N
S L
I M
|
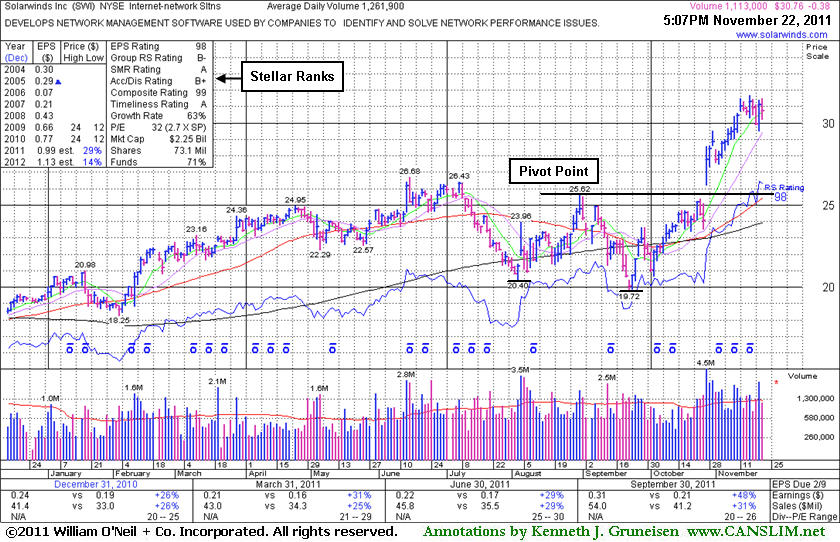
SWI
-
NYSE
Solarwinds Inc
COMPUTER SOFTWARE and SERVICES - Application Software
|
$30.76
|
-0.38
-1.22% |
$31.50
|
1,113,062
94.95% of 50 DAV
50 DAV is 1,172,200
|
$31.69
-2.93%
|
10/27/2011
|
$27.78
|
PP = $25.62
|
|
MB = $26.90
|
Most Recent Note - 11/22/2011 5:41:42 PM
G - Holding its ground near its all-time high, extended from its previous base pattern. Prior highs in the $25-26 area define initial chart support to watch on pullbacks. See the latest FSU analysis for more details and a new annotated graph.
>>> The latest Featured Stock Update with an annotated graph appeared on 11/22/2011. Click here.
View all notes |
Alert me of new notes |
CANSLIM.net Company Profile |
SEC |
Zacks Reports |
StockTalk |
News |
Chart |
Request a new note
C
A N
S L
I M
|
TDG
-
NYSE
Transdigm Group Inc
AEROSPACE/DEFENSE - Aerospace/Defense Products and; Services
|
$92.82
|
+0.38
0.41% |
$93.62
|
437,168
105.85% of 50 DAV
50 DAV is 413,000
|
$102.73
-9.65%
|
11/9/2011
|
$98.45
|
PP = $95.14
|
|
MB = $99.90
|
Most Recent Note - 11/18/2011 5:48:01 PM
Y - Held its ground today following a negative reversal on the prior session after hitting a new 52-week high. A volume-driven gain on 11/08/11 helped it break out from a 19-week base. Reported earnings +42% on +54% sales revenues for the quarter ended September 30, 2011.
>>> The latest Featured Stock Update with an annotated graph appeared on 11/9/2011. Click here.
View all notes |
Alert me of new notes |
CANSLIM.net Company Profile |
SEC |
Zacks Reports |
StockTalk |
News |
Chart |
Request a new note
C
A N
S L
I M
|
Symbol/Exchange
Company Name
Industry Group |
PRICE |
CHANGE
(%Change) |
Day High |
Volume
(% DAV)
(% 50 day avg vol) |
52 Wk Hi
% From Hi |
Featured
Date |
Price
Featured |
Pivot Featured |
|
Max Buy |
UA
-
NYSE
Under Armour Inc Cl A
CONSUMER NON-DURABLES - Textile - Apparel Clothing
|
$75.06
|
-0.63
-0.83% |
$76.79
|
934,381
70.34% of 50 DAV
50 DAV is 1,328,400
|
$87.40
-14.12%
|
10/25/2011
|
$82.43
|
PP = $80.80
|
|
MB = $84.84
|
Most Recent Note - 11/18/2011 5:50:09 PM
Y - Volume was lighter than average today as it sank further below prior highs near $80 previously noted as initial support, technically negating its recent breakout and raising concerns. It is currently testing important chart support at its 50 DMA line.
>>> The latest Featured Stock Update with an annotated graph appeared on 11/3/2011. Click here.
View all notes |
Alert me of new notes |
CANSLIM.net Company Profile |
SEC |
Zacks Reports |
StockTalk |
News |
Chart |
Request a new note
C
A N
S L
I M
|
V
-
NYSE
Visa Inc Cl A
DIVERSIFIED SERVICES - Business/Management Services
|
$90.84
|
-0.37
-0.41% |
$92.19
|
3,367,344
63.47% of 50 DAV
50 DAV is 5,305,100
|
$95.87
-5.25%
|
10/24/2011
|
$94.21
|
PP = $94.85
|
|
MB = $99.59
|
Most Recent Note - 11/18/2011 5:51:25 PM
Y - Down today on lighter volume finishing near its 50 DMA line previously noted as near-term chart support to watch. A violation of that important short-term average line would trigger more worrisome technical sell signals.
>>> The latest Featured Stock Update with an annotated graph appeared on 11/18/2011. Click here.
View all notes |
Alert me of new notes |
CANSLIM.net Company Profile |
SEC |
Zacks Reports |
StockTalk |
News |
Chart |
Request a new note
C
A N
S L
I M
|