You are not logged in.
This means you
CAN ONLY VIEW reports that were published prior to Tuesday, April 15, 2025.
You
MUST UPGRADE YOUR MEMBERSHIP if you want to see any current reports.
AFTER MARKET UPDATE - WEDNESDAY, NOVEMBER 23RD, 2011
Previous After Market Report Next After Market Report >>>
|
|
|
|
DOW |
-236.17 |
11,257.55 |
-2.05% |
|
Volume |
875,986,270 |
-0% |
|
Volume |
1,679,693,050 |
-4% |
|
NASDAQ |
-61.20 |
2,460.08 |
-2.43% |
|
Advancers |
357 |
11% |
|
Advancers |
383 |
14% |
|
S&P 500 |
-26.25 |
1,161.79 |
-2.21% |
|
Decliners |
2,693 |
86% |
|
Decliners |
2,164 |
82% |
|
Russell 2000 |
-21.92 |
674.34 |
-3.15% |
|
52 Wk Highs |
32 |
|
|
52 Wk Highs |
6 |
|
|
S&P 600 |
-11.48 |
375.98 |
-2.96% |
|
52 Wk Lows |
170 |
|
|
52 Wk Lows |
199 |
|
|
We wish all members and their loved ones a very happy and healthy Thanksgiving Day! May your holiday be filled with many blessings! Note that there will be earlier than usual reports on Friday's abbreviated session.
|
 |
Indices Flash Red Ahead Of Thanksgiving and Black Friday
Kenneth J. Gruneisen - Passed the CAN SLIM® Master's Exam
The major averages finished near session lows ahead of the Thanksgiving holiday with slightly lighter volume totals reported on the NYSE and on the Nasdaq exchange. Decliners led advancers by more than 7-1 on the NYSE and by more than 5-1 on the Nasdaq exchange. New 52-week lows solidly outnumbered new 52-week highs on the Nasdaq exchange and on the NYSE while the new 52-week highs total on the Nasdaq exchange was in the single digits. There were 2 high-ranked companies from the CANSLIM.net Leaders List that made new 52-week highs and appeared on the CANSLIM.net BreakOuts Page, down from the prior session total of 9 stocks. There were gains for only 2 of the 16 high-ranked companies currently included on the Featured Stocks Page.
Stocks fell as investors were clearly not enthused about both disappointing economic data and a German bond auction. New applications for unemployment benefits ticked higher last week, rising 2,000 to 393,000. Durable goods orders unexpectedly rose in October, but sharp downward revisions suggested manufacturing took a breather. The University of Michigan's final November consumer sentiment index rose to 64.1 from a final October reading of 60.9, but came in below consensus estimates. Overseas, an auction of 10-year German bunds was met with poor demand, possibly indicating the country's debt has lost its safe-haven appeal. The cost of insuring European government debt against default rose to a record on concern the region's crisis is worsening. Also on the data front, Chinese manufacturing activity contracted, signaling a possible hard landing.
Financials led losses and Bank of America Corp (BAC -4.28%) suffered its 6th consecutive loss and 3rd straight new low close for the year. Citigroup Inc (C -3.88%) and Morgan Stanley (MS -3.62%) gave up ground as each ended at its second-lowest close of the year. Banks were lower after the Federal Reserve announced plans for a new round of stress tests. The nation's six largest banks will be included to see if they could withstand a possible market shock, such as an escalation of the European debt crisis.
European markets searched for direction. The London FTSE was down -0.75%, while the DAX in Frankfurt was off -0.28%. The day's auction of $29 billion in 7-year notes was well received and the 10-year note was up 11/32 to yield 1.87%. Crude oil dropped to near $96 a barrel and gold fell under $1,700 as the dollar saw bids.
Our monthly newsletter CANSLIM.net News will be published soon with an informative review of current market conditions, leading groups, and best buy candidates. Via the Premium Member Homepage links to all prior reports and webcasts are always available.
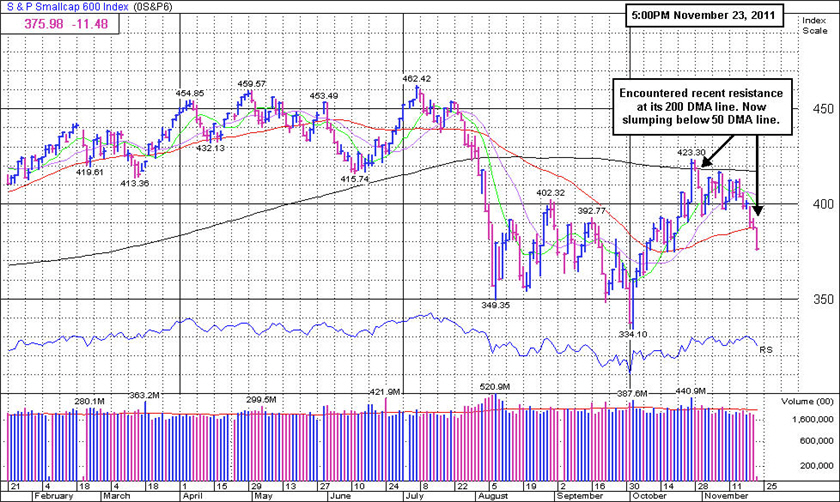
PICTURED: The S&P 600 Small Cap Index has not been featured in this commentary for a long time, but its action tells us a lot about the action in growth stocks. The small cap index encountered resistance recently at its 200-day moving average (DMA) line, and now it has slumped below its 50 DMA line. Fans of the fact-based investment system may note that the major averages (M criteria) have recently been taking a more ominous turn. This is a reminder to keep losses small and keep exposure to risk limited. Meanwhile maintain a watchlist of worthy candidates for when a healthier market rally resumes.
|
 Kenneth J. Gruneisen started out as a licensed stockbroker in August 1987, a couple of months prior to the historic stock market crash that took the Dow Jones Industrial Average down -22.6% in a single day. He has published daily fact-based fundamental and technical analysis on high-ranked stocks online for two decades. Through FACTBASEDINVESTING.COM, Kenneth provides educational articles, news, market commentary, and other information regarding proven investment systems that work in good times and bad.
Comments contained in the body of this report are technical opinions only and are not necessarily those of Gruneisen Growth Corp. The material herein has been obtained from sources believed to be reliable and accurate, however, its accuracy and completeness cannot be guaranteed. Our firm, employees, and customers may effect transactions, including transactions contrary to any recommendation herein, or have positions in the securities mentioned herein or options with respect thereto. Any recommendation contained in this report may not be suitable for all investors and it is not to be deemed an offer or solicitation on our part with respect to the purchase or sale of any securities. |
|
 |
Tech, Financial, and Commodity-Linked Groups Dropping
Kenneth J. Gruneisen - Passed the CAN SLIM® Master's Exam
The tech sector was weak on Wednesday as the Networking Index ($NWX -3.95%), Semiconductor Index ($SOX -3.19%), Internet Index ($IIX -2.63%), and Biotechnology Index ($BTK -2.25%) finished the session with unanimous losses. Financial shares also created a negative drag on the major averages as the Bank Index ($BKX -3.39%) and Broker/Dealer Index ($XBD -1.67%) slumped, and the Retail Index ($RLX -1.99%) also had a negative influence. Commodity-linked groups and defensive areas also suffered damaging erosion as the Oil Services Index ($OSX -3.72%) and Integrated Oil Index ($XOI -2.99%) slumped with the Gold & Silver Index ($XAU -2.82%) and the weakening Healthcare Index ($HMO -2.73%).
Charts courtesy www.stockcharts.com
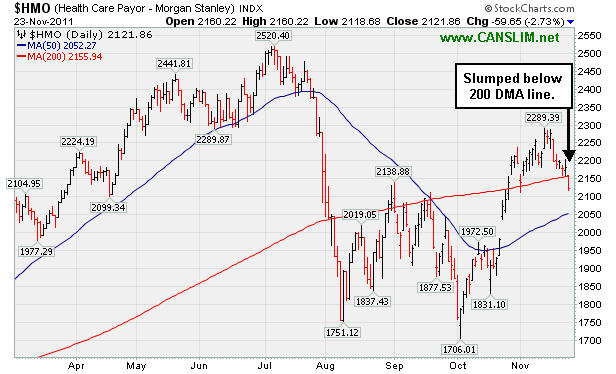
PICTURED: The Healthcare Index ($HMO -2.73%) slumped below its 200-day moving average (DMA) line.
| Oil Services |
$OSX |
209.84 |
-8.10 |
-3.72% |
-14.39% |
| Healthcare |
$HMO |
2,121.86 |
-59.65 |
-2.73% |
+25.41% |
| Integrated Oil |
$XOI |
1,124.69 |
-34.65 |
-2.99% |
-7.29% |
| Semiconductor |
$SOX |
348.17 |
-11.49 |
-3.19% |
-15.46% |
| Networking |
$NWX |
208.49 |
-8.57 |
-3.95% |
-25.69% |
| Internet |
$IIX |
269.46 |
-7.27 |
-2.63% |
-12.43% |
| Broker/Dealer |
$XBD |
76.03 |
-1.29 |
-1.67% |
-37.43% |
| Retail |
$RLX |
504.47 |
-10.26 |
-1.99% |
-0.77% |
| Gold & Silver |
$XAU |
189.71 |
-5.50 |
-2.82% |
-16.27% |
| Bank |
$BKX |
34.72 |
-1.22 |
-3.39% |
-33.50% |
| Biotech |
$BTK |
1,009.46 |
-23.23 |
-2.25% |
-22.21% |
|
|
|
 |
Deterioration Following Failed Breakout Attempt
Kenneth J. Gruneisen - Passed the CAN SLIM® Master's Exam
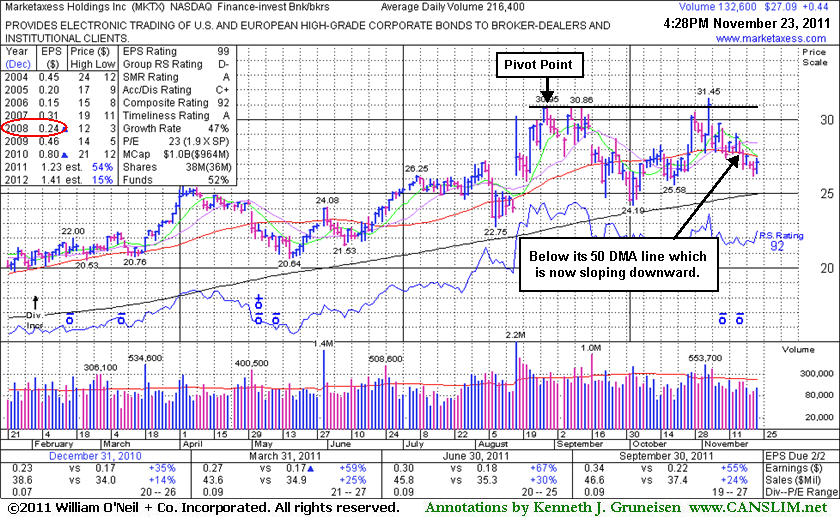
Marketaxess Holdings Inc (MKTX +$0.44 or +1.65% to $27.09) has been sputtering for weeks without meaningful volume-driven gains for any progress. Its 50-day moving average (DMA) line is now downward sloping, and the longer it remains below that important short-term average the worse its outlook gets. Prior lows and its 200 DMA line in the $24-25 area define the next important support area to watch. Its last appearance in this FSU section was on 10/31/11 with an annotated graph under the headline, "Perched Near Highs Working on Base-On-Base Type Pattern", after an 8-week base-on-base type consolidation. It had been featured in yellow in the 10/28/11 mid-day report (read here) as a new pivot point cited was based on its 52-week high plus 10 cents.
On November 3rd it nearly met the guidelines as a buy candidate, however it was noted that evening - "Hit a new 52-week high and traded above its pivot point today, however it closed below the mark and volume was just +21% above average behind the considerable gain. The minimum guideline requires at least +40% above average volume behind a gain above a stock's pivot point to trigger a proper new (or add-on) technical buy signal. Disciplined investors may use a tactic called pyramiding to accumulate shares without chasing the stock outside of the ideal buy range." Subsequent weakness raised concerns and its color code was changed to green as it sank below its 50 DMA line. Any investors who may have made initial purchases using the "pyramiding" approach would not have accumulated a full position before the subsequent weakness prompted defensive action and the sale of the partial position if it fell -7% from the buy price. This loss-limiting example demonstrates the value of carefully following the fact-based system as investors are trained in the Certification.
Its fundamentals remain strong and it just reported earnings +55% on +24% sales revenues for the quarter ended September 30, 2011 versus the year ago period. MKTX has earned high ranks and reasonably satisfies the guidelines concerning quarterly and annual earnings (C and A criteria), however a downturn in FY '08 (see red oval) was previously noted as a flaw. Additionally, the Finance - Investment Bankers industry group currently has a Group Relative Strength rating of D- which indicates the group has been a poor performer rather than a strong leader (L criteria). The number of top-rated funds owning its shares rose from 168 in Dec '10 to 236 in Sep '11, a reassuring sign concerning the I criteria.
All prior notes can be reviewed on the Company Profile page under the "View All Notes" tab. The "Featured Articles and Daily Graphs" tab on the Company Profile page allows members to view all of the previous detailed analysis and annotated graphs published on any stocks we have covered.
|
|
|
Color Codes Explained :
Y - Better candidates highlighted by our
staff of experts.
G - Previously featured
in past reports as yellow but may no longer be buyable under the
guidelines.
***Last / Change / Volume data in this table is the closing quote data***
Symbol/Exchange
Company Name
Industry Group |
PRICE |
CHANGE
(%Change) |
Day High |
Volume
(% DAV)
(% 50 day avg vol) |
52 Wk Hi
% From Hi |
Featured
Date |
Price
Featured |
Pivot Featured |
|
Max Buy |
ADS
-
NYSE
Alliance Data Sys Corp
COMPUTER SOFTWARE and SERVICES - Information and Delivery Service
|
$93.46
|
-1.30
-1.37% |
$94.03
|
707,734
74.51% of 50 DAV
50 DAV is 949,900
|
$107.18
-12.80%
|
10/21/2011
|
$97.94
|
PP = $101.15
|
|
MB = $106.21
|
Most Recent Note - 11/18/2011 6:01:31 PM
G - Down today on near average volume for its 5th consecutive loss leading to deterioration deeper into its prior base. Violated support at its 50 DMA line raising concerns and its color code is changed to green.
>>> The latest Featured Stock Update with an annotated graph appeared on 11/17/2011. Click here.
View all notes |
Alert me of new notes |
CANSLIM.net Company Profile |
SEC |
Zacks Reports |
StockTalk |
News |
Chart |
Request a new note
C
A N
S L
I M


|
ALXN
-
NASDAQ
Alexion Pharmaceuticals
DRUGS - Drug Manufacturers - Other
|
$64.87
|
-1.31
-1.98% |
$66.00
|
836,559
54.99% of 50 DAV
50 DAV is 1,521,300
|
$70.42
-7.88%
|
9/15/2011
|
$63.20
|
PP = $60.81
|
|
MB = $63.85
|
Most Recent Note - 11/22/2011 5:38:47 PM
Y - Gain today on lighter volume helped it close back above its 50 DMA line. Deterioration below recent chart lows ($67.72 on 11/10/11) would raise concerns and trigger technical sell signals.
>>> The latest Featured Stock Update with an annotated graph appeared on 11/14/2011. Click here.
View all notes |
Alert me of new notes |
CANSLIM.net Company Profile |
SEC |
Zacks Reports |
StockTalk |
News |
Chart |
Request a new note
C
A N
S L
I M
|
CATM
-
NASDAQ
Cardtronics Inc
DIVERSIFIED SERVICES - Business/Management Services
|
$23.51
|
-0.81
-3.33% |
$24.42
|
399,304
94.69% of 50 DAV
50 DAV is 421,700
|
$28.46
-17.39%
|
11/8/2011
|
$25.99
|
PP = $25.95
|
|
MB = $27.25
|
 Most Recent Note - 11/23/2011 3:41:17 PM
G - Color code is changed to green today while falling for a 6th consecutive loss, slumping below its 50 DMA line and raising concerns by its technical deterioration.
>>> The latest Featured Stock Update with an annotated graph appeared on 11/8/2011. Click here.
View all notes |
Alert me of new notes |
CANSLIM.net Company Profile |
SEC |
Zacks Reports |
StockTalk |
News |
Chart |
Request a new note
C
A N
S L
I M
|
CELG
-
NASDAQ
Celgene Corp
DRUGS - Drug Manufacturers - Major
|
$60.43
|
-1.26
-2.04% |
$61.30
|
2,839,430
73.91% of 50 DAV
50 DAV is 3,841,700
|
$68.25
-11.46%
|
9/16/2011
|
$61.21
|
PP = $62.59
|
|
MB = $65.72
|
Most Recent Note - 11/21/2011 1:46:58 PM
G -Gapped down today for a damaging loss following last week's violation of its 50 DMA line. Color code is changed to green while the slump below its previously noted chart low ($62.71 on 11/01/11) raises greater concerns and triggers a worrisome technical sell signal.
>>> The latest Featured Stock Update with an annotated graph appeared on 11/7/2011. Click here.
View all notes |
Alert me of new notes |
CANSLIM.net Company Profile |
SEC |
Zacks Reports |
StockTalk |
News |
Chart |
Request a new note
C
A N
S L
I M
|
FEIC
-
NASDAQ
F E I Co
ELECTRONICS - Diversified Electronics
|
$36.90
|
-0.08
-0.22% |
$37.18
|
344,917
78.95% of 50 DAV
50 DAV is 436,900
|
$42.25
-12.66%
|
10/28/2011
|
$40.31
|
PP = $40.88
|
|
MB = $42.92
|
Most Recent Note - 11/22/2011 5:36:13 PM
G - Color code is changed to green as it slumps further below its pivot point, finishing -12.5% off its 52-week high today. Disciplined investors limit losses if a stock falls more than -7% from their purchase price.
>>> The latest Featured Stock Update with an annotated graph appeared on 10/28/2011. Click here.
View all notes |
Alert me of new notes |
CANSLIM.net Company Profile |
SEC |
Zacks Reports |
StockTalk |
News |
Chart |
Request a new note
C
A N
S L
I M
|
Symbol/Exchange
Company Name
Industry Group |
PRICE |
CHANGE
(%Change) |
Day High |
Volume
(% DAV)
(% 50 day avg vol) |
52 Wk Hi
% From Hi |
Featured
Date |
Price
Featured |
Pivot Featured |
|
Max Buy |
GNC
-
NYSE
G N C Holdings Inc
RETAIL - Drug Stores
|
$27.03
|
-0.22
-0.81% |
$27.26
|
1,121,257
87.30% of 50 DAV
50 DAV is 1,284,300
|
$27.99
-3.43%
|
10/26/2011
|
$24.60
|
PP = $24.80
|
|
MB = $26.04
|
Most Recent Note - 11/22/2011 5:37:31 PM
G - Gain today on near average volume for its best-ever close. See the latest FSU analysis for more details and a new annotated graph.
>>> The latest Featured Stock Update with an annotated graph appeared on 11/21/2011. Click here.
View all notes |
Alert me of new notes |
CANSLIM.net Company Profile |
SEC |
Zacks Reports |
StockTalk |
News |
Chart |
Request a new note
C
A N
S L
I M
|
HMSY
-
NASDAQ
H M S Holdings Corp
COMPUTER SOFTWARE and SERVICES - Healthcare Information Service
|
$28.24
|
-0.87
-2.99% |
$29.21
|
621,473
91.58% of 50 DAV
50 DAV is 678,600
|
$31.99
-11.72%
|
10/27/2011
|
$26.44
|
PP = $28.37
|
|
MB = $29.79
|
Most Recent Note - 11/23/2011 3:44:58 PM
Y - Color code is changed to yellow while consolidating quietly above prior highs in the $27-28 area noted previously as support to watch on pullbacks. Its high was marked by a negative reversal on 11/14/11 after hitting a new all-time high.
>>> The latest Featured Stock Update with an annotated graph appeared on 11/4/2011. Click here.
View all notes |
Alert me of new notes |
CANSLIM.net Company Profile |
SEC |
Zacks Reports |
StockTalk |
News |
Chart |
Request a new note
C
A N
S L
I M
|
ISRG
-
NASDAQ
Intuitive Surgical Inc
HEALTH SERVICES - Medical Appliances and Equipment
|
$416.93
|
-1.75
-0.42% |
$422.41
|
233,738
56.64% of 50 DAV
50 DAV is 412,700
|
$449.06
-7.15%
|
10/19/2011
|
$424.69
|
PP = $415.29
|
|
MB = $436.05
|
Most Recent Note - 11/23/2011 3:48:28 PM
Y - Color code is changed to yellow while quietly consolidating just above its 50 DMA line and above the old high which was the basis for the last pivot point cited. More damaging losses would raise greater concerns and trigger technical sell signals.
>>> The latest Featured Stock Update with an annotated graph appeared on 11/15/2011. Click here.
View all notes |
Alert me of new notes |
CANSLIM.net Company Profile |
SEC |
Zacks Reports |
StockTalk |
News |
Chart |
Request a new note
C
A N
S L
I M
|
MG
-
NYSE
Mistras Group Inc
DIVERSIFIED SERVICES - Bulding and Faci;ity Management Services
|
$20.96
|
-0.40
-1.87% |
$21.32
|
120,166
58.02% of 50 DAV
50 DAV is 207,100
|
$23.51
-10.85%
|
10/28/2011
|
$22.49
|
PP = $23.61
|
|
MB = $24.79
|
Most Recent Note - 11/23/2011 3:53:06 PM
Y - Quietly consolidating near its 50 DMA line and prior highs defining important chart support to watch near $21. More damaging losses would raise concerns and trigger a technical sell signal
>>> The latest Featured Stock Update with an annotated graph appeared on 11/11/2011. Click here.
View all notes |
Alert me of new notes |
CANSLIM.net Company Profile |
SEC |
Zacks Reports |
StockTalk |
News |
Chart |
Request a new note
C
A N
S L
I M
|
MKTX
-
NASDAQ
Marketaxess Holdings Inc
FINANCIAL SERVICES - Investment Brokerage - Nationa
|
$27.09
|
+0.44
1.65% |
$27.38
|
158,859
65.62% of 50 DAV
50 DAV is 242,100
|
$31.45
-13.86%
|
10/28/2011
|
$29.79
|
PP = $31.05
|
|
MB = $32.60
|
Most Recent Note - 11/23/2011 3:56:05 PM
G - The longer it remains below its 50 DMA line the worse its outlook gets. Prior lows and its 200 DMA line in the $24-25 area define the next support area to watch.
>>> The latest Featured Stock Update with an annotated graph appeared on 11/23/2011. Click here.
View all notes |
Alert me of new notes |
CANSLIM.net Company Profile |
SEC |
Zacks Reports |
StockTalk |
News |
Chart |
Request a new note
C
A N
S L
I M
|
Symbol/Exchange
Company Name
Industry Group |
PRICE |
CHANGE
(%Change) |
Day High |
Volume
(% DAV)
(% 50 day avg vol) |
52 Wk Hi
% From Hi |
Featured
Date |
Price
Featured |
Pivot Featured |
|
Max Buy |
OSIS
-
NASDAQ
O S I Systems Inc
ELECTRONICS - Semiconductor Equipment and Mate
|
$42.80
|
-1.53
-3.45% |
$43.89
|
100,478
67.71% of 50 DAV
50 DAV is 148,400
|
$47.39
-9.69%
|
11/1/2011
|
$42.07
|
PP = $45.57
|
|
MB = $47.85
|
Most Recent Note - 11/23/2011 3:34:42 PM
G - Gapped down again today, slumping well below its pivot point with another loss on light volume. Color code is changed to green while consolidating well above its 50 DMA line. There were no confirming gains backed by volume, and it has instead endured distributional pressure.
>>> The latest Featured Stock Update with an annotated graph appeared on 11/1/2011. Click here.
View all notes |
Alert me of new notes |
CANSLIM.net Company Profile |
SEC |
Zacks Reports |
StockTalk |
News |
Chart |
Request a new note
C
A N
S L
I M
|
RAX
-
NYSE
Rackspace Hosting Inc
INTERNET - Internet Software and; Services
|
$39.50
|
-1.39
-3.40% |
$40.60
|
804,100
50.55% of 50 DAV
50 DAV is 1,590,600
|
$46.50
-15.04%
|
11/8/2011
|
$44.28
|
PP = $46.27
|
|
MB = $48.58
|
Most Recent Note - 11/23/2011 3:38:24 PM
G - Pulling back again today on light volume, slumping very near support at its 50 and 200 DMA lines. Subsequent violations would trigger damaging technical sell signals, meanwhile it faces near-term resistance up through the $45 area.
>>> The latest Featured Stock Update with an annotated graph appeared on 11/10/2011. Click here.
View all notes |
Alert me of new notes |
CANSLIM.net Company Profile |
SEC |
Zacks Reports |
StockTalk |
News |
Chart |
Request a new note
C
A N
S L
I M
|
SWI
-
NYSE
Solarwinds Inc
COMPUTER SOFTWARE and SERVICES - Application Software
|
$30.47
|
-0.29
-0.94% |
$31.15
|
1,012,340
86.36% of 50 DAV
50 DAV is 1,172,200
|
$31.69
-3.85%
|
10/27/2011
|
$27.78
|
PP = $25.62
|
|
MB = $26.90
|
Most Recent Note - 11/22/2011 5:41:42 PM
G - Holding its ground near its all-time high, extended from its previous base pattern. Prior highs in the $25-26 area define initial chart support to watch on pullbacks. See the latest FSU analysis for more details and a new annotated graph.
>>> The latest Featured Stock Update with an annotated graph appeared on 11/22/2011. Click here.
View all notes |
Alert me of new notes |
CANSLIM.net Company Profile |
SEC |
Zacks Reports |
StockTalk |
News |
Chart |
Request a new note
C
A N
S L
I M
|
TDG
-
NYSE
Transdigm Group Inc
AEROSPACE/DEFENSE - Aerospace/Defense Products and; Services
|
$90.83
|
-1.99
-2.14% |
$92.35
|
264,036
63.93% of 50 DAV
50 DAV is 413,000
|
$102.73
-11.58%
|
11/9/2011
|
$98.45
|
PP = $95.14
|
|
MB = $99.90
|
Most Recent Note - 11/18/2011 5:48:01 PM
Y - Held its ground today following a negative reversal on the prior session after hitting a new 52-week high. A volume-driven gain on 11/08/11 helped it break out from a 19-week base. Reported earnings +42% on +54% sales revenues for the quarter ended September 30, 2011.
>>> The latest Featured Stock Update with an annotated graph appeared on 11/9/2011. Click here.
View all notes |
Alert me of new notes |
CANSLIM.net Company Profile |
SEC |
Zacks Reports |
StockTalk |
News |
Chart |
Request a new note
C
A N
S L
I M
|
UA
-
NYSE
Under Armour Inc Cl A
CONSUMER NON-DURABLES - Textile - Apparel Clothing
|
$76.43
|
+1.37
1.83% |
$77.00
|
982,582
73.97% of 50 DAV
50 DAV is 1,328,400
|
$87.40
-12.55%
|
10/25/2011
|
$82.43
|
PP = $80.80
|
|
MB = $84.84
|
Most Recent Note - 11/18/2011 5:50:09 PM
Y - Volume was lighter than average today as it sank further below prior highs near $80 previously noted as initial support, technically negating its recent breakout and raising concerns. It is currently testing important chart support at its 50 DMA line.
>>> The latest Featured Stock Update with an annotated graph appeared on 11/3/2011. Click here.
View all notes |
Alert me of new notes |
CANSLIM.net Company Profile |
SEC |
Zacks Reports |
StockTalk |
News |
Chart |
Request a new note
C
A N
S L
I M
|
Symbol/Exchange
Company Name
Industry Group |
PRICE |
CHANGE
(%Change) |
Day High |
Volume
(% DAV)
(% 50 day avg vol) |
52 Wk Hi
% From Hi |
Featured
Date |
Price
Featured |
Pivot Featured |
|
Max Buy |
V
-
NYSE
Visa Inc Cl A
DIVERSIFIED SERVICES - Business/Management Services
|
$89.29
|
-1.55
-1.71% |
$91.76
|
5,266,023
99.26% of 50 DAV
50 DAV is 5,305,100
|
$95.87
-6.86%
|
10/24/2011
|
$94.21
|
PP = $94.85
|
|
MB = $99.59
|
Most Recent Note - 11/18/2011 5:51:25 PM
Y - Down today on lighter volume finishing near its 50 DMA line previously noted as near-term chart support to watch. A violation of that important short-term average line would trigger more worrisome technical sell signals.
>>> The latest Featured Stock Update with an annotated graph appeared on 11/18/2011. Click here.
View all notes |
Alert me of new notes |
CANSLIM.net Company Profile |
SEC |
Zacks Reports |
StockTalk |
News |
Chart |
Request a new note
C
A N
S L
I M
|
|
|
|
THESE ARE NOT BUY RECOMMENDATIONS!
Comments contained in the body of this report are technical
opinions only. The material herein has been obtained
from sources believed to be reliable and accurate, however,
its accuracy and completeness cannot be guaranteed.
This site is not an investment advisor, hence it does
not endorse or recommend any securities or other investments.
Any recommendation contained in this report may not
be suitable for all investors and it is not to be deemed
an offer or solicitation on our part with respect to
the purchase or sale of any securities. All trademarks,
service marks and trade names appearing in this report
are the property of their respective owners, and are
likewise used for identification purposes only.
This report is a service available
only to active Paid Premium Members.
You may opt-out of receiving report notifications
at any time. Questions or comments may be submitted
by writing to Premium Membership Services 665 S.E. 10 Street, Suite 201 Deerfield Beach, FL 33441-5634 or by calling 1-800-965-8307
or 954-785-1121.
|
|
|

