You are not logged in.
This means you
CAN ONLY VIEW reports that were published prior to Monday, April 14, 2025.
You
MUST UPGRADE YOUR MEMBERSHIP if you want to see any current reports.
AFTER MARKET UPDATE - FRIDAY, NOVEMBER 21ST, 2014
Previous After Market Report Next After Market Report >>>
|
|
|
|
DOW |
+91.06 |
17,810.06 |
+0.51% |
|
Volume |
1,018,952,670 |
+58% |
|
Volume |
1,718,500,620 |
+12% |
|
NASDAQ |
+11.10 |
4,712.97 |
+0.24% |
|
Advancers |
2,046 |
64% |
|
Advancers |
1,570 |
53% |
|
S&P 500 |
+10.75 |
2,063.50 |
+0.52% |
|
Decliners |
1,043 |
33% |
|
Decliners |
1,306 |
44% |
|
Russell 2000 |
+1.66 |
1,172.42 |
+0.14% |
|
52 Wk Highs |
216 |
|
|
52 Wk Highs |
134 |
|
|
S&P 600 |
+0.45 |
677.36 |
+0.07% |
|
52 Wk Lows |
13 |
|
|
52 Wk Lows |
48 |
|
|
 |
Rally Continues Lifting Dow and S&P 500 Index to New Record Highs
Kenneth J. Gruneisen - Passed the CAN SLIM® Master's Exam
For the week, the Dow rose +1%, the S&P 500 advanced +1.2% and the NASDAQ Composite gained +0.5%. Behind Friday's gains the volume totals were reported higher than the prior session totals on the NYSE and on the Nasdaq exchange, boosted by options expirations. Breadth was positive as advancers led decliners by almost a 2-1 margin on the NYSE, however advancers led decliners by a narrower 8-7 margin on the Nasdaq exchange. There were 96 high-ranked companies from the CANSLIM.net Leaders List that made new 52-week highs and appeared on the CANSLIM.net BreakOuts Page, more than doubling the prior session total of 44 stocks. New 52-week highs expanded and easily outnumbered new 52-week lows on the NYSE and on the Nasdaq exchange. There were gains for 6 of the 12 high-ranked companies currently on the Featured Stocks Page. Since large gains were noted on 10/21/14 backed by higher volume totals as leadership (stocks hitting new 52-week highs) expanded, a "confirmed uptrend" for the market (M criteria) has been repeatedly noted in this daily Market Commentary.
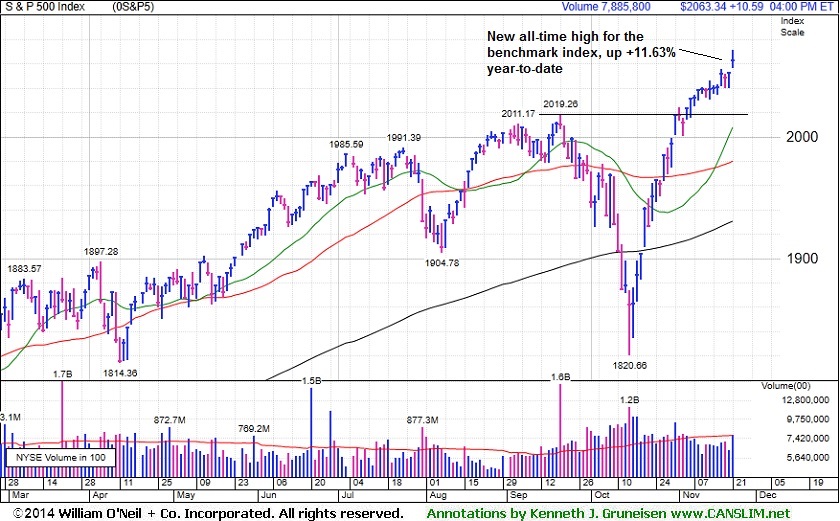
PICTURED: The S&P 500 Index gained 11 points to reach an all-time high of 2,063, up +11.6% year-to-date.
The Dow rose 91 points to a record level of 17,810. The NASDAQ Composite advanced 11 points to 4,712.
The major averages ended firmly in positive territory amid optimism surrounding central bank support of global growth. In a surprise move, the People’s Bank of China cut its benchmark interest rate for the first time in more than two years. ECB President Mario Draghi said in a speech in Frankfurt that policy makers are prepared to increase stimulus measures to bolster the Euro zone's economy.
Materials were the best performing sector in the S&P 500. Metal producer Allegheny Technology (ATI +5.8%) to pace the group's advance. Industrials and energy also led the market higher with Caterpillar (CAT +4.3%) and Chevron (CVX +1.1%) posting gains. Retailers were active on the session. Ross Stores (ROST +7.3%) rose after increasing its full-year guidance. GameStop (GME -13.1%) sank on its reduced profit forecast.
Treasuries rose with the 10-year note gaining 8/32 to yield 2.31%. In commodities, WTI crude oil increased 1% to $76.63/barrel on the NYMEX. COMEX gold futures were up 0.8% to $1,200.60/ounce.
Disciplined investors know that new buying efforts may be made under the fact-based investment system only in stocks meeting all key criteria. The Featured Stocks Page shows the most action-worthy candidates and their latest notes and a Headline Link directs members to the latest detailed analysis with data-packed graphs annotated by a Certified expert along with links to additional resources. The Premium Member Homepage includes "dynamic archives" to all prior pay reports published.
|
 Kenneth J. Gruneisen started out as a licensed stockbroker in August 1987, a couple of months prior to the historic stock market crash that took the Dow Jones Industrial Average down -22.6% in a single day. He has published daily fact-based fundamental and technical analysis on high-ranked stocks online for two decades. Through FACTBASEDINVESTING.COM, Kenneth provides educational articles, news, market commentary, and other information regarding proven investment systems that work in good times and bad.
Comments contained in the body of this report are technical opinions only and are not necessarily those of Gruneisen Growth Corp. The material herein has been obtained from sources believed to be reliable and accurate, however, its accuracy and completeness cannot be guaranteed. Our firm, employees, and customers may effect transactions, including transactions contrary to any recommendation herein, or have positions in the securities mentioned herein or options with respect thereto. Any recommendation contained in this report may not be suitable for all investors and it is not to be deemed an offer or solicitation on our part with respect to the purchase or sale of any securities. |
|
 |
Commodity-Linked Groups, Tech, and Retailers Posted Gains
Kenneth J. Gruneisen - Passed the CAN SLIM® Master's Exam
Financial shares were mixed and little changed as the Broker/Dealer Index ($XBD -0.25%) edged lower and the Bank Index ($BKX +0.11%) inched higher. The Semiconductor Index ($SOX +1.02%) led the tech sector higher while the Biotechnology Index ($BTK +0.62%) and the Networking Index ($NWX +0.14%) posted smaller gains. The Retail Index ($RLX +0.39%) posted a modest gain. Commodity-linked groups had a positive bias as the Integrated Oil Index ($XOI +1.80%) and the Oil Services Index ($OSX +2.19%) both outpaced the Gold & Silver Index ($XAU +0.96%).
Charts courtesy www.stockcharts.com
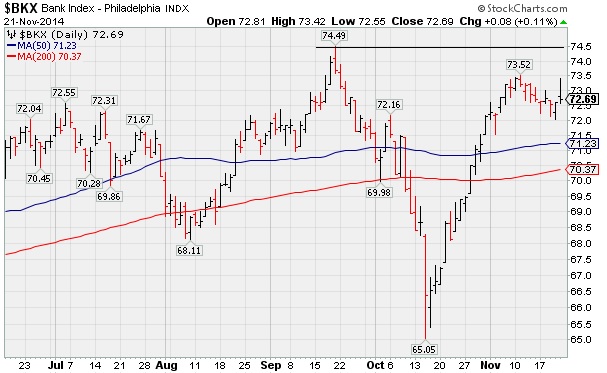
PICTURED: The Bank Index ($BKX +0.11%) is consolidating above its 50-day and 200-day moving average (DMA) lines.
| Oil Services |
$OSX |
249.27 |
+5.34 |
+2.19% |
-11.30% |
| Integrated Oil |
$XOI |
1,485.83 |
+26.21 |
+1.80% |
-1.15% |
| Semiconductor |
$SOX |
662.95 |
+6.68 |
+1.02% |
+23.91% |
| Networking |
$NWX |
343.59 |
+0.47 |
+0.14% |
+6.06% |
| Broker/Dealer |
$XBD |
175.72 |
-0.44 |
-0.25% |
+9.44% |
| Retail |
$RLX |
995.07 |
+3.91 |
+0.39% |
+5.88% |
| Gold & Silver |
$XAU |
73.77 |
+0.70 |
+0.96% |
-12.34% |
| Bank |
$BKX |
72.69 |
+0.08 |
+0.11% |
+4.95% |
| Biotech |
$BTK |
3,342.98 |
+20.67 |
+0.62% |
+43.45% |
|
|
|
 |
No Sound Base Formed, Yet Little Resistance Remains
Kenneth J. Gruneisen - Passed the CAN SLIM® Master's Exam
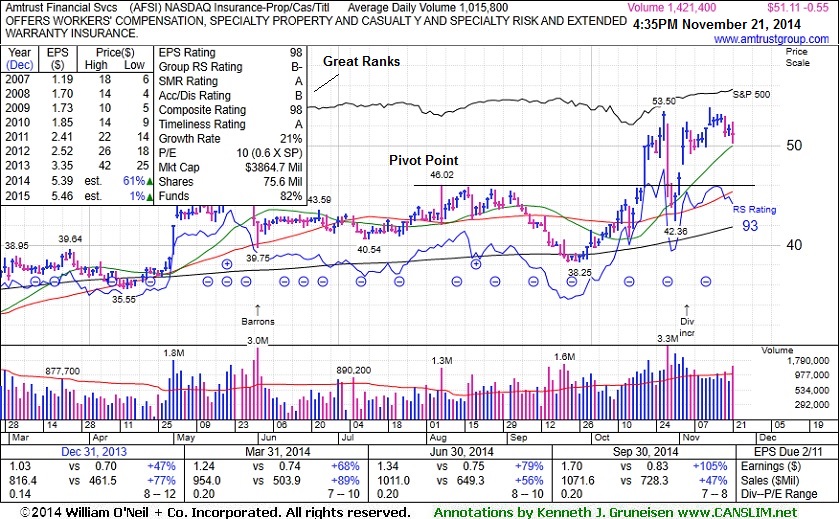
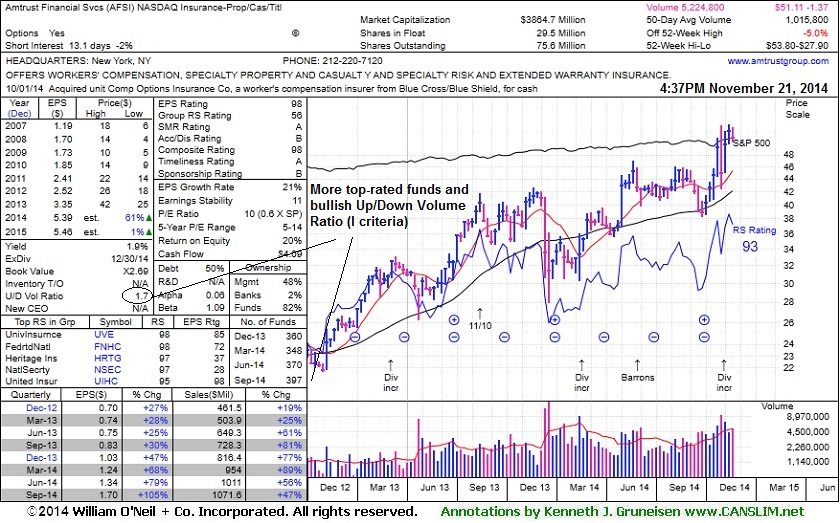
Amtrust Financial Services' (AFSI -$0.55 or -1.06% to $51.11) has recently encountered distributional pressure near its 52-week high after a streak of gains. Volume totals have been lackluster behind recent gains, not showing action indicative of lurking institutional buying demand. It faces little resistance due to overhead supply, but it has not formed a sound base. . Recent lows near $42 and its 50-day moving average (DMA) line define important near-term support to watch on pullbacks.
The high-ranked Insurance - Property/Casualty/Title firm was last shown in this FSU section on 11/05/14 with annotated graphs under the headline, "50-Day Average Acted as Support Following Analyst Downgrade". It found prompt support at its 50-day moving average (DMA) line when abruptly retreating after an analyst downgraded the stock. It was highlighted in yellow with new pivot point cited based on its 8/07/14 high in the 10/17/14 mid-day report (read here) and subsequent volume-driven gains above the pivot point triggered a technical buy signal.
The number of top-rated funds owning an interest rose from 349 in Mar '14 to 397 in Sep '14, a reassuring sign concerning the I criteria. It reported earnings +105% on +47% sales revenues for the quarter ended Sep '14 quarter versus the year ago period, its 9th consecutive comparison above the +25% minimum earnings guideline (C criteria). It has a great annual earnings (A criteria) history and it has earned an impressive 98 Earnings Per Share rating, well above the 80+ minimum rating for buy candidates. Its Relative Strength Rating is currently 93, above the 80+ minimum guideline for buy candidates.
|
|
|
Color Codes Explained :
Y - Better candidates highlighted by our
staff of experts.
G - Previously featured
in past reports as yellow but may no longer be buyable under the
guidelines.
***Last / Change / Volume data in this table is the closing quote data***
Symbol/Exchange
Company Name
Industry Group |
PRICE |
CHANGE
(%Change) |
Day High |
Volume
(% DAV)
(% 50 day avg vol) |
52 Wk Hi
% From Hi |
Featured
Date |
Price
Featured |
Pivot Featured |
|
Max Buy |
ACT
-
NYSE
Actavis plc
Medical-Generic Drugs
|
$259.75
|
+1.26
0.49% |
$262.83
|
4,511,729
144.75% of 50 DAV
50 DAV is 3,117,000
|
$270.34
-3.92%
|
6/20/2014
|
$216.53
|
PP = $230.87
|
|
MB = $242.41
|
 Most Recent Note - 11/21/2014 12:17:33 PM
G - Consolidating after spiking to new 52-week highs with volume-driven gains following news it plans to acquire Allergan (AGN) for $66 Billion. Did not form a sound new base and its color code was changed to green while getting extended from prior highs. Its 50 DMA line ($240) defines support where a violation would raise concerns.
>>> FEATURED STOCK ARTICLE : New Highs Following Deep "V" Shaped Pullback - Not a Sound Base - 11/6/2014
View all notes |
Set NEW NOTE alert |
CANSLIM.net Company Profile |
SEC
News |
Chart |
Request a new note
C
A N
S L
I M


|
AFSI
-
NASDAQ
Amtrust Financial Svcs
INSURANCE - Property and; Casualty Insurance
|
$51.00
|
-0.66
-1.28% |
$52.38
|
1,436,478
141.52% of 50 DAV
50 DAV is 1,015,000
|
$53.80
-5.20%
|
10/17/2014
|
$45.24
|
PP = $46.02
|
|
MB = $48.32
|
Most Recent Note - 11/21/2014 5:42:16 PM
G - Encountering distributional pressure while hovering near its 52-week high. Recent lows near $42 and its 50 DMA line define important near-term support. See the latest FSU analysis for more details and new annotated graphs.
>>> FEATURED STOCK ARTICLE : No Sound Base Formed, Yet Little Resistance Remains - 11/21/2014
View all notes |
Set NEW NOTE alert |
CANSLIM.net Company Profile |
SEC
News |
Chart |
Request a new note
C
A N
S L
I M
|
ALXN
-
NASDAQ
Alexion Pharmaceuticals
DRUGS - Drug Manufacturers - Other
|
$191.02
|
-1.53
-0.79% |
$195.87
|
1,086,275
90.75% of 50 DAV
50 DAV is 1,197,000
|
$197.64
-3.35%
|
10/23/2014
|
$184.01
|
PP = $185.53
|
|
MB = $194.81
|
Most Recent Note - 11/21/2014 5:43:36 PM
Y - Finished near the session low today with a small loss on near average volume. Still trading above its pivot point and below its "max buy" level. Prior highs in the $180 area define initial support to watch on pullbacks.
>>> FEATURED STOCK ARTICLE : New High Close With Gain on Light Volume - 11/10/2014
View all notes |
Set NEW NOTE alert |
CANSLIM.net Company Profile |
SEC
News |
Chart |
Request a new note
C
A N
S L
I M
|
BIDU
-
NASDAQ
Baidu Inc Ads
INTERNET - Internet Information Providers
|
$245.30
|
+6.91
2.90% |
$245.95
|
3,718,510
95.08% of 50 DAV
50 DAV is 3,911,000
|
$251.99
-2.65%
|
10/30/2014
|
$234.08
|
PP = $231.51
|
|
MB = $243.09
|
Most Recent Note - 11/21/2014 5:45:26 PM
G - Color code is changed to green after rising back above its "max buy" level with today's gap up gain on near average volume. Prior highs near $230 define near-term support to watch on pullbacks.
>>> FEATURED STOCK ARTICLE : Consolidating Back Below "Max Buy" Level - 11/17/2014
View all notes |
Set NEW NOTE alert |
CANSLIM.net Company Profile |
SEC
News |
Chart |
Request a new note
C
A N
S L
I M
|
EPAM
-
NYSE
Epam Systems Inc
COMPUTER SOFTWARE and SERVICES - Information Technology Service
|
$48.84
|
+0.34
0.70% |
$49.38
|
236,670
54.41% of 50 DAV
50 DAV is 435,000
|
$50.34
-2.98%
|
10/23/2014
|
$45.21
|
PP = $46.09
|
|
MB = $48.39
|
Most Recent Note - 11/20/2014 5:19:55 PM
G - Still stubbornly holding its ground above its "max buy" level. Prior highs in the $44 area defining initial support above its 50 DMA line ($43.12).
>>> FEATURED STOCK ARTICLE : Consolidating Above Prior Highs Following Technical Breakout - 11/11/2014
View all notes |
Set NEW NOTE alert |
CANSLIM.net Company Profile |
SEC
News |
Chart |
Request a new note
C
A N
S L
I M
|
Symbol/Exchange
Company Name
Industry Group |
PRICE |
CHANGE
(%Change) |
Day High |
Volume
(% DAV)
(% 50 day avg vol) |
52 Wk Hi
% From Hi |
Featured
Date |
Price
Featured |
Pivot Featured |
|
Max Buy |
FB
-
NASDAQ
Facebook Inc Cl A
INTERNET
|
$73.75
|
+0.15
0.20% |
$74.50
|
23,032,691
59.77% of 50 DAV
50 DAV is 38,537,000
|
$81.16
-9.13%
|
9/9/2014
|
$76.67
|
PP = $76.84
|
|
MB = $80.68
|
Most Recent Note - 11/20/2014 5:21:28 PM
G - Volume totals have been cooling and recent gains have lacked volume conviction. Its outlook gets worse the longer it lingers below its 50 DMA line.
>>> FEATURED STOCK ARTICLE : Following Violation 50-Day Average Acted as Resistance - 11/14/2014
View all notes |
Set NEW NOTE alert |
CANSLIM.net Company Profile |
SEC
News |
Chart |
Request a new note
C
A N
S L
I M
|
FLT
-
NYSE
Fleetcor Technologies
DIVERSIFIED SERVICES - Business/Management Services
|
$155.99
|
+0.91
0.59% |
$160.40
|
1,082,232
147.85% of 50 DAV
50 DAV is 732,000
|
$157.91
-1.22%
|
10/31/2014
|
$148.50
|
PP = $146.29
|
|
MB = $153.60
|
Most Recent Note - 11/21/2014 12:28:10 PM
G - Hit new 52-week and all-time highs and rallied further above its "max buy level" with today's 5th consecutive gain. Prior highs in the $146-149 area define initial support to watch on pullbacks.
>>> FEATURED STOCK ARTICLE : Consolidation Continues Above Prior Highs - 11/18/2014
View all notes |
Set NEW NOTE alert |
CANSLIM.net Company Profile |
SEC
News |
Chart |
Request a new note
C
A N
S L
I M
|
ILMN
-
NASDAQ
Illumina Inc
DRUGS - Biotechnology
|
$185.83
|
-0.43
-0.23% |
$191.20
|
796,127
62.64% of 50 DAV
50 DAV is 1,271,000
|
$197.37
-5.85%
|
10/22/2014
|
$188.77
|
PP = $182.27
|
|
MB = $191.38
|
Most Recent Note - 11/18/2014 5:32:33 PM
Y - Rallied back near its "max buy" level with today's 2nd consecutive gain. Prior highs near $182 acted as support on the recent pullback. More damaging losses would raise concerns and trigger a technical sell signal.
>>> FEATURED STOCK ARTICLE : Consolidating Above Prior Highs Which Define Initial Support - 11/7/2014
View all notes |
Set NEW NOTE alert |
CANSLIM.net Company Profile |
SEC
News |
Chart |
Request a new note
C
A N
S L
I M
|
NBCB
-
NASDAQ
First N B C Bank Hldg
Banks-Southeast
|
$36.85
|
-0.17
-0.46% |
$37.54
|
57,386
75.51% of 50 DAV
50 DAV is 76,000
|
$38.18
-3.48%
|
10/31/2014
|
$36.31
|
PP = $35.93
|
|
MB = $37.73
|
Most Recent Note - 11/19/2014 7:03:26 PM
Y - Fell today for a 5th consecutive session with below volume and its color code was changed to yellow after pulling back below its "max buy" level. Prior highs near $34 define near-term support to watch on pullbacks. See the latest FSU analysis for the additional details and new annotated graphs.
>>> FEATURED STOCK ARTICLE : Fifth Consecutive Loss While Retreating From Highs - 11/19/2014
View all notes |
Set NEW NOTE alert |
CANSLIM.net Company Profile |
SEC
News |
Chart |
Request a new note
C
A N
S L
I M
|
PANW
-
NYSE
Palo Alto Networks
Computer Sftwr-Security
|
$108.93
|
-0.11
-0.10% |
$111.39
|
1,489,570
77.81% of 50 DAV
50 DAV is 1,914,400
|
$112.11
-2.84%
|
7/30/2014
|
$84.21
|
PP = $85.88
|
|
MB = $90.17
|
Most Recent Note - 11/18/2014 5:36:00 PM
G - Ended today with a 2nd small loss on light volume. Its 50 DMA line ($101.92) defines near-term support to watch. It has not formed a sound base.
>>> FEATURED STOCK ARTICLE : Finished Near Session Low With Small Gain on Light Volume - 11/13/2014
View all notes |
Set NEW NOTE alert |
CANSLIM.net Company Profile |
SEC
News |
Chart |
Request a new note
C
A N
S L
I M
|
Symbol/Exchange
Company Name
Industry Group |
PRICE |
CHANGE
(%Change) |
Day High |
Volume
(% DAV)
(% 50 day avg vol) |
52 Wk Hi
% From Hi |
Featured
Date |
Price
Featured |
Pivot Featured |
|
Max Buy |
SNCR
-
NASDAQ
Synchronoss Technologies
COMPUTER SOFTWARE andamp; SERVICES - Application Software
|
$42.88
|
-0.24
-0.56% |
$44.58
|
791,421
122.13% of 50 DAV
50 DAV is 648,000
|
$54.05
-20.67%
|
10/27/2014
|
$46.40
|
PP = $47.81
|
|
MB = $50.20
|
Most Recent Note - 11/19/2014 6:44:41 PM
G - Gapped down today and violated its 50 DMA line with a damaging volume-driven loss raising concern and triggering a technical sell signal. It may find support near prior lows in the $41 area, but a rebound above the 50 DMA line is needed for its outlook to improve.
>>> FEATURED STOCK ARTICLE : Loss on Heavy Volume a Sign of Distributional Pressure - 11/12/2014
View all notes |
Set NEW NOTE alert |
CANSLIM.net Company Profile |
SEC
News |
Chart |
Request a new note
C
A N
S L
I M
|
STRT
-
NASDAQ
Strattec Security Corp
AUTOMOTIVE - Auto Parts
|
$107.37
|
+1.61
1.52% |
$110.00
|
21,820
83.92% of 50 DAV
50 DAV is 26,000
|
$109.44
-1.89%
|
11/20/2014
|
$105.76
|
PP = $109.54
|
|
MB = $115.02
|
Most Recent Note - 11/20/2014 4:44:18 PM
Y - Color code is changed to yellow after forming an advanced "3-weeks tight" base. Volume-driven gains for new highs may trigger a new (or add-on) technical buy signal. Prior highs coincide with its 50 DMA line defining important near-term support to watch on pullbacks. See the latest FSU analysis for more details and new annotated graphs.
>>> FEATURED STOCK ARTICLE : Formed New Advanced "3-Weeks Tight" Base - 11/20/2014
View all notes |
Set NEW NOTE alert |
CANSLIM.net Company Profile |
SEC
News |
Chart |
Request a new note
C
A N
S L
I M
|
|
|
|
THESE ARE NOT BUY RECOMMENDATIONS!
Comments contained in the body of this report are technical
opinions only. The material herein has been obtained
from sources believed to be reliable and accurate, however,
its accuracy and completeness cannot be guaranteed.
This site is not an investment advisor, hence it does
not endorse or recommend any securities or other investments.
Any recommendation contained in this report may not
be suitable for all investors and it is not to be deemed
an offer or solicitation on our part with respect to
the purchase or sale of any securities. All trademarks,
service marks and trade names appearing in this report
are the property of their respective owners, and are
likewise used for identification purposes only.
This report is a service available
only to active Paid Premium Members.
You may opt-out of receiving report notifications
at any time. Questions or comments may be submitted
by writing to Premium Membership Services 665 S.E. 10 Street, Suite 201 Deerfield Beach, FL 33441-5634 or by calling 1-800-965-8307
or 954-785-1121.
|
|
|

