You are not logged in.
This means you
CAN ONLY VIEW reports that were published prior to Monday, April 14, 2025.
You
MUST UPGRADE YOUR MEMBERSHIP if you want to see any current reports.
AFTER MARKET UPDATE - MONDAY, NOVEMBER 21ST, 2011
Previous After Market Report Next After Market Report >>>
|
|
|
|
DOW |
-248.85 |
11,547.31 |
-2.11% |
|
Volume |
932,354,380 |
-2% |
|
Volume |
2,009,739,670 |
+18% |
|
NASDAQ |
-49.36 |
2,523.14 |
-1.92% |
|
Advancers |
443 |
14% |
|
Advancers |
437 |
16% |
|
S&P 500 |
-22.66 |
1,192.99 |
-1.86% |
|
Decliners |
2,611 |
84% |
|
Decliners |
2,132 |
80% |
|
Russell 2000 |
-17.52 |
701.90 |
-2.44% |
|
52 Wk Highs |
32 |
|
|
52 Wk Highs |
13 |
|
|
S&P 600 |
-9.61 |
390.25 |
-2.40% |
|
52 Wk Lows |
113 |
|
|
52 Wk Lows |
162 |
|
|
 |
Breadth Negative as Major Averages Fall
Kenneth J. Gruneisen - Passed the CAN SLIM® Master's Exam
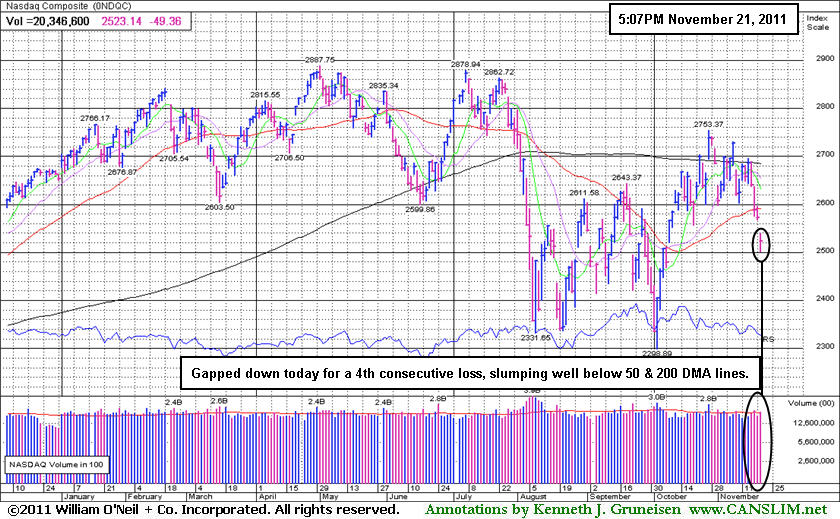
The major averages ended unanimously lower on Monday. The volume totals were reported mixed, lighter than the prior session on the NYSE yet heavier on the Nasdaq exchanges. Decliners led advancers by almost 6-1 on the NYSE and by almost 5-1 on the Nasdaq exchange. New 52-week lows solidly outnumbered new 52-week highs on the Nasdaq exchange and on the NYSE. There was only 1 high-ranked company from the CANSLIM.net Leaders List that made a new 52-week high and appeared on the CANSLIM.net BreakOuts Page, down from the prior session total of 6 stocks. There were gains for only 3 of the 17 high-ranked companies currently included on the Featured Stocks Page.
The persistence of the debt crisis pushed investors to the sidelines. The Super Committee tasked with cutting $1.2 trillion from the US deficit stumbled toward its November 23rd deadline, as leaders on both political sides expressed doubts of a deal. Positive economic data was overlooked. The National Association of Realtors showed existing home sales rose 1.4% in October after a 3.0% loss in the previous month.
Commodity-related stocks led the way lower, hurt by losses in oil and gold prices. Oil fell under $97 a barrel, while gold prices slipped to a three-week low, below $1,700 an ounce. Financial shares also led laggards as shares of Citigroup Inc (C -4.87%) and Bank of America Corp (BAC -5.02%) slumped.
There was only one earnings report of note. Tyson Foods Inc (TSN +0.05%) reported fourth-quarter profit that missed expectations after feed costs increased. Meanwhile, Caterpillar Inc (CAT -2.99%) and Hewlett-Packard Co (HPQ -4.04%) were down ahead of their reports after the bell. European markets finished near session lows. The London FTSE lost -2.62%, while the DAX in Frankfurt dropped -3.35%. The Nikkei in Tokyo gave up -0.23%.
Our monthly newsletter CANSLIM.net News will be published soon with an informative review of current market conditions, leading groups, and best buy candidates. Via the Premium Member Homepage links to all prior reports and webcasts are always available.
PICTURED: The Nasdaq Composite Index gapped down today for a 4th consecutive loss, slumping well below its 50-day and 200-day moving average (DMA) lines.
|
 Kenneth J. Gruneisen started out as a licensed stockbroker in August 1987, a couple of months prior to the historic stock market crash that took the Dow Jones Industrial Average down -22.6% in a single day. He has published daily fact-based fundamental and technical analysis on high-ranked stocks online for two decades. Through FACTBASEDINVESTING.COM, Kenneth provides educational articles, news, market commentary, and other information regarding proven investment systems that work in good times and bad.
Comments contained in the body of this report are technical opinions only and are not necessarily those of Gruneisen Growth Corp. The material herein has been obtained from sources believed to be reliable and accurate, however, its accuracy and completeness cannot be guaranteed. Our firm, employees, and customers may effect transactions, including transactions contrary to any recommendation herein, or have positions in the securities mentioned herein or options with respect thereto. Any recommendation contained in this report may not be suitable for all investors and it is not to be deemed an offer or solicitation on our part with respect to the purchase or sale of any securities. |
|
 |
Financial, Retail, Tech, and Commodity-Linked Groups End Widely Lower
Kenneth J. Gruneisen - Passed the CAN SLIM® Master's Exam
The financial groups including the Bank Index ($BKX -2.99%) and Broker/Dealer Index ($XBD -1.61%) were a negative influence on the major averages, and the Retail Index ($RLX -1.85%) also created a drag on the market. The tech sector saw unanimous losses from the Networking Index ($NWX -3.01%), Internet Index ($IIX -2.46%), Semiconductor Index ($SOX -1.90%), and Biotechnology Index ($BTK -1.28%). The Healthcare Index ($HMO -0.77%) and commodity-linked groups also lost ground as the Gold & Silver Index ($XAU -1.86%), Oil Services Index ($OSX -2.68%), and Integrated Oil Index ($XOI -1.69%) finished lower on Monday's widely negative session.
Charts courtesy www.stockcharts.com
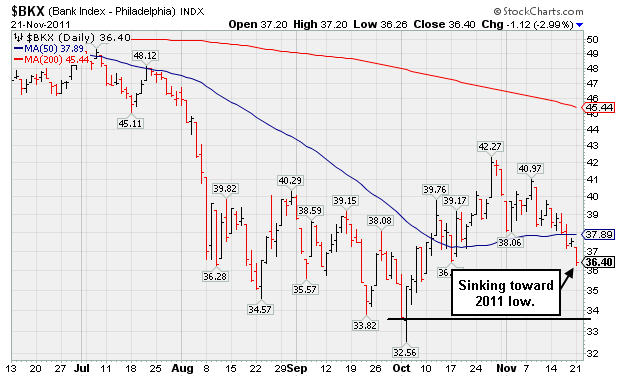
PICTURED 1: The Bank Index ($BKX -2.99%) is sinking toward its 2011 low.
Charts courtesy www.stockcharts.com
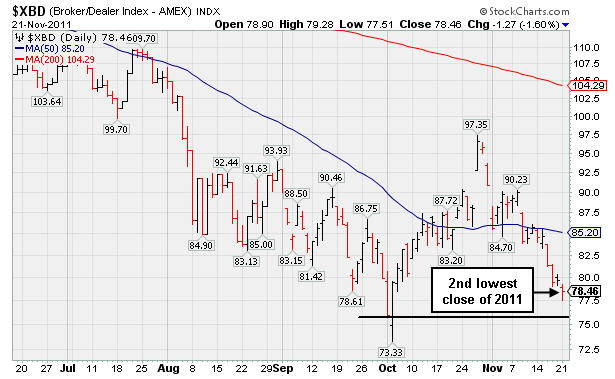
PICTURED 2: The Broker/Dealer Index ($XBD -1.61%) fell to its 2nd lowest close of 2011. Regular readers has seen financial stocks noted often in this commentary as "leading indicators", and the latest slump in these financial indexes obviously bodes poorly for the latest market rally.
| Oil Services |
$OSX |
220.28 |
-6.06 |
-2.68% |
-10.13% |
| Healthcare |
$HMO |
2,177.68 |
-16.97 |
-0.77% |
+28.71% |
| Integrated Oil |
$XOI |
1,168.58 |
-20.12 |
-1.69% |
-3.67% |
| Semiconductor |
$SOX |
364.20 |
-7.05 |
-1.90% |
-11.56% |
| Networking |
$NWX |
223.57 |
-6.94 |
-3.01% |
-20.31% |
| Internet |
$IIX |
278.13 |
-7.02 |
-2.46% |
-9.62% |
| Broker/Dealer |
$XBD |
78.46 |
-1.28 |
-1.61% |
-35.43% |
| Retail |
$RLX |
515.01 |
-9.70 |
-1.85% |
+1.30% |
| Gold & Silver |
$XAU |
192.39 |
-3.65 |
-1.86% |
-15.09% |
| Bank |
$BKX |
36.40 |
-1.12 |
-2.99% |
-30.28% |
| Biotech |
$BTK |
1,021.08 |
-13.20 |
-1.28% |
-21.31% |
|
|
|
 |
Negative Reversal Marked Recent High Yet No Resistance Remains
Kenneth J. Gruneisen - Passed the CAN SLIM® Master's Exam
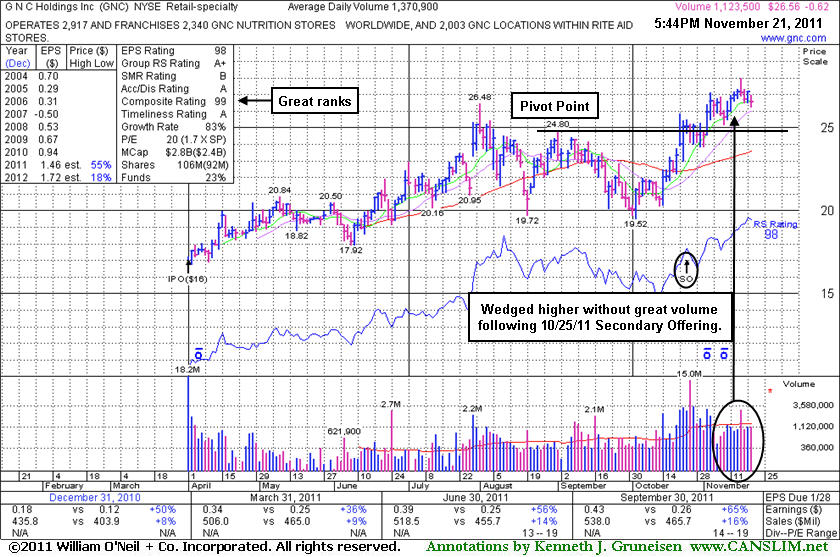
G N C Holdings Inc (GNC -$0.62 or -2.28% to $26.56) lost ground today on near average volume. No resistance remains due to overhead supply so it could produce more climactic gains. There was a negative reversal for a loss on more than 2 times average volume on 11/16/11 after touching a new all-time high. It completed a Secondary Offering on 10/15/11 and it had followed that with some volume driven gains, but more recently it had wedged to new highs without great volume conviction behind its gains.
Recent chart lows (near $23.80) define near term support to watch along with its 50-day moving average (DMA) line. Its last appearance in this FSU section was on 10/26/11 with an annotated graph under the headline, "Secondary Offering Priced While High-Ranked Leader Near High." It was perched near its 52-week high within striking distance of new highs (N criteria), holding its ground after volume-driven gains helped it rally from a "double bottom" base pattern formed over the prior 3 months. Its pivot point was based on its 9/01/11 high. The 10/24/11 gain with more than 4 times average volume had triggered a technical buy signal.
New institutional owners are often attracted when a company has the help of underwriters in placing shares during offerings. The number of top-rated funds owning its shares rose from 147 in June to 181 in September '11, a reassuring sign concerning the I criteria. The Retail - Specialty industry group has a Relative Strength Rating of 95, which is good news concerning the L criteria. Its strong quarterly earnings increases with accelerating sales growth and a great annual earnings history satisfies the C and A criteria and helped it earn stellar ranks.
|
|
|
Color Codes Explained :
Y - Better candidates highlighted by our
staff of experts.
G - Previously featured
in past reports as yellow but may no longer be buyable under the
guidelines.
***Last / Change / Volume data in this table is the closing quote data***
Symbol/Exchange
Company Name
Industry Group |
PRICE |
CHANGE
(%Change) |
Day High |
Volume
(% DAV)
(% 50 day avg vol) |
52 Wk Hi
% From Hi |
Featured
Date |
Price
Featured |
Pivot Featured |
|
Max Buy |
ADS
-
NYSE
Alliance Data Sys Corp
COMPUTER SOFTWARE and SERVICES - Information and Delivery Service
|
$95.38
|
-0.45
-0.47% |
$95.67
|
762,411
80.26% of 50 DAV
50 DAV is 949,900
|
$107.18
-11.01%
|
10/21/2011
|
$97.94
|
PP = $101.15
|
|
MB = $106.21
|
Most Recent Note - 11/18/2011 6:01:31 PM
G - Down today on near average volume for its 5th consecutive loss leading to deterioration deeper into its prior base. Violated support at its 50 DMA line raising concerns and its color code is changed to green.
>>> The latest Featured Stock Update with an annotated graph appeared on 11/17/2011. Click here.
View all notes |
Alert me of new notes |
CANSLIM.net Company Profile |
SEC |
Zacks Reports |
StockTalk |
News |
Chart |
Request a new note
C
A N
S L
I M


|
ALXN
-
NASDAQ
Alexion Pharmaceuticals
DRUGS - Drug Manufacturers - Other
|
$64.41
|
+0.29
0.45% |
$64.74
|
1,179,572
77.54% of 50 DAV
50 DAV is 1,521,300
|
$70.42
-8.53%
|
9/15/2011
|
$63.20
|
PP = $60.81
|
|
MB = $63.85
|
Most Recent Note - 11/17/2011 6:11:14 PM
Y - Loss today on lighter volume, slumping to a close just below its 50 DMA line. Deterioration below recent chart lows ($67.72 on 11/10/11) would raise concerns and trigger technical sell signals. See latest FSU analysis for more details and a new annotated daily graph.
>>> The latest Featured Stock Update with an annotated graph appeared on 11/14/2011. Click here.
View all notes |
Alert me of new notes |
CANSLIM.net Company Profile |
SEC |
Zacks Reports |
StockTalk |
News |
Chart |
Request a new note
C
A N
S L
I M
|
CATM
-
NASDAQ
Cardtronics Inc
DIVERSIFIED SERVICES - Business/Management Services
|
$24.42
|
-1.30
-5.05% |
$25.18
|
256,753
60.89% of 50 DAV
50 DAV is 421,700
|
$28.46
-14.20%
|
11/8/2011
|
$25.99
|
PP = $25.95
|
|
MB = $27.25
|
 Most Recent Note - 11/21/2011 1:44:01 PM
Y - Small gap down today for a 4th consecutive loss, slumping under prior highs in the $26 area and raising concerns while testing important support at its 50 DMA line. A violation of its short-term average would raise greater concerns and trigger a technical sell signal.
>>> The latest Featured Stock Update with an annotated graph appeared on 11/8/2011. Click here.
View all notes |
Alert me of new notes |
CANSLIM.net Company Profile |
SEC |
Zacks Reports |
StockTalk |
News |
Chart |
Request a new note
C
A N
S L
I M
|
CELG
-
NASDAQ
Celgene Corp
DRUGS - Drug Manufacturers - Major
|
$61.32
|
-1.72
-2.73% |
$62.52
|
4,826,323
125.63% of 50 DAV
50 DAV is 3,841,700
|
$68.25
-10.15%
|
9/16/2011
|
$61.21
|
PP = $62.59
|
|
MB = $65.72
|
Most Recent Note - 11/21/2011 1:46:58 PM
G -Gapped down today for a damaging loss following last week's violation of its 50 DMA line. Color code is changed to green while the slump below its previously noted chart low ($62.71 on 11/01/11) raises greater concerns and triggers a worrisome technical sell signal.
>>> The latest Featured Stock Update with an annotated graph appeared on 11/7/2011. Click here.
View all notes |
Alert me of new notes |
CANSLIM.net Company Profile |
SEC |
Zacks Reports |
StockTalk |
News |
Chart |
Request a new note
C
A N
S L
I M
|
CEVA
-
NASDAQ
Ceva Inc
ELECTRONICS - Semiconductor - Specialized
|
$28.88
|
-1.64
-5.37% |
$30.19
|
289,817
122.65% of 50 DAV
50 DAV is 236,300
|
$35.60
-18.88%
|
10/28/2011
|
$34.38
|
PP = $35.70
|
|
MB = $37.49
|
Most Recent Note - 11/21/2011 1:53:16 PM
G - Color code is changed to green while it has slumped today to its lowest level since its impressive 10/27/11 volume-driven gap up gain. Subsequent gains above recent highs are needed for its outlook to improve. Disciplined investors may note that a breakout above the pivot point cited did not trigger a new (or add-on) technical buy signal since it was featured on 10/28/11.
>>> The latest Featured Stock Update with an annotated graph appeared on 11/2/2011. Click here.
View all notes |
Alert me of new notes |
CANSLIM.net Company Profile |
SEC |
Zacks Reports |
StockTalk |
News |
Chart |
Request a new note
C
A N
S L
I M
|
Symbol/Exchange
Company Name
Industry Group |
PRICE |
CHANGE
(%Change) |
Day High |
Volume
(% DAV)
(% 50 day avg vol) |
52 Wk Hi
% From Hi |
Featured
Date |
Price
Featured |
Pivot Featured |
|
Max Buy |
FEIC
-
NASDAQ
F E I Co
ELECTRONICS - Diversified Electronics
|
$37.27
|
-0.67
-1.77% |
$37.57
|
299,592
68.57% of 50 DAV
50 DAV is 436,900
|
$42.25
-11.79%
|
10/28/2011
|
$40.31
|
PP = $40.88
|
|
MB = $42.92
|
Most Recent Note - 11/17/2011 6:17:13 PM
Y - Pulled back today on lighter volume and slumped further below its pivot point, finishing -8.6% off its 52-week high. Disciplined investors limit losses if a stock falls more than -7% from their purchase price.
>>> The latest Featured Stock Update with an annotated graph appeared on 10/28/2011. Click here.
View all notes |
Alert me of new notes |
CANSLIM.net Company Profile |
SEC |
Zacks Reports |
StockTalk |
News |
Chart |
Request a new note
C
A N
S L
I M
|
GNC
-
NYSE
G N C Holdings Inc
RETAIL - Drug Stores
|
$26.56
|
-0.62
-2.28% |
$26.99
|
1,123,591
87.49% of 50 DAV
50 DAV is 1,284,300
|
$27.99
-5.11%
|
10/26/2011
|
$24.60
|
PP = $24.80
|
|
MB = $26.04
|
Most Recent Note - 11/21/2011 6:08:56 PM
G - Small gap down for a loss today on below average volume. There was a negative reversal for a loss on more than 2 times average volume on 11/16/11 after touching a new all-time high. See the latest FSU analysis for more details and a new annotated graph.
>>> The latest Featured Stock Update with an annotated graph appeared on 11/21/2011. Click here.
View all notes |
Alert me of new notes |
CANSLIM.net Company Profile |
SEC |
Zacks Reports |
StockTalk |
News |
Chart |
Request a new note
C
A N
S L
I M
|
HMSY
-
NASDAQ
H M S Holdings Corp
COMPUTER SOFTWARE and SERVICES - Healthcare Information Service
|
$28.50
|
-0.25
-0.87% |
$28.68
|
556,707
82.04% of 50 DAV
50 DAV is 678,600
|
$31.99
-10.91%
|
10/27/2011
|
$26.44
|
PP = $28.37
|
|
MB = $29.79
|
Most Recent Note - 11/21/2011 6:09:46 PM
G - Today was its 6th consecutive small loss on near average volume following a negative reversal on 11/14/11 after hitting a new all-time high. Prior highs in the $27-28 area define support to watch on pullbacks.
>>> The latest Featured Stock Update with an annotated graph appeared on 11/4/2011. Click here.
View all notes |
Alert me of new notes |
CANSLIM.net Company Profile |
SEC |
Zacks Reports |
StockTalk |
News |
Chart |
Request a new note
C
A N
S L
I M
|
ISRG
-
NASDAQ
Intuitive Surgical Inc
HEALTH SERVICES - Medical Appliances and Equipment
|
$420.82
|
-2.24
-0.53% |
$423.31
|
309,326
74.95% of 50 DAV
50 DAV is 412,700
|
$449.06
-6.29%
|
10/19/2011
|
$424.69
|
PP = $415.29
|
|
MB = $436.05
|
Most Recent Note - 11/17/2011 6:23:42 PM
G - Today's 2nd consecutive loss came with near average volume following 4 consecutive gains on lighter than average volume. Volume totals have been cooling in recent weeks while holding its ground and rising. See the latest FSU analysis for more details and a new annotated weekly graph.
>>> The latest Featured Stock Update with an annotated graph appeared on 11/15/2011. Click here.
View all notes |
Alert me of new notes |
CANSLIM.net Company Profile |
SEC |
Zacks Reports |
StockTalk |
News |
Chart |
Request a new note
C
A N
S L
I M
|
MG
-
NYSE
Mistras Group Inc
DIVERSIFIED SERVICES - Bulding and Faci;ity Management Services
|
$21.25
|
-0.68
-3.10% |
$21.63
|
74,091
35.78% of 50 DAV
50 DAV is 207,100
|
$23.51
-9.61%
|
10/28/2011
|
$22.49
|
PP = $23.61
|
|
MB = $24.79
|
Most Recent Note - 11/21/2011 6:04:27 PM
Y - Down today for a 4th consecutive small loss on below average volume. It has slumped near its 50 DMA line and prior highs defining important chart support to watch near $21.
>>> The latest Featured Stock Update with an annotated graph appeared on 11/11/2011. Click here.
View all notes |
Alert me of new notes |
CANSLIM.net Company Profile |
SEC |
Zacks Reports |
StockTalk |
News |
Chart |
Request a new note
C
A N
S L
I M
|
Symbol/Exchange
Company Name
Industry Group |
PRICE |
CHANGE
(%Change) |
Day High |
Volume
(% DAV)
(% 50 day avg vol) |
52 Wk Hi
% From Hi |
Featured
Date |
Price
Featured |
Pivot Featured |
|
Max Buy |
MKTX
-
NASDAQ
Marketaxess Holdings Inc
FINANCIAL SERVICES - Investment Brokerage - Nationa
|
$26.91
|
-0.61
-2.22% |
$27.62
|
84,502
34.90% of 50 DAV
50 DAV is 242,100
|
$31.45
-14.44%
|
10/28/2011
|
$29.79
|
PP = $31.05
|
|
MB = $32.60
|
Most Recent Note - 11/21/2011 6:05:49 PM
G - Today's loss was on light volume as it slumped further below its 50 DMA line which is now downward sloping. Prior lows and its 200 DMA line in the $24-25 area define the next support area to watch.
>>> The latest Featured Stock Update with an annotated graph appeared on 10/31/2011. Click here.
View all notes |
Alert me of new notes |
CANSLIM.net Company Profile |
SEC |
Zacks Reports |
StockTalk |
News |
Chart |
Request a new note
C
A N
S L
I M
|
OSIS
-
NASDAQ
O S I Systems Inc
ELECTRONICS - Semiconductor Equipment and Mate
|
$43.68
|
-1.15
-2.57% |
$45.44
|
93,368
62.92% of 50 DAV
50 DAV is 148,400
|
$47.39
-7.83%
|
11/1/2011
|
$42.07
|
PP = $45.57
|
|
MB = $47.85
|
Most Recent Note - 11/21/2011 6:06:59 PM
Y - Gapped down today and slumped further below its pivot point with a loss on light volume. Previously noted - "Lighter than average behind last week's gains, not indicative of great institutional (I criteria) buying demand. Volume-driven gains above its pivot point may trigger a technical buy signal."
>>> The latest Featured Stock Update with an annotated graph appeared on 11/1/2011. Click here.
View all notes |
Alert me of new notes |
CANSLIM.net Company Profile |
SEC |
Zacks Reports |
StockTalk |
News |
Chart |
Request a new note
C
A N
S L
I M
|
RAX
-
NYSE
Rackspace Hosting Inc
INTERNET - Internet Software and; Services
|
$39.56
|
-1.50
-3.65% |
$42.00
|
2,014,004
126.62% of 50 DAV
50 DAV is 1,590,600
|
$46.50
-14.92%
|
11/8/2011
|
$44.28
|
PP = $46.27
|
|
MB = $48.58
|
Most Recent Note - 11/21/2011 1:59:01 PM
G - It is -15.3% off its 52-week high today after a small gap down that has it testing near important support at its 50 and 200 DMA lines. Color code is changed to green while slumping well below the pivot point previously cited.
>>> The latest Featured Stock Update with an annotated graph appeared on 11/10/2011. Click here.
View all notes |
Alert me of new notes |
CANSLIM.net Company Profile |
SEC |
Zacks Reports |
StockTalk |
News |
Chart |
Request a new note
C
A N
S L
I M
|
SWI
-
NYSE
Solarwinds Inc
COMPUTER SOFTWARE and SERVICES - Application Software
|
$31.14
|
+1.21
4.04% |
$31.13
|
2,650,966
226.15% of 50 DAV
50 DAV is 1,172,200
|
$31.69
-1.74%
|
10/27/2011
|
$27.78
|
PP = $25.62
|
|
MB = $26.90
|
Most Recent Note - 11/21/2011 1:19:55 PM
G - Managed a positive reversal after a small gap down today, and it is now perched only -2.4% off its all-time high. It is extended from its previous base pattern. Prior highs in the $25-26 area define initial chart support to watch on pullbacks.
>>> The latest Featured Stock Update with an annotated graph appeared on 10/27/2011. Click here.
View all notes |
Alert me of new notes |
CANSLIM.net Company Profile |
SEC |
Zacks Reports |
StockTalk |
News |
Chart |
Request a new note
C
A N
S L
I M
|
TDG
-
NYSE
Transdigm Group Inc
AEROSPACE/DEFENSE - Aerospace/Defense Products and; Services
|
$92.44
|
-1.97
-2.09% |
$95.15
|
392,923
95.14% of 50 DAV
50 DAV is 413,000
|
$102.73
-10.02%
|
11/9/2011
|
$98.45
|
PP = $95.14
|
|
MB = $99.90
|
Most Recent Note - 11/18/2011 5:48:01 PM
Y - Held its ground today following a negative reversal on the prior session after hitting a new 52-week high. A volume-driven gain on 11/08/11 helped it break out from a 19-week base. Reported earnings +42% on +54% sales revenues for the quarter ended September 30, 2011.
>>> The latest Featured Stock Update with an annotated graph appeared on 11/9/2011. Click here.
View all notes |
Alert me of new notes |
CANSLIM.net Company Profile |
SEC |
Zacks Reports |
StockTalk |
News |
Chart |
Request a new note
C
A N
S L
I M
|
Symbol/Exchange
Company Name
Industry Group |
PRICE |
CHANGE
(%Change) |
Day High |
Volume
(% DAV)
(% 50 day avg vol) |
52 Wk Hi
% From Hi |
Featured
Date |
Price
Featured |
Pivot Featured |
|
Max Buy |
UA
-
NYSE
Under Armour Inc Cl A
CONSUMER NON-DURABLES - Textile - Apparel Clothing
|
$75.69
|
-1.20
-1.56% |
$79.39
|
1,217,914
91.68% of 50 DAV
50 DAV is 1,328,400
|
$87.40
-13.40%
|
10/25/2011
|
$82.43
|
PP = $80.80
|
|
MB = $84.84
|
Most Recent Note - 11/18/2011 5:50:09 PM
Y - Volume was lighter than average today as it sank further below prior highs near $80 previously noted as initial support, technically negating its recent breakout and raising concerns. It is currently testing important chart support at its 50 DMA line.
>>> The latest Featured Stock Update with an annotated graph appeared on 11/3/2011. Click here.
View all notes |
Alert me of new notes |
CANSLIM.net Company Profile |
SEC |
Zacks Reports |
StockTalk |
News |
Chart |
Request a new note
C
A N
S L
I M
|
V
-
NYSE
Visa Inc Cl A
DIVERSIFIED SERVICES - Business/Management Services
|
$91.21
|
+0.40
0.44% |
$91.65
|
3,961,043
74.66% of 50 DAV
50 DAV is 5,305,100
|
$95.87
-4.86%
|
10/24/2011
|
$94.21
|
PP = $94.85
|
|
MB = $99.59
|
Most Recent Note - 11/18/2011 5:51:25 PM
Y - Down today on lighter volume finishing near its 50 DMA line previously noted as near-term chart support to watch. A violation of that important short-term average line would trigger more worrisome technical sell signals.
>>> The latest Featured Stock Update with an annotated graph appeared on 11/18/2011. Click here.
View all notes |
Alert me of new notes |
CANSLIM.net Company Profile |
SEC |
Zacks Reports |
StockTalk |
News |
Chart |
Request a new note
C
A N
S L
I M
|
|
|
|
THESE ARE NOT BUY RECOMMENDATIONS!
Comments contained in the body of this report are technical
opinions only. The material herein has been obtained
from sources believed to be reliable and accurate, however,
its accuracy and completeness cannot be guaranteed.
This site is not an investment advisor, hence it does
not endorse or recommend any securities or other investments.
Any recommendation contained in this report may not
be suitable for all investors and it is not to be deemed
an offer or solicitation on our part with respect to
the purchase or sale of any securities. All trademarks,
service marks and trade names appearing in this report
are the property of their respective owners, and are
likewise used for identification purposes only.
This report is a service available
only to active Paid Premium Members.
You may opt-out of receiving report notifications
at any time. Questions or comments may be submitted
by writing to Premium Membership Services 665 S.E. 10 Street, Suite 201 Deerfield Beach, FL 33441-5634 or by calling 1-800-965-8307
or 954-785-1121.
|
|
|

