You are not logged in.
This means you
CAN ONLY VIEW reports that were published prior to Tuesday, April 15, 2025.
You
MUST UPGRADE YOUR MEMBERSHIP if you want to see any current reports.
AFTER MARKET UPDATE - FRIDAY, NOVEMBER 18TH, 2011
Previous After Market Report Next After Market Report >>>
|
|
|
|
DOW |
+25.43 |
11,796.16 |
+0.22% |
|
Volume |
955,696,000 |
-7% |
|
Volume |
1,702,203,930 |
-21% |
|
NASDAQ |
-15.49 |
2,572.50 |
-0.60% |
|
Advancers |
1,678 |
54% |
|
Advancers |
1,243 |
47% |
|
S&P 500 |
-0.48 |
1,215.65 |
-0.04% |
|
Decliners |
1,304 |
42% |
|
Decliners |
1,266 |
48% |
|
Russell 2000 |
+0.68 |
719.42 |
+0.09% |
|
52 Wk Highs |
26 |
|
|
52 Wk Highs |
14 |
|
|
S&P 600 |
+1.23 |
399.86 |
+0.31% |
|
52 Wk Lows |
43 |
|
|
52 Wk Lows |
88 |
|
|
 |
Mixed Finish for Indices as Volume Totals Cooled
Kenneth J. Gruneisen - Passed the CAN SLIM® Master's Exam
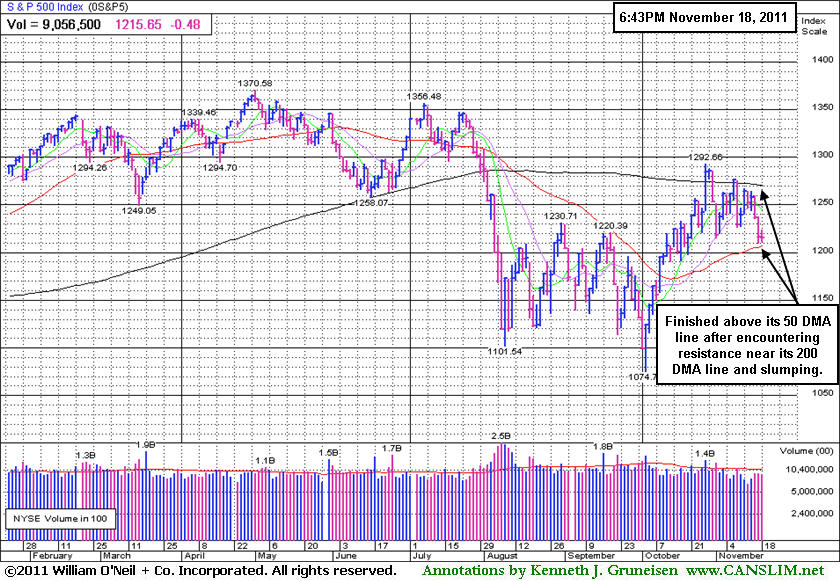
For the week, the Dow was down -2.94%, the S&P lost -3.81%, and the Nasdaq fell -3.97%. On Friday stocks swung between gains and losses and the major averages ended mixed. Friday's volume totals were reported lighter on both major exchanges. Advancers beat decliners by 4-3 on the NYSE. On the Nasdaq exchange, advancers closely matched decliners. New 52-week lows outnumbered new 52-week highs on the Nasdaq exchange and on the NYSE. There were only 6 high-ranked companies from the CANSLIM.net Leaders List that made new 52-week highs and appeared on the CANSLIM.net BreakOuts Page, up from the prior session total of 4 stocks. There were gains for only 5 of the 18 high-ranked companies currently included on the Featured Stocks Page.
Investors pointed to positive developments out of Europe. The notion that the ECB may lend money to the IMF to finance bailouts gained traction and ECB President Draghi called for swift implementation of measures to combat the region's debt crisis. European markets finished off of their session lows. The London FTSE lost -0.27%, while the DAX in Frankfurt declined -0.85%. The Nikkei in Tokyo dropped -1.23%.
An optimistic read on economic activity added to upside. The leading indicators index for October rose for a sixth straight time, up 0.90%, its biggest jump since February. Still, investors remained on edge over the lack of progress in the Super Committee's deficit reduction talks. The committee has until November 23rd to reach a deal.
Most sectors were in positive territory, led by materials and energy, but techs slid. In earnings, H.J. Heinz's (HNZ -3.31%) quarterly profit beat expectations, but shares fell after failing to raise its full-year forecast. Marvell Technology Group Ltd (MRVL +6.47%) rallied after its earnings and revenue declined from a year earlier, but still beat expectations. Salesforce.com Inc (CRM -10.04%) retreated after delivering a tepid outlook and a quarterly loss. The Gap Inc (GPS -2.55%) third-quarter 2011 earnings of 38 cents per share declined -20.8% from the prior-period earnings of 48 cents per share. However, quarterly earnings managed to beat the Zacks Consensus Estimate by a penny.
Declines in tech and energy shares overshadowed economic confidence. Crude oil retreated for a second day. Schlumberger Ltd (SLB -0.54%) and Halliburton Co (HAL -2.92%) fell. Apple Inc (AAPL -0.65%) inched lower as concern grew that it may face $2.7 billion loss in sales if it loses a patent-infringement case. Clearwire Corp (CLWR -20.97%) fell as much as -31% after saying it is evaluating whether to make a debt payment.
Our monthly newsletter CANSLIM.net News will be published soon with an informative review of current market conditions, leading groups, and best buy candidates. Via the Premium Member Homepage links to all prior reports and webcasts are always available.
PICTURED: The S&P 500 Index finished above its 50-day moving average (DMA) line after encountering resistance near its 200 DMA line and slumping. Year-to-date, the benchmark S&P 500 Index is negative by -3.34% and the Nasdaq Composite Index is down -3.03%, meanwhile the Dow is up +1.89%.
|
 Kenneth J. Gruneisen started out as a licensed stockbroker in August 1987, a couple of months prior to the historic stock market crash that took the Dow Jones Industrial Average down -22.6% in a single day. He has published daily fact-based fundamental and technical analysis on high-ranked stocks online for two decades. Through FACTBASEDINVESTING.COM, Kenneth provides educational articles, news, market commentary, and other information regarding proven investment systems that work in good times and bad.
Comments contained in the body of this report are technical opinions only and are not necessarily those of Gruneisen Growth Corp. The material herein has been obtained from sources believed to be reliable and accurate, however, its accuracy and completeness cannot be guaranteed. Our firm, employees, and customers may effect transactions, including transactions contrary to any recommendation herein, or have positions in the securities mentioned herein or options with respect thereto. Any recommendation contained in this report may not be suitable for all investors and it is not to be deemed an offer or solicitation on our part with respect to the purchase or sale of any securities. |
|
 |
Tech and Retail Indices Fell; Financials Posted Modest Gains
Kenneth J. Gruneisen - Passed the CAN SLIM® Master's Exam
The Healthcare Index ($HMO +0.28%) posted a small gain and the Broker/Dealer Index ($XBD +0.30%) and Bank Index ($BKX +0.59%) also posted modest gains that helped offset other weakness on Friday. The Biotechnology Index ($BTK -1.24%), Semiconductor Index ($SOX -0.83%), Internet Index ($IIX -0.71%), and Networking Index ($NWX -0.59%) ended unanimously lower while a weaker tech sector weighed the tech-heavy Nasdaq Composite Index into the red. Commodity-linked groups were lower as the Gold & Silver Index ($XAU -0.88%), Oil Services Index ($OSX -0.87%), and Integrated Oil Index ($XOI -0.31%) also lost ground.
Charts courtesy www.stockcharts.com
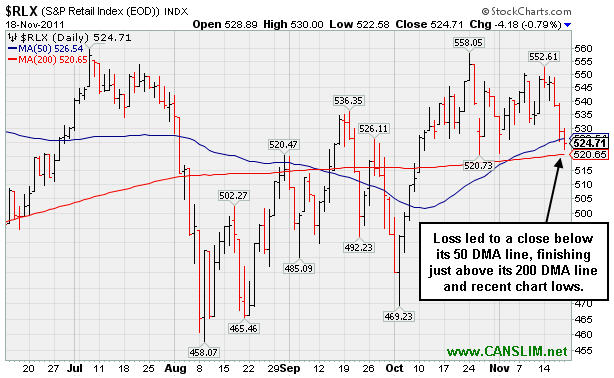
PICTURED: A loss for the Retail Index ($RLX -0.79%) also was a negative influence on the major averages on Friday. It closed below its 50-day moving average (DMA) line and just above its 200 DMA line and recent chart lows.
| Oil Services |
$OSX |
226.34 |
-1.99 |
-0.87% |
-7.66% |
| Healthcare |
$HMO |
2,194.66 |
+6.07 |
+0.28% |
+29.71% |
| Integrated Oil |
$XOI |
1,188.70 |
-3.70 |
-0.31% |
-2.02% |
| Semiconductor |
$SOX |
371.25 |
-3.10 |
-0.83% |
-9.85% |
| Networking |
$NWX |
230.51 |
-1.38 |
-0.59% |
-17.84% |
| Internet |
$IIX |
285.15 |
-2.03 |
-0.71% |
-7.34% |
| Broker/Dealer |
$XBD |
79.74 |
+0.24 |
+0.30% |
-34.38% |
| Retail |
$RLX |
524.71 |
-4.18 |
-0.79% |
+3.21% |
| Gold & Silver |
$XAU |
196.04 |
-1.75 |
-0.88% |
-13.48% |
| Bank |
$BKX |
37.52 |
+0.22 |
+0.59% |
-28.14% |
| Biotech |
$BTK |
1,034.28 |
-12.96 |
-1.24% |
-20.29% |
|
|
|
 |
Fall Leads to Testing Support Near 50-Day Moving Average
Kenneth J. Gruneisen - Passed the CAN SLIM® Master's Exam
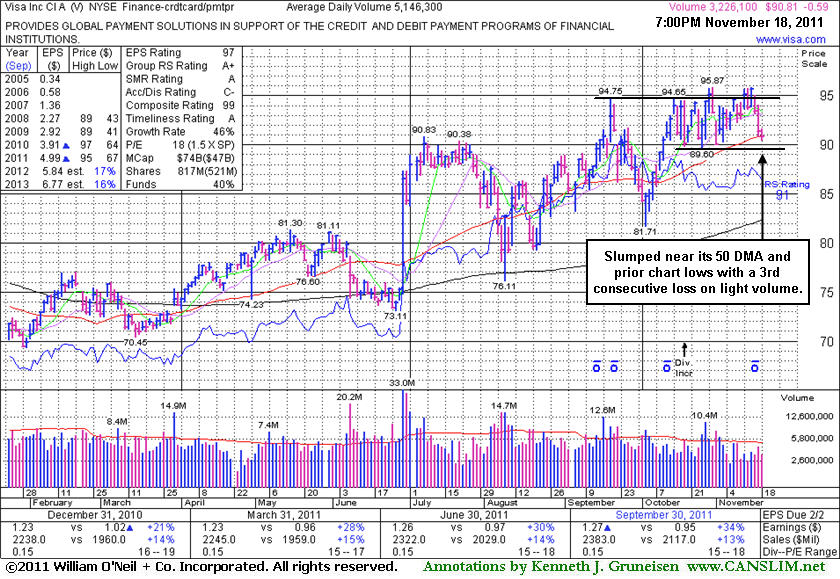
Visa Inc (V -$0.57 or -0.62% to $90.83) has slumped near its 50-day moving average (DMA) line (now $90.71) previously noted as near-term chart support to watch. A violation of that important short-term average line may trigger more worrisome technical sell signals. Prior lows just below that important short-term average are another important nearby chart support level to keep an eye on. Its last appearance in this FSU section was on 10/24/11 with an annotated weekly graph under the headline, "New Pivot Point Cited After Healthy Consolidation." A convincing breakout did not subsequently trigger a new technical buy signal. It has encountered resistance near prior highs.
Its quarterly and annual earnings history has been strong enough to satisfy the C and A criteria. The number of top-rated funds owning its shares rose from 1,642 in Dec '10 to 1,923 in Sep '11, a reassuring sign concerning the I criteria, however it is already well known by the institutional crowd. Leadership shown by at least one other well-known firm in the Finance - Credit Card Payment Processing firm (L criteria) has been a reassuring sign.
Keep in mind that the M criteria tells us that typically 3 out of 4 stocks move in the same direction of the major averages, and not a lot of examples worked out well in recent weeks while the broader market struggled. In a bullish market environment there is no shortage of action-worthy buy candidates, and many of the companies may form multiple sound base patterns throughout an ongoing advance. Disciplined investors always limit losses by selling if ever any stock falls -7% from their purchase price. Otherwise, if leaving the risk un-contained, the damage can become more severe and undisciplined investors must be prepared to suffer the painful consequences.
|
|
|
Color Codes Explained :
Y - Better candidates highlighted by our
staff of experts.
G - Previously featured
in past reports as yellow but may no longer be buyable under the
guidelines.
***Last / Change / Volume data in this table is the closing quote data***
Symbol/Exchange
Company Name
Industry Group |
PRICE |
CHANGE
(%Change) |
Day High |
Volume
(% DAV)
(% 50 day avg vol) |
52 Wk Hi
% From Hi |
Featured
Date |
Price
Featured |
Pivot Featured |
|
Max Buy |
AAPL
-
NASDAQ
Apple Inc
COMPUTER HARDWARE - Personal Computers
|
$374.94
|
-2.47
-0.65% |
$379.99
|
13,285,613
65.33% of 50 DAV
50 DAV is 20,337,600
|
$426.70
-12.13%
|
9/16/2011
|
$399.14
|
PP = $404.60
|
|
MB = $424.83
|
 Most Recent Note - 11/18/2011 5:58:40 PM
Quietly slumped to a close -12.1% off its 52-week high today. Gains above its 50 DMA line are needed to help its outlook improve. It will be dropped from the Featured Stocks list tonight. In recent weeks lacked volume conviction while it has endured distributional pressure. Its 200 DMA line defines the next important chart support to watch.
>>> The latest Featured Stock Update with an annotated graph appeared on 11/16/2011. Click here.
View all notes |
Alert me of new notes |
CANSLIM.net Company Profile |
SEC |
Zacks Reports |
StockTalk |
News |
Chart |
Request a new note
C
A N
S L
I M


|
ADS
-
NYSE
Alliance Data Sys Corp
COMPUTER SOFTWARE and SERVICES - Information and Delivery Service
|
$95.83
|
-0.79
-0.82% |
$97.02
|
977,572
102.91% of 50 DAV
50 DAV is 949,900
|
$107.18
-10.59%
|
10/21/2011
|
$97.94
|
PP = $101.15
|
|
MB = $106.21
|
Most Recent Note - 11/18/2011 6:01:31 PM
G - Down today on near average volume for its 5th consecutive loss leading to deterioration deeper into its prior base. Violated support at its 50 DMA line raising concerns and its color code is changed to green.
>>> The latest Featured Stock Update with an annotated graph appeared on 11/17/2011. Click here.
View all notes |
Alert me of new notes |
CANSLIM.net Company Profile |
SEC |
Zacks Reports |
StockTalk |
News |
Chart |
Request a new note
C
A N
S L
I M
|
ALXN
-
NASDAQ
Alexion Pharmaceuticals
DRUGS - Drug Manufacturers - Other
|
$64.12
|
-0.57
-0.88% |
$65.12
|
1,046,890
68.82% of 50 DAV
50 DAV is 1,521,300
|
$70.42
-8.95%
|
9/15/2011
|
$63.20
|
PP = $60.81
|
|
MB = $63.85
|
Most Recent Note - 11/17/2011 6:11:14 PM
Y - Loss today on lighter volume, slumping to a close just below its 50 DMA line. Deterioration below recent chart lows ($67.72 on 11/10/11) would raise concerns and trigger technical sell signals. See latest FSU analysis for more details and a new annotated daily graph.
>>> The latest Featured Stock Update with an annotated graph appeared on 11/14/2011. Click here.
View all notes |
Alert me of new notes |
CANSLIM.net Company Profile |
SEC |
Zacks Reports |
StockTalk |
News |
Chart |
Request a new note
C
A N
S L
I M
|
CATM
-
NASDAQ
Cardtronics Inc
DIVERSIFIED SERVICES - Business/Management Services
|
$25.72
|
-0.20
-0.77% |
$26.16
|
160,474
38.05% of 50 DAV
50 DAV is 421,700
|
$28.46
-9.63%
|
11/8/2011
|
$25.99
|
PP = $25.95
|
|
MB = $27.25
|
Most Recent Note - 11/17/2011 6:12:23 PM
Y - Small loss today on light volume. Volume totals have been cooling while consolidating above prior highs in the $26 area which acted as support following its 11/08/11 breakout.
>>> The latest Featured Stock Update with an annotated graph appeared on 11/8/2011. Click here.
View all notes |
Alert me of new notes |
CANSLIM.net Company Profile |
SEC |
Zacks Reports |
StockTalk |
News |
Chart |
Request a new note
C
A N
S L
I M
|
CELG
-
NASDAQ
Celgene Corp
DRUGS - Drug Manufacturers - Major
|
$63.04
|
-1.62
-2.51% |
$64.52
|
3,494,009
90.95% of 50 DAV
50 DAV is 3,841,700
|
$68.25
-7.63%
|
9/16/2011
|
$61.21
|
PP = $62.59
|
|
MB = $65.72
|
Most Recent Note - 11/18/2011 5:55:56 PM
Y -Today's 3rd consecutive loss led to a violation of its 50 DMA line raising concerns. A damaging violation of its recent chart low ($62.71 on 11/01/11) would raise greater concerns and trigger a worrisome technical sell signals.
>>> The latest Featured Stock Update with an annotated graph appeared on 11/7/2011. Click here.
View all notes |
Alert me of new notes |
CANSLIM.net Company Profile |
SEC |
Zacks Reports |
StockTalk |
News |
Chart |
Request a new note
C
A N
S L
I M
|
Symbol/Exchange
Company Name
Industry Group |
PRICE |
CHANGE
(%Change) |
Day High |
Volume
(% DAV)
(% 50 day avg vol) |
52 Wk Hi
% From Hi |
Featured
Date |
Price
Featured |
Pivot Featured |
|
Max Buy |
CEVA
-
NASDAQ
Ceva Inc
ELECTRONICS - Semiconductor - Specialized
|
$30.52
|
+0.01
0.03% |
$31.01
|
217,530
92.06% of 50 DAV
50 DAV is 236,300
|
$35.60
-14.27%
|
10/28/2011
|
$34.38
|
PP = $35.70
|
|
MB = $37.49
|
Most Recent Note - 11/17/2011 6:15:40 PM
Y - Still consolidating above prior highs since its gap up on 10/27/11 helped it break out of a "double bottom" base pattern. In the 10/28/11 mid-day report (read here) it was featured again in yellow with pivot point based on its 52-week high plus 10 cents while rallying from a larger cup shaped base. It has encountered distributional pressure since, while volume-driven gains above its pivot point are needed to trigger a new (or add-on) technical buy signal.
>>> The latest Featured Stock Update with an annotated graph appeared on 11/2/2011. Click here.
View all notes |
Alert me of new notes |
CANSLIM.net Company Profile |
SEC |
Zacks Reports |
StockTalk |
News |
Chart |
Request a new note
C
A N
S L
I M
|
FEIC
-
NASDAQ
F E I Co
ELECTRONICS - Diversified Electronics
|
$37.94
|
-0.66
-1.71% |
$39.31
|
297,638
68.12% of 50 DAV
50 DAV is 436,900
|
$42.25
-10.20%
|
10/28/2011
|
$40.31
|
PP = $40.88
|
|
MB = $42.92
|
Most Recent Note - 11/17/2011 6:17:13 PM
Y - Pulled back today on lighter volume and slumped further below its pivot point, finishing -8.6% off its 52-week high. Disciplined investors limit losses if a stock falls more than -7% from their purchase price.
>>> The latest Featured Stock Update with an annotated graph appeared on 10/28/2011. Click here.
View all notes |
Alert me of new notes |
CANSLIM.net Company Profile |
SEC |
Zacks Reports |
StockTalk |
News |
Chart |
Request a new note
C
A N
S L
I M
|
GNC
-
NYSE
G N C Holdings Inc
RETAIL - Drug Stores
|
$27.18
|
+0.46
1.72% |
$27.24
|
1,135,205
88.39% of 50 DAV
50 DAV is 1,284,300
|
$27.99
-2.89%
|
10/26/2011
|
$24.60
|
PP = $24.80
|
|
MB = $26.04
|
Most Recent Note - 11/17/2011 6:18:35 PM
G - Small loss today on lighter volume following a negative reversal for a loss on more than 2 times average volume on 11/16/11 after touching a new all-time high. Completed a Secondary Offering on 10/15/11. Recent chart lows (near $23.80) define near term support to watch above its 50 DMA line.
>>> The latest Featured Stock Update with an annotated graph appeared on 10/26/2011. Click here.
View all notes |
Alert me of new notes |
CANSLIM.net Company Profile |
SEC |
Zacks Reports |
StockTalk |
News |
Chart |
Request a new note
C
A N
S L
I M
|
HMSY
-
NASDAQ
H M S Holdings Corp
COMPUTER SOFTWARE and SERVICES - Healthcare Information Service
|
$28.75
|
-0.06
-0.21% |
$29.00
|
473,589
69.79% of 50 DAV
50 DAV is 678,600
|
$31.99
-10.13%
|
10/27/2011
|
$26.44
|
PP = $28.37
|
|
MB = $29.79
|
Most Recent Note - 11/17/2011 6:20:04 PM
G - Today was its 4th consecutive small loss on near average volume following a negative reversal on 11/14/11 after hitting a new all-time high. Prior highs in the $27-28 area define support to watch on pullbacks.
>>> The latest Featured Stock Update with an annotated graph appeared on 11/4/2011. Click here.
View all notes |
Alert me of new notes |
CANSLIM.net Company Profile |
SEC |
Zacks Reports |
StockTalk |
News |
Chart |
Request a new note
C
A N
S L
I M
|
ISRG
-
NASDAQ
Intuitive Surgical Inc
HEALTH SERVICES - Medical Appliances and Equipment
|
$423.06
|
-5.83
-1.36% |
$430.35
|
342,627
83.02% of 50 DAV
50 DAV is 412,700
|
$449.06
-5.79%
|
10/19/2011
|
$424.69
|
PP = $415.29
|
|
MB = $436.05
|
Most Recent Note - 11/17/2011 6:23:42 PM
G - Today's 2nd consecutive loss came with near average volume following 4 consecutive gains on lighter than average volume. Volume totals have been cooling in recent weeks while holding its ground and rising. See the latest FSU analysis for more details and a new annotated weekly graph.
>>> The latest Featured Stock Update with an annotated graph appeared on 11/15/2011. Click here.
View all notes |
Alert me of new notes |
CANSLIM.net Company Profile |
SEC |
Zacks Reports |
StockTalk |
News |
Chart |
Request a new note
C
A N
S L
I M
|
Symbol/Exchange
Company Name
Industry Group |
PRICE |
CHANGE
(%Change) |
Day High |
Volume
(% DAV)
(% 50 day avg vol) |
52 Wk Hi
% From Hi |
Featured
Date |
Price
Featured |
Pivot Featured |
|
Max Buy |
MG
-
NYSE
Mistras Group Inc
DIVERSIFIED SERVICES - Bulding and Faci;ity Management Services
|
$21.93
|
-0.28
-1.26% |
$22.39
|
79,967
38.61% of 50 DAV
50 DAV is 207,100
|
$23.51
-6.72%
|
10/28/2011
|
$22.49
|
PP = $23.61
|
|
MB = $24.79
|
Most Recent Note - 11/17/2011 6:25:06 PM
Y - Second consecutive small loss today on light volume following a solid gain on 11/15/11 backed by above average volume. Still perched within striking distance of all-time high. Its 50 DMA line and prior highs define chart support near $21.
>>> The latest Featured Stock Update with an annotated graph appeared on 11/11/2011. Click here.
View all notes |
Alert me of new notes |
CANSLIM.net Company Profile |
SEC |
Zacks Reports |
StockTalk |
News |
Chart |
Request a new note
C
A N
S L
I M
|
MKTX
-
NASDAQ
Marketaxess Holdings Inc
FINANCIAL SERVICES - Investment Brokerage - Nationa
|
$27.52
|
+0.50
1.85% |
$27.62
|
130,546
53.92% of 50 DAV
50 DAV is 242,100
|
$31.45
-12.50%
|
10/28/2011
|
$29.79
|
PP = $31.05
|
|
MB = $32.60
|
Most Recent Note - 11/17/2011 6:30:45 PM
G - Sank below its 50 DMA line raising concerns and its color code is changed to green. Prior lows and its 200 DMA line in the $24-25 area define the next support area to watch.
>>> The latest Featured Stock Update with an annotated graph appeared on 10/31/2011. Click here.
View all notes |
Alert me of new notes |
CANSLIM.net Company Profile |
SEC |
Zacks Reports |
StockTalk |
News |
Chart |
Request a new note
C
A N
S L
I M
|
OSIS
-
NASDAQ
O S I Systems Inc
ELECTRONICS - Semiconductor Equipment and Mate
|
$44.83
|
+0.66
1.49% |
$45.44
|
101,511
68.40% of 50 DAV
50 DAV is 148,400
|
$47.39
-5.40%
|
11/1/2011
|
$42.07
|
PP = $45.57
|
|
MB = $47.85
|
Most Recent Note - 11/17/2011 6:54:09 PM
Y - Finished in the upper third of its intra-day range today after sputtering below its pivot point. Previously noted - "Lighter than average behind last week's gains, not indicative of great institutional (I criteria) buying demand. Volume-driven gains above its pivot point may trigger a technical buy signal."
>>> The latest Featured Stock Update with an annotated graph appeared on 11/1/2011. Click here.
View all notes |
Alert me of new notes |
CANSLIM.net Company Profile |
SEC |
Zacks Reports |
StockTalk |
News |
Chart |
Request a new note
C
A N
S L
I M
|
RAX
-
NYSE
Rackspace Hosting Inc
INTERNET - Internet Software and; Services
|
$41.06
|
-0.87
-2.07% |
$42.00
|
1,068,119
67.15% of 50 DAV
50 DAV is 1,590,600
|
$46.50
-11.69%
|
11/8/2011
|
$44.28
|
PP = $46.27
|
|
MB = $48.58
|
Most Recent Note - 11/18/2011 5:53:07 PM
Y - Finished -11.7% off its 52-week high today, forming a downward sloping handle with light volume totals following a 19-week cup shaped base pattern. Volume driven gains above its pivot point may trigger a technical buy signal.
>>> The latest Featured Stock Update with an annotated graph appeared on 11/10/2011. Click here.
View all notes |
Alert me of new notes |
CANSLIM.net Company Profile |
SEC |
Zacks Reports |
StockTalk |
News |
Chart |
Request a new note
C
A N
S L
I M
|
SWI
-
NYSE
Solarwinds Inc
COMPUTER SOFTWARE and SERVICES - Application Software
|
$29.93
|
-0.98
-3.17% |
$31.13
|
1,315,204
112.20% of 50 DAV
50 DAV is 1,172,200
|
$31.69
-5.55%
|
10/27/2011
|
$27.78
|
PP = $25.62
|
|
MB = $26.90
|
Most Recent Note - 11/18/2011 5:44:43 PM
G - Pulling back on near average volume today, finishing -5.6% off its all-time high. It is extended from its previous base pattern. Prior highs in the $25-26 area define initial chart support to watch on pullbacks.
>>> The latest Featured Stock Update with an annotated graph appeared on 10/27/2011. Click here.
View all notes |
Alert me of new notes |
CANSLIM.net Company Profile |
SEC |
Zacks Reports |
StockTalk |
News |
Chart |
Request a new note
C
A N
S L
I M
|
Symbol/Exchange
Company Name
Industry Group |
PRICE |
CHANGE
(%Change) |
Day High |
Volume
(% DAV)
(% 50 day avg vol) |
52 Wk Hi
% From Hi |
Featured
Date |
Price
Featured |
Pivot Featured |
|
Max Buy |
TDG
-
NYSE
Transdigm Group Inc
AEROSPACE/DEFENSE - Aerospace/Defense Products and; Services
|
$94.41
|
+0.84
0.90% |
$95.15
|
443,303
107.34% of 50 DAV
50 DAV is 413,000
|
$102.73
-8.10%
|
11/9/2011
|
$98.45
|
PP = $95.14
|
|
MB = $99.90
|
Most Recent Note - 11/18/2011 5:48:01 PM
Y - Held its ground today following a negative reversal on the prior session after hitting a new 52-week high. A volume-driven gain on 11/08/11 helped it break out from a 19-week base. Reported earnings +42% on +54% sales revenues for the quarter ended September 30, 2011.
>>> The latest Featured Stock Update with an annotated graph appeared on 11/9/2011. Click here.
View all notes |
Alert me of new notes |
CANSLIM.net Company Profile |
SEC |
Zacks Reports |
StockTalk |
News |
Chart |
Request a new note
C
A N
S L
I M
|
UA
-
NYSE
Under Armour Inc Cl A
CONSUMER NON-DURABLES - Textile - Apparel Clothing
|
$76.89
|
-1.71
-2.18% |
$79.39
|
876,850
66.01% of 50 DAV
50 DAV is 1,328,400
|
$87.40
-12.03%
|
10/25/2011
|
$82.43
|
PP = $80.80
|
|
MB = $84.84
|
Most Recent Note - 11/18/2011 5:50:09 PM
Y - Volume was lighter than average today as it sank further below prior highs near $80 previously noted as initial support, technically negating its recent breakout and raising concerns. It is currently testing important chart support at its 50 DMA line.
>>> The latest Featured Stock Update with an annotated graph appeared on 11/3/2011. Click here.
View all notes |
Alert me of new notes |
CANSLIM.net Company Profile |
SEC |
Zacks Reports |
StockTalk |
News |
Chart |
Request a new note
C
A N
S L
I M
|
V
-
NYSE
Visa Inc Cl A
DIVERSIFIED SERVICES - Business/Management Services
|
$90.81
|
-0.59
-0.65% |
$91.65
|
3,226,489
60.82% of 50 DAV
50 DAV is 5,305,100
|
$95.87
-5.28%
|
10/24/2011
|
$94.21
|
PP = $94.85
|
|
MB = $99.59
|
Most Recent Note - 11/18/2011 5:51:25 PM
Y - Down today on lighter volume finishing near its 50 DMA line previously noted as near-term chart support to watch. A violation of that important short-term average line would trigger more worrisome technical sell signals.
>>> The latest Featured Stock Update with an annotated graph appeared on 11/18/2011. Click here.
View all notes |
Alert me of new notes |
CANSLIM.net Company Profile |
SEC |
Zacks Reports |
StockTalk |
News |
Chart |
Request a new note
C
A N
S L
I M
|
|
|
|
THESE ARE NOT BUY RECOMMENDATIONS!
Comments contained in the body of this report are technical
opinions only. The material herein has been obtained
from sources believed to be reliable and accurate, however,
its accuracy and completeness cannot be guaranteed.
This site is not an investment advisor, hence it does
not endorse or recommend any securities or other investments.
Any recommendation contained in this report may not
be suitable for all investors and it is not to be deemed
an offer or solicitation on our part with respect to
the purchase or sale of any securities. All trademarks,
service marks and trade names appearing in this report
are the property of their respective owners, and are
likewise used for identification purposes only.
This report is a service available
only to active Paid Premium Members.
You may opt-out of receiving report notifications
at any time. Questions or comments may be submitted
by writing to Premium Membership Services 665 S.E. 10 Street, Suite 201 Deerfield Beach, FL 33441-5634 or by calling 1-800-965-8307
or 954-785-1121.
|
|
|

