You are not logged in.
This means you
CAN ONLY VIEW reports that were published prior to Monday, April 14, 2025.
You
MUST UPGRADE YOUR MEMBERSHIP if you want to see any current reports.
AFTER MARKET UPDATE - FRIDAY, NOVEMBER 20TH, 2009
Previous After Market Report Next After Market Report >>>
|
|
|
|
DOW |
-14.28 |
10,318.16 |
-0.14% |
|
Volume |
1,142,270,810 |
+5% |
|
Volume |
1,986,057,960 |
-15% |
|
NASDAQ |
-10.78 |
2,146.04 |
-0.50% |
|
Advancers |
1,266 |
41% |
|
Advancers |
1,250 |
44% |
|
S&P 500 |
-3.52 |
1,091.38 |
-0.32% |
|
Decliners |
1,719 |
55% |
|
Decliners |
1,454 |
51% |
|
Russell 2000 |
-1.00 |
584.68 |
-0.17% |
|
52 Wk Highs |
52 |
|
|
52 Wk Highs |
44 |
|
|
S&P 600 |
-0.31 |
309.07 |
-0.10% |
|
52 Wk Lows |
3 |
|
|
52 Wk Lows |
21 |
|
|
 |
Leadership Lacking As Major Averages Pull Back
Adam Sarhan, Contributing Writer,
The major averages rallied during the first half of the week but the bears showed up in the latter half and erased most of the gains and sent stocks lower. Volume, a critical component of institutional demand, was heavier than Thursday's levels on the NYSE but lighter on the Nasdaq exchange which was unexpected since a series of options expired on Friday. Decliners led advancers by about a 3-to-2 ratio on the NYSE and by a 5-to-4 ratio on the Nasdaq exchange. There were only 12 high-ranked companies from the CANSLIM.net Leaders List making a new 52-week high and appearing on the CANSLIM.net BreakOuts Page, slightly up from the 10 issues that appeared on the prior session. In terms of new leadership, it was encouraging to see new 52-week highs outnumber new 52-week lows on the NYSE and Nasdaq exchange.
Stocks enjoyed healthy gains on Monday which helped send the benchmark S&P 500 index above near term resistance (1,100) and to fresh 2009 highs! The US dollar fell after Asian government's pledged to standby their economic stimulus packages. The 21-member Asia-Pacific Economic Cooperation group, which currently comprises over half of the global economy (approximately +54%), announced that they will maintain their massive economic stimulus packages well into 2010. The greenback fell to a fresh 15-month low which sent a host of dollar denominated assets higher: mainly stocks and commodities! Turning to the economic front, the US government said retail sales grew +1.4% in October. Several of the country's largest credit card issuers rallied after reporting charge backs (i.e. bad loans) fell for a 6th straight month. Elsewhere, Federal Reserve Chairman Ben Bernanke gave a speech to the Economic Club in New York and said economic “headwinds” remain in the economy. He also said that, “Significant economic challenges remain" He went on to say, "The flow of credit remains constrained, economic activity weak and unemployment much too high. Future setbacks are possible.” He also noted that we are in a much better place in Q4 2009 then where we in the same period last year.
On Tuesday, stocks opened lower but closed higher even as the dollar rallied. Inflation concerns eased after the government released a weaker than expected producer price index (PPI). The headline reading increased +0.3% last month after sliding -0.6% in September. October's reading was lower than the Street's estimate of a +0.5% rebound. However, the "big" news in the report was that the core rate, which excludes food and energy, unexpectedly fell -0.6%, following a -0.1% decline in September. A separate report showed that the country's manufacturing sector continued to grow, albeit at a very slow rate. At 1:00PM EST, the National Association of Home Builders released their housing market index which was unchanged at 17 in November which gave investors some clue on how the housing starts will fare when the government releases that report tomorrow.
The bears showed up on Wednesday and spent the rest of the week sending stocks lower. A slew of economic data was released which led many to question the health of this recovery. The Labor Department released a stronger-than-expected consumer price index (CPI) which ignited inflationary concerns. Headline CPI rose +0.3% which was higher than the Street's forecast for a +0.2% gain. Core CPI, which excludes food and energy, was unchanged from last month's reading of a +0.2% gain. However, core prices also topped the Street's estimate for a +0.1% gain and is the component of the report that the Federal Reserve tends to focus on. The uptick in consumer prices sparked concern that companies will have little room to raise prices this holiday season (which curbs earnings) due to the fact that unemployment is at a 26-year high of +10.2% and wages fell -5.2% in September from the same period last year. The Commerce Department released a separate report which showed that housing starts unexpectedly tanked last month. Housing starts (a.k.a registrations for new construction for residential housing units), slid -10.6% in October which was well below estimates. Permits for new construction slid -28.9% from the same period last year which led many to question the sustainability of the housing recovery.
On Thursday, stocks got smacked as the dollar continued to rally after the Labor Department said jobless claims (a.k.a the number of Americans filing claims for unemployment benefits) was unchanged at a 10-month low. Stocks also got hit after a report was released that showed mortgage delinquencies surged. So far, since the financial crisis began in 2007, writedowns (a.k.a losses) of mortgage-backed debt has surpassed $1.7 trillion at some of the world's largest financial firms. The spike in mortgage delinquencies was due to a 26-year high in unemployment and a down tick in wages. The Mortgage Bankers Association said that out of every six home loans insured by the Federal Housing Administration there is at least one late payment and +3.32% of those loans were in foreclosure last quarter. This was the highest reading for both measures in at least 30 years and bodes poorly for the troubled housing market. Elsewhere, the Organization for Economic Cooperation and Development (OECD) doubled its growth forecast for industrialized nations in 2010 to +1.9%. However, the group said that record debt levels may burden future growth. Separately, the Federal Reserve Bank of Philadelphia released its general economic index which topped estimates and suggests a slight improvement in that region.
On Friday, European Central Bank (ECB) President, Jean-Claude Trichet signaled that the ECB will begin curbing its efforts to aid ailing banks. Those of you who have read this commentary over the past 5 years know that we like to analyze the news, yet we pay a lot more attention on how the market reacts to the news. That said, the market has reacted and continues to react rather well to the latest round of economic and earnings data. The vast majority of third quarter earnings are now behind us and the major averages remain perched just under fresh 2009 highs! Barring some unforeseen event, earnings were down for the average company in the S&P 500 for the ninth straight quarter but managed to exceed the average estimate, which is one reason why the markets have reacted so well to earnings. That coupled with the notion that the "worst is behind us" explains the market's collective "take" on Q3 earnings. In addition, economic data, although not impressive, has improved markedly from this time last year which suggests the global government stimulus packages are working.
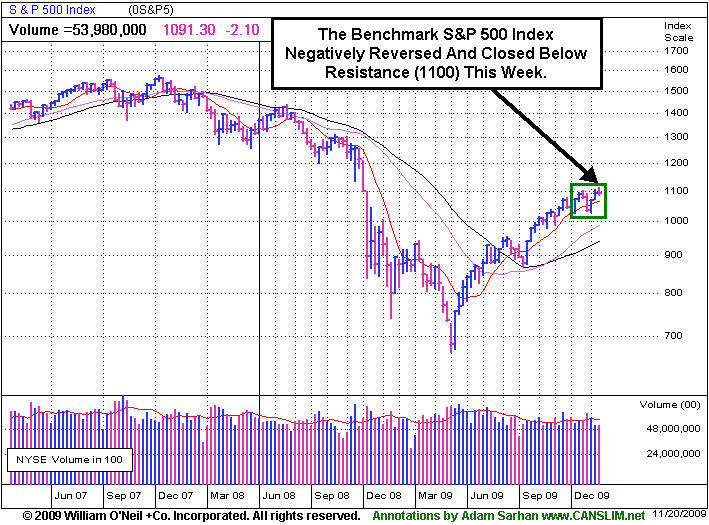
The benchmark S&P 500 has surged a whopping +64% from its 12-year low in March as global GDP has rebounded. The two primary concerns regarding this rally is the dearth of high quality leadership triggering technical buy signals and that volume has waned in recent weeks. Most liquid leaders advanced today which reiterates the importance of keeping a close eye on the leaders. The universe of high ranked leading stocks remains uncomfortably thin which is exactly how this market has been performing since the March lows.
PICTURED: The S&P 500 Index negatively reversed and closed lower for the week.
|
|
|
 |
Will Healthcare Group Remain Healthy Under Reforms?
Kenneth J. Gruneisen - Passed the CAN SLIM® Master's Exam
The majority of industry groups continued to retreat on Friday, while the Healthcare Index ($HMO +0.09%) barely ended in positive territory (see more on this below). The Oil Services Index ($OSX -2.23%) and Integrated Oil Index ($XOI -0.71%) fell along with the Gold & Silver Index ($XAU -0.84%). Technology groups collectively backpedaled again as the Networking Index ($NWX -1.65%), Semiconductor Index ($SOX -0.81%), Internet Index ($IIX -0.62%), and Biotechnology Index ($BTK -0.41%) registered modest losses. Mild losses from the Bank Index ($BKX -0.25%), Broker/Dealer Index ($XBD -0.13%), and Retail Index ($RLX -0.07%) contributed to the session's negative bias.
Charts courtesy www.stockcharts.com
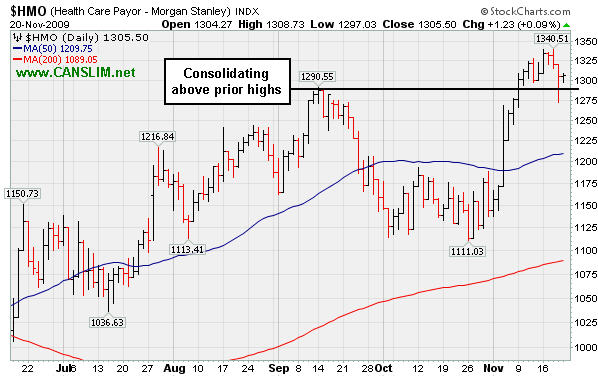
PICTURED 1: The Healthcare Index ($HMO +0.09%) was a standout on Friday as it firmly held its ground, as shown on its 6-month chart. Its ability to continue making progress above its September highs, or not, may send investors a telling message. As seen in the table below, its YTD gain of about +35% does not put it among 2009's best percentage gainers.
Charts courtesy www.stockcharts.com
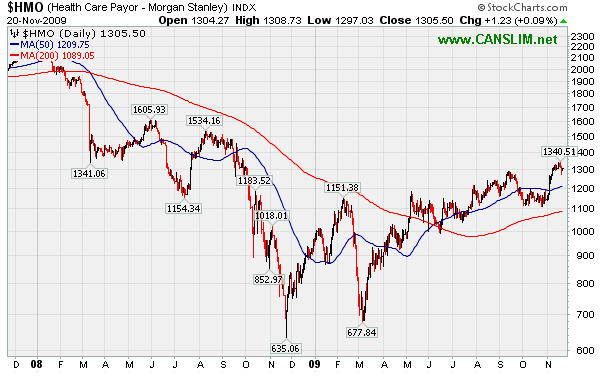
PICTURED 2: The 2-year chart of the Healthcare Index shows the horrific decline the group faced in 2008. Long-time readers of this report may recall when we noted in the past that the heathcare group last year clearly diverted from its usual path as a strong defensive "safe haven", while the conventional wisdom that has usually buoyed the group in trying times has been that people still get sick and need medical care when the economic outlook is questionable. The healthier action in the healthcare group this year is encouraging. Lobbyists are surely pressing forward with their agendas, however, questions still remain about how profitable healthcare companies can be in the future as the Obama administration presses forth on reforms. Follow the charts to monitor the health of this industry group, and others. Remember, group action is important, and the investment system encourages selecting stocks only from within a leading investment group (L criteria).
| Oil Services |
$OSX |
188.99 |
-4.32 |
-2.23% |
+55.69% |
| Healthcare |
$HMO |
1,305.50 |
+1.23 |
+0.09% |
+35.96% |
| Integrated Oil |
$XOI |
1,073.09 |
-7.66 |
-0.71% |
+9.53% |
| Semiconductor |
$SOX |
307.97 |
-2.53 |
-0.81% |
+45.15% |
| Networking |
$NWX |
224.80 |
-3.76 |
-1.65% |
+56.23% |
| Internet |
$IIX |
223.52 |
-1.39 |
-0.62% |
+67.09% |
| Broker/Dealer |
$XBD |
115.83 |
-0.15 |
-0.13% |
+49.52% |
| Retail |
$RLX |
400.55 |
-0.27 |
-0.07% |
+43.43% |
| Gold & Silver |
$XAU |
184.28 |
-1.57 |
-0.84% |
+48.79% |
| Bank |
$BKX |
43.67 |
-0.11 |
-0.25% |
-1.47% |
| Biotech |
$BTK |
866.28 |
-3.57 |
-0.41% |
+33.86% |
|
|
|
 |
Chart Shows Former Leader Turning Cold
Kenneth J. Gruneisen - Passed the CAN SLIM® Master's Exam
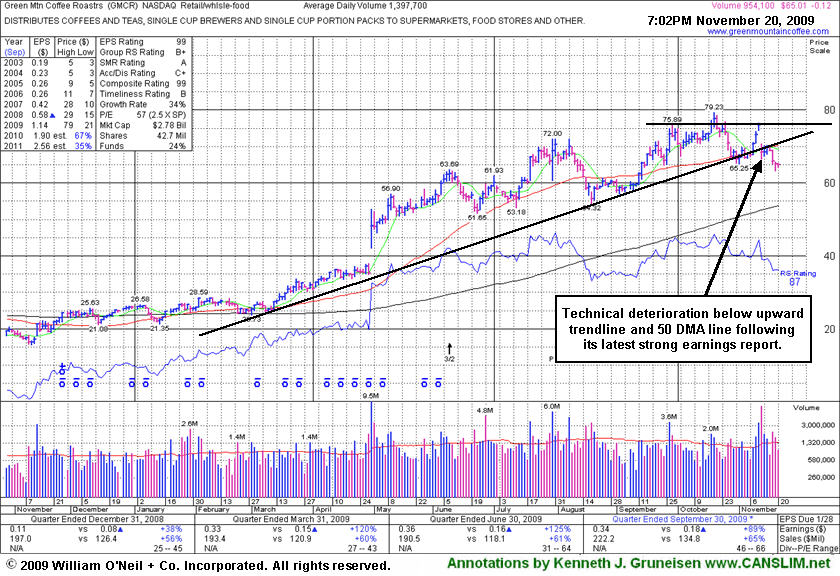
Green Mountain Coffee Roasters (GMCR -$0.12 or -0.18% to $65.01) has slumped badly since its last appearance in the FSU section on November 11, 2009 under the headline "Choppy Action Has Not Allowed Sound Base To Form." It gapped down on 12/12/09 after reporting strong quarterly results for the period ended Sept 30, 2009, suffering a considerable loss on heavy volume, closing below its 50 DMA line. It negated its recent breakout from a cup-with-high-handle pattern and slumped below its July highs, triggering technical sell signals. It has also slumped under a longer-term upward trendline. It would need to rally back above its recent chart highs near $76 for its outlook to improve.
Do not be confused by the 3-for-2 split that occurred in the interim, as GMCR has traded up as much as +204% since appearing with an annotated graph under the headline "It May Soon Be Time To Go Green" when featured in the January 2009 CANSLIM.net News (read here).
|
|
|
Color Codes Explained :
Y - Better candidates highlighted by our
staff of experts.
G - Previously featured
in past reports as yellow but may no longer be buyable under the
guidelines.
***Last / Change / Volume quote data in this table corresponds with the timestamp on the note***
Symbol/Exchange
Company Name
Industry Group |
Last |
Chg. |
Vol
% DAV |
Date Featured |
Price Featured |
Latest Pivot Point
Featured |
Status |
| Latest Max Buy Price |
ARST
-
|
$24.42
|
-0.06
|
506,649
83% DAV
614,000
|
9/1/2009
(Date
Featured) |
$19.91
(Price
Featured) |
PP = $20.90 |
G |
| MB = $21.95 |
Most Recent Note - 11/20/2009 6:38:56 PM
G - Small loss today on below average volume, closing in the upper half of the session's range after intra-day trading under its 50 DMA line (now $24.16). ARST was first featured in yellow at $19.91 in the 9/01/09 mid-day report with an annotated daily graph (read here).
>>> The latest Featured Stock Update with an annotated graph appeared on 11/19/2009. click here.
|
|
C
A
S
I |
News |
Chart |
SEC
View all notes Alert
me of new notes
Company
Profile
|
ASIA
-
|
$24.98
|
-0.10
|
542,400
54% DAV
1,011,300
|
10/14/2009
(Date
Featured) |
$23.05
(Price
Featured) |
PP = $22.19 |
G |
| MB = $23.30 |
Most Recent Note - 11/20/2009 6:39:47 PM
G - Consecutive losses on light volume for 3 sessions, still hovering near its 2009 highs, extended from its latest sound base. Featured 10/14/09 in the mid-day report (read here) as it gapped up for a new 52-week high with 5 times average volume, triggering a technical buy signal by blasting above its pivot point. First featured in the August 2009 CANSLIM.net News (read here).
>>> The latest Featured Stock Update with an annotated graph appeared on 11/12/2009. click here.
|
|
C
A
S
I |
News |
Chart |
SEC
View all notes Alert
me of new notes
Company
Profile
|
BIDU
- NASDAQ
Baidu Inc Ads
INTERNET - Internet Information Providers
|
$427.59
|
-0.42
|
1,113,425
49% DAV
2,256,500
|
9/8/2009
(Date
Featured) |
$351.80
(Price
Featured) |
PP = $368.59 |
G |
| MB = $387.02 |
Most Recent Note - 11/20/2009 6:40:52 PM
G - Consecutive small losses on 3 sessions with light volume while hovering near all-time highs. Proved resilient near its 50 DMA line after its 10/27/09 gap down. As recently noted, "Choppy action has not allowed it to form a sound base in recent weeks." BIDU traded up as much as +23% from its price when featured in yellow in the 9/08/09 Mid-Day BreakOuts Report (read here).
>>> The latest Featured Stock Update with an annotated graph appeared on 11/10/2009. click here.
|
|
C
A
S
I |
News |
Chart |
SEC
View all notes Alert
me of new notes
Company
Profile
|
CACC
- NASDAQ
Credit Acceptance Corp
FINANCIAL SERVICES - Credit Services
|
$34.58
|
-0.32
|
24,723
69% DAV
35,800
|
9/29/2009
(Date
Featured) |
$33.48
(Price
Featured) |
PP = $37.10 |
Y |
| MB = $38.96 |
Most Recent Note - 11/20/2009 6:42:19 PM
Y - Color code was changed to yellow with new pivot point and max buy levels noted. After a 5-week flat base it is continuing its consolidation in a very orderly fashion above prior chart highs and its 50 DMA line in the $32 area. The Finance - Consumer/Commercial Loans firm has maintained a great track record of annual and quarterly sales revenues and earnings increases. It was featured on 9/29/09 in yellow in the mid-day report (read here).
>>> The latest Featured Stock Update with an annotated graph appeared on 11/16/2009. click here.
|
|
C
A
S
I |
News |
Chart |
SEC
View all notes Alert
me of new notes
Company
Profile
|
CRM
- NYSE
Salesforce.com Inc
INTERNET - Internet Software & Services
|
$62.56
|
-0.02
|
1,424,984
79% DAV
1,804,600
|
8/16/2009
(Date
Featured) |
$47.12
(Price
Featured) |
PP = $45.59 |
G |
| MB = $47.87 |
Most Recent Note - 11/20/2009 6:43:45 PM
G - Consecutive losses on 4 sessions, pulling back after another strong quarterly report for the period ended October 31, 2009. It is not near any sound base, but after finding prompt support at its 50 DMA line it is within close range of its prior high.
>>> The latest Featured Stock Update with an annotated graph appeared on 11/9/2009. click here.
|
|
C
A
S
I |
News |
Chart |
SEC
View all notes Alert
me of new notes
Company
Profile
|
GMCR
- NASDAQ
Green Mtn Coffee Roastrs
FOOD & BEVERAGE - Processed & Packaged Goods
|
$65.01
|
-0.12
|
963,251
69% DAV
1,397,700
|
10/5/2009
(Date
Featured) |
$71.11
(Price
Featured) |
PP = $75.89 |
G |
| MB = $79.68 |
Most Recent Note - 11/20/2009 6:51:48 PM
G - Another small loss today on light volume. It recently triggered a sell signal by its 50 DMA line violation. Gapped down on 11/12/09 after reporting strong quarterly results for the period ended Sept 30, 2009. As recently noted, "Its choppy action in recent weeks has not allowed for a sound new base to form."
>>> The latest Featured Stock Update with an annotated graph appeared on 11/20/2009. click here.
|
|
C
A
S
I |
News |
Chart |
SEC
View all notes Alert
me of new notes
Company
Profile
|
HEAT
-
|
$13.64
|
-0.20
|
786,097
125% DAV
628,200
|
11/17/2009
(Date
Featured) |
$12.00
(Price
Featured) |
PP = $12.61 |
G |
| MB = $13.24 |
Most Recent Note - 11/20/2009 6:53:06 PM
G - Held its ground fairly well today after gains on heavy volume for 4 consecutive sessions. It was first featured in yellow in the 11/17/09 mid-day report (read here) when technically rising from a "double bottom" base, reaching a new all-time high. On 9/18/09 it completed an additional share offering. There is limited history for this small Chinese firm in the Pollution Control - Equipment group, however its reported annual earnings (A criteria) history has been strong, and the 3 latest quarters show sales revenues and earnings increases well above the +25% guideline.
>>> The latest Featured Stock Update with an annotated graph appeared on 11/17/2009. click here.
|
|
C
A
S
I |
News |
Chart |
SEC
View all notes Alert
me of new notes
Company
Profile
|
LFT
-
|
$35.07
|
+1.49
|
849,245
178% DAV
476,800
|
11/17/2009
(Date
Featured) |
$31.77
(Price
Featured) |
PP = $33.04 |
G |
| MB = $34.69 |
Most Recent Note - 11/20/2009 6:57:09 PM
G - Considerable gain today with +78% above average volume lifted it to a close beyond its "max buy" level. Color code is changed to green. It rose this week from a choppy 14-week base. Recent highs in the $31 area are an initial support level to watch. A proposed offering of additional shares on 11/16/09 seems well received by the market. Its fundamentals remain strong.
>>> The latest Featured Stock Update with an annotated graph appeared on 11/18/2009. click here.
|
|
C
A
S
I |
News |
Chart |
SEC
View all notes Alert
me of new notes
Company
Profile
|
|
|
|
THESE ARE NOT BUY RECOMMENDATIONS!
Comments contained in the body of this report are technical
opinions only. The material herein has been obtained
from sources believed to be reliable and accurate, however,
its accuracy and completeness cannot be guaranteed.
This site is not an investment advisor, hence it does
not endorse or recommend any securities or other investments.
Any recommendation contained in this report may not
be suitable for all investors and it is not to be deemed
an offer or solicitation on our part with respect to
the purchase or sale of any securities. All trademarks,
service marks and trade names appearing in this report
are the property of their respective owners, and are
likewise used for identification purposes only.
This report is a service available
only to active Paid Premium Members.
You may opt-out of receiving report notifications
at any time. Questions or comments may be submitted
by writing to Premium Membership Services 665 S.E. 10 Street, Suite 201 Deerfield Beach, FL 33441-5634 or by calling 1-800-965-8307
or 954-785-1121.
|
|
|


