***Last / Change / Volume data in this table is the closing quote data***
Symbol/Exchange
Company Name
Industry Group |
PRICE |
CHANGE
(%Change) |
Day High |
Volume
(% DAV)
(% 50 day avg vol) |
52 Wk Hi
% From Hi |
Featured
Date |
Price
Featured |
Pivot Featured |
|
Max Buy |
ABV
-
NYSE
Comp De Bebidas Adr
FOOD and BEVERAGE - Beverages - Brewers
|
$141.49
|
+3.30
2.39% |
$142.34
|
331,928
50.24% of 50 DAV
50 DAV is 660,700
|
$145.36
-2.66%
|
11/4/2010
|
$142.35
|
PP = $143.63
|
|
MB = $150.81
|
 Most Recent Note - 11/18/2010 5:49:40 PM
Y - Gapped up today for a gain on light volume. A recent low ($133.38 on 10/27/10) defines support above its 50 DMA line. Color code is changed to yellow based upon its recent resilience, and it ended -2.7% off its all time high.
>>> The latest Featured Stock Update with an annotated graph appeared on 10/11/2010. Click here.
View all notes |
Alert me of new notes |
CANSLIM.net Company Profile |
SEC |
Zacks Reports |
StockTalk |
News |
Chart |
Request a new note
C
A N
S L
I M


|
ARUN
-
NASDAQ
Aruba Networks Inc
COMPUTER HARDWARE - Networking andamp; Communication Dev
|
$22.98
|
+1.66
7.79% |
$23.73
|
4,381,296
181.56% of 50 DAV
50 DAV is 2,413,100
|
$23.85
-3.65%
|
8/30/2010
|
$18.12
|
PP = $18.51
|
|
MB = $19.44
|
Most Recent Note - 11/18/2010 12:26:50 PM
G - Gapped up today after reporting earnings +200% on +44% sales revenues for the quarter ended October 31, 2010 versus the year ago period. It has not formed a sound base, yet it found support near its 50 DMA line throughout its rally since May.
>>> The latest Featured Stock Update with an annotated graph appeared on 10/26/2010. Click here.
View all notes |
Alert me of new notes |
CANSLIM.net Company Profile |
SEC |
Zacks Reports |
StockTalk |
News |
Chart |
Request a new note
C
A N
S L
I M
|
BIDU
-
NASDAQ
Baidu Inc Ads
INTERNET - Internet Information Providers
|
$108.14
|
+1.22
1.14% |
$110.50
|
10,167,609
84.29% of 50 DAV
50 DAV is 12,062,500
|
$115.04
-6.00%
|
9/17/2010
|
$85.73
|
PP = $88.42
|
|
MB = $92.84
|
Most Recent Note - 11/17/2010 3:26:46 PM
G - Up on lighter volume today after enduring mild distributional pressure and slumping toward its 50 DMA line. It may produce more climactic gains, however it is extended from a sound base pattern now and a riskier "late stage" candidate. BIDU is up 11-fold from when it was first featured in yellow on October 30, 2006 (read here). Following a deep correction and Bear Market, it has been a fixture on the Featured Stocks page and rallied +212% in the 14 months since returning to prominence September 8, 2009 (read here).
>>> The latest Featured Stock Update with an annotated graph appeared on 10/7/2010. Click here.
View all notes |
Alert me of new notes |
CANSLIM.net Company Profile |
SEC |
Zacks Reports |
StockTalk |
News |
Chart |
Request a new note
C
A N
S L
I M
|
CACC
-
NASDAQ
Credit Acceptance Corp
FINANCIAL SERVICES - Credit Services
|
$58.33
|
+2.15
3.83% |
$58.47
|
13,993
53.00% of 50 DAV
50 DAV is 26,400
|
$63.45
-8.07%
|
11/3/2010
|
$59.86
|
PP = $63.55
|
|
MB = $66.73
|
Most Recent Note - 11/18/2010 3:59:10 PM
G - Rallied back toward its 50 DMA line with another gain today with light volume. An 8-session slide that violated the previously noted chart low ($55.07 on 10/04/10) recently raised concerns. Long ago chart high ($53.97) are the next likely support level above its 200 DMA line.
>>> The latest Featured Stock Update with an annotated graph appeared on 10/29/2010. Click here.
View all notes |
Alert me of new notes |
CANSLIM.net Company Profile |
SEC |
Zacks Reports |
StockTalk |
News |
Chart |
Request a new note
C
A N
S L
I M
|
CMG
-
NYSE
Chipotle Mexican Grill
LEISURE - Restaurants
|
$227.64
|
-3.32
-1.44% |
$231.99
|
1,097,653
135.16% of 50 DAV
50 DAV is 812,100
|
$240.78
-5.46%
|
9/1/2010
|
$158.31
|
PP = $155.52
|
|
MB = $163.30
|
Most Recent Note - 11/18/2010 5:25:15 PM
G - Down slightly today with above average volume, perched near all-time highs, enduring mild distributional pressure. It is extended from any sound base pattern. Its 50 DMA line (now $193) defines the nearest chart support level.
>>> The latest Featured Stock Update with an annotated graph appeared on 10/28/2010. Click here.
View all notes |
Alert me of new notes |
CANSLIM.net Company Profile |
SEC |
Zacks Reports |
StockTalk |
News |
Chart |
Request a new note
C
A N
S L
I M
|
Symbol/Exchange
Company Name
Industry Group |
PRICE |
CHANGE
(%Change) |
Day High |
Volume
(% DAV)
(% 50 day avg vol) |
52 Wk Hi
% From Hi |
Featured
Date |
Price
Featured |
Pivot Featured |
|
Max Buy |
CTRP
-
NASDAQ
Ctrip.Com Intl Ltd Adr
LEISURE - Resorts and Casinos
|
$46.61
|
+0.71
1.55% |
$46.92
|
1,555,553
76.75% of 50 DAV
50 DAV is 2,026,800
|
$53.16
-12.32%
|
9/24/2010
|
$46.75
|
PP = $47.11
|
|
MB = $49.47
|
Most Recent Note - 11/18/2010 5:28:01 PM
G - Small gains today and on the prior session leave it still below its 50 DMA line. Recent losses with above average volume raised greater concerns as it closed below its old high close ($45.80 from 6/21/10) completely negating its prior breakout and all gains since its breakout shown in the last FSU section analysis.
>>> The latest Featured Stock Update with an annotated graph appeared on 9/28/2010. Click here.
View all notes |
Alert me of new notes |
CANSLIM.net Company Profile |
SEC |
Zacks Reports |
StockTalk |
News |
Chart |
Request a new note
C
A N
S L
I M
|
DECK
-
NASDAQ
Deckers Outdoor Corp
CONSUMER NON-DURABLES - Textile - Apparel Footwear
|
$63.34
|
+1.80
2.92% |
$64.20
|
1,208,004
100.05% of 50 DAV
50 DAV is 1,207,400
|
$63.55
-0.33%
|
10/27/2010
|
$54.16
|
PP = $54.86
|
|
MB = $57.60
|
Most Recent Note - 11/18/2010 5:02:39 PM
G - Gapped up today and hit a new all-time high. It is extended from its latest sound base, while prior highs and its 50 DMA line define the nearest chart support.
>>> The latest Featured Stock Update with an annotated graph appeared on 10/27/2010. Click here.
View all notes |
Alert me of new notes |
CANSLIM.net Company Profile |
SEC |
Zacks Reports |
StockTalk |
News |
Chart |
Request a new note
C
A N
S L
I M
|
EZPW
-
NASDAQ
Ezcorp Inc Cl A
SPECIALTY RETAIL - Specialty Retail, Other
|
$24.57
|
+0.07
0.29% |
$25.04
|
204,162
66.65% of 50 DAV
50 DAV is 306,300
|
$25.65
-4.21%
|
11/5/2010
|
$24.02
|
PP = $23.85
|
|
MB = $25.04
|
Most Recent Note - 11/17/2010 3:05:22 PM
G - Consolidating near its all-time high while recently enduring mild distributional pressure. Prior highs in the $22-23 area define chart support to watch above its 50 DMA line.
>>> The latest Featured Stock Update with an annotated graph appeared on 11/6/2010. Click here.
View all notes |
Alert me of new notes |
CANSLIM.net Company Profile |
SEC |
Zacks Reports |
StockTalk |
News |
Chart |
Request a new note
C
A N
S L
I M
|
FFIV
-
NASDAQ
F 5 Networks Inc
INTERNET - Internet Software and Services
|
$120.51
|
+5.50
4.78% |
$121.90
|
2,478,463
91.11% of 50 DAV
50 DAV is 2,720,400
|
$127.95
-5.81%
|
6/16/2010
|
$74.50
|
PP = $74.10
|
|
MB = $77.81
|
Most Recent Note - 11/18/2010 3:51:40 PM
G - Gapped up today for a solid gain, ending a streak of 3 small losses. It is extended from any sound base pattern. Prior highs in the $112 area define initial chart support.
>>> The latest Featured Stock Update with an annotated graph appeared on 11/15/2010. Click here.
View all notes |
Alert me of new notes |
CANSLIM.net Company Profile |
SEC |
Zacks Reports |
StockTalk |
News |
Chart |
Request a new note
C
A N
S L
I M
|
FOSL
-
NASDAQ
Fossil Inc
CONSUMER DURABLES - Recreational Goods, Other
|
$69.03
|
+2.21
3.31% |
$69.68
|
703,374
90.21% of 50 DAV
50 DAV is 779,700
|
$70.07
-1.48%
|
10/20/2010
|
$54.12
|
PP = $55.61
|
|
MB = $58.39
|
Most Recent Note - 11/18/2010 4:45:56 PM
G - Gapped up today and rallied for its second highest close. Extended from any sound base, meanwhile an upward trendline connecting its July-October lows defines support to watch above its 50 DMA line.
>>> The latest Featured Stock Update with an annotated graph appeared on 10/5/2010. Click here.
View all notes |
Alert me of new notes |
CANSLIM.net Company Profile |
SEC |
Zacks Reports |
StockTalk |
News |
Chart |
Request a new note
C
A N
S L
I M
|
Symbol/Exchange
Company Name
Industry Group |
PRICE |
CHANGE
(%Change) |
Day High |
Volume
(% DAV)
(% 50 day avg vol) |
52 Wk Hi
% From Hi |
Featured
Date |
Price
Featured |
Pivot Featured |
|
Max Buy |
HMSY
-
NASDAQ
H M S Holdings Corp
COMPUTER SOFTWARE and SERVICES - Healthcare Information Service
|
$61.76
|
+1.36
2.25% |
$62.00
|
112,266
51.19% of 50 DAV
50 DAV is 219,300
|
$62.91
-1.83%
|
9/27/2010
|
$57.97
|
PP = $58.36
|
|
MB = $61.28
|
Most Recent Note - 11/18/2010 5:16:04 PM
Y - Gain today with light volume for its third-best close of the year, and no resistance remains due to overhead supply. Prompt support showed up near its 50 DMA line while trading was volatile near its latest earnings report. Any subsequent violation of its 50 DMA could raise greater concerns.
>>> The latest Featured Stock Update with an annotated graph appeared on 9/27/2010. Click here.
View all notes |
Alert me of new notes |
CANSLIM.net Company Profile |
SEC |
Zacks Reports |
StockTalk |
News |
Chart |
Request a new note
C
A N
S L
I M
|
HS
-
NYSE
Healthspring Inc
HEALTH SERVICES - Health Care Plans
|
$28.26
|
+0.41
1.47% |
$28.32
|
541,318
75.17% of 50 DAV
50 DAV is 720,100
|
$29.80
-5.17%
|
8/27/2010
|
$19.91
|
PP = $19.75
|
|
MB = $20.74
|
Most Recent Note - 11/17/2010 3:11:50 PM
G - Hovering -6.6% off its 52-week high, and volume totals have recently been cooling while consolidating above its 50 DMA line which acted as support.
>>> The latest Featured Stock Update with an annotated graph appeared on 10/22/2010. Click here.
View all notes |
Alert me of new notes |
CANSLIM.net Company Profile |
SEC |
Zacks Reports |
StockTalk |
News |
Chart |
Request a new note
C
A N
S L
I M
|
IGTE
-
NASDAQ
Igate Corp
COMPUTER SOFTWARE and SERVICES - Information Technology Service
|
$22.81
|
+0.85
3.87% |
$23.07
|
370,564
51.89% of 50 DAV
50 DAV is 714,100
|
$22.90
-0.39%
|
10/26/2010
|
$17.29
|
PP = $19.55
|
|
MB = $20.53
|
Most Recent Note - 11/18/2010 4:47:32 PM
G - A small gap up gain today with below average volume led to its best ever close. Extended from its latest base, its prior chart highs in the $19 area define initial chart support above its 50 DMA line.
>>> The latest Featured Stock Update with an annotated graph appeared on 11/11/2010. Click here.
View all notes |
Alert me of new notes |
CANSLIM.net Company Profile |
SEC |
Zacks Reports |
StockTalk |
News |
Chart |
Request a new note
C
A N
S L
I M
|
JOBS
-
NASDAQ
Fifty One Job Inc Ads
DIVERSIFIED SERVICES - Staffing and; Outsourcing Service
|
$47.20
|
+0.07
0.15% |
$48.68
|
128,204
59.27% of 50 DAV
50 DAV is 216,300
|
$51.75
-8.79%
|
10/13/2010
|
$42.07
|
PP = $40.60
|
|
MB = $42.63
|
Most Recent Note - 11/17/2010 2:50:30 PM
G - Gain today on lighter volume follows recent distribution, and it has violated the previously noted initial support defined buy an upward trendline connecting its September-November lows. Its 50 DMA line is the next important support to watch.
>>> The latest Featured Stock Update with an annotated graph appeared on 11/16/2010. Click here.
View all notes |
Alert me of new notes |
CANSLIM.net Company Profile |
SEC |
Zacks Reports |
StockTalk |
News |
Chart |
Request a new note
C
A N
S L
I M
|
LFT
-
NYSE
Longtop Financl Tech Ads
COMPUTER SOFTWARE and SERVICES - Business Software and Services
|
$40.02
|
+0.25
0.63% |
$41.27
|
374,966
69.26% of 50 DAV
50 DAV is 541,400
|
$42.86
-6.63%
|
11/5/2010
|
$41.83
|
PP = $40.96
|
|
MB = $43.01
|
Most Recent Note - 11/18/2010 5:11:53 PM
Y - Recently found support near its 50 DMA line. Color code is changed to yellow after a rebound above the $40 level helped its outlook.
>>> The latest Featured Stock Update with an annotated graph appeared on 10/14/2010. Click here.
View all notes |
Alert me of new notes |
CANSLIM.net Company Profile |
SEC |
Zacks Reports |
StockTalk |
News |
Chart |
Request a new note
C
A N
S L
I M
|
Symbol/Exchange
Company Name
Industry Group |
PRICE |
CHANGE
(%Change) |
Day High |
Volume
(% DAV)
(% 50 day avg vol) |
52 Wk Hi
% From Hi |
Featured
Date |
Price
Featured |
Pivot Featured |
|
Max Buy |
LULU
-
NASDAQ
Lululemon Athletica
MANUFACTURING - Textile Manufacturing
|
$48.43
|
+1.35
2.87% |
$48.66
|
1,062,688
88.87% of 50 DAV
50 DAV is 1,195,800
|
$49.75
-2.65%
|
10/8/2010
|
$47.66
|
PP = $46.67
|
|
MB = $49.00
|
Most Recent Note - 11/18/2010 5:20:14 PM
Y - Today marked its 3rd consecutive gain and second-best close of 2010. After a bullish "positive reversal" this week, its 50 DMA line defines an initial support level near recent lows.
>>> The latest Featured Stock Update with an annotated graph appeared on 10/8/2010. Click here.
View all notes |
Alert me of new notes |
CANSLIM.net Company Profile |
SEC |
Zacks Reports |
StockTalk |
News |
Chart |
Request a new note
C
A N
S L
I M
|
MWIV
-
NASDAQ
M W I Veterinary Supply
HEALTH SERVICES - Medical Instruments and; Supplies
|
$58.23
|
+0.82
1.43% |
$58.77
|
52,546
93.50% of 50 DAV
50 DAV is 56,200
|
$63.94
-8.93%
|
11/4/2010
|
$61.79
|
PP = $59.60
|
|
MB = $62.58
|
Most Recent Note - 11/18/2010 5:22:23 PM
Y - Posted a gain today, while mild distributional pressure this week has it testing its 50 DMA line which has been repeatedly noted as a very important support level.
>>> The latest Featured Stock Update with an annotated graph appeared on 11/2/2010. Click here.
View all notes |
Alert me of new notes |
CANSLIM.net Company Profile |
SEC |
Zacks Reports |
StockTalk |
News |
Chart |
Request a new note
C
A N
S L
I M
|
NEOG
-
NASDAQ
Neogen Corp
DRUGS - Diagnostic Substances
|
$35.86
|
+1.42
4.12% |
$36.11
|
75,239
89.15% of 50 DAV
50 DAV is 84,400
|
$36.90
-2.82%
|
9/1/2010
|
$30.79
|
PP = $30.49
|
|
MB = $32.01
|
Most Recent Note - 11/18/2010 5:45:07 PM
G - Rallied up from its 50 DMA line which recently has been a reliable support level. Any subsequent violation could raise concerns and trigger sell signals. It recently stalled after quietly claiming a new all-time high.
>>> The latest Featured Stock Update with an annotated graph appeared on 10/13/2010. Click here.
View all notes |
Alert me of new notes |
CANSLIM.net Company Profile |
SEC |
Zacks Reports |
StockTalk |
News |
Chart |
Request a new note
C
A N
S L
I M
|
NFLX
-
NASDAQ
Netflix Inc
SPECIALTY RETAIL - Music and Video Stores
|
$168.33
|
+1.65
0.99% |
$170.80
|
2,535,162
45.41% of 50 DAV
50 DAV is 5,582,900
|
$184.74
-8.88%
|
11/9/2010
|
$173.10
|
PP = $184.84
|
|
MB = $194.08
|
Most Recent Note - 11/17/2010 3:07:38 PM
Y - Consolidating near all-time highs, yet just above support at its 50 DMA line. A subsequent breakout with heavy volume would signal a new (or add-on) technical buy signal, however it is a riskier "late stage" set-up.
>>> The latest Featured Stock Update with an annotated graph appeared on 10/1/2010. Click here.
View all notes |
Alert me of new notes |
CANSLIM.net Company Profile |
SEC |
Zacks Reports |
StockTalk |
News |
Chart |
Request a new note
C
A N
S L
I M
|
NTAP
-
NASDAQ
Netapp Inc
COMPUTER HARDWARE - Data Storage Devices
|
$53.12
|
+3.87
7.86% |
$53.57
|
19,543,698
272.98% of 50 DAV
50 DAV is 7,159,500
|
$57.96
-8.35%
|
9/8/2010
|
$46.98
|
PP = $44.99
|
|
MB = $47.24
|
Most Recent Note - 11/18/2010 3:47:07 PM
G - Gapped up today, and its considerable gain with heavy volume is a sign of prompt institutional support arriving that helps its outlook. It quickly repaired violations of its 50 DMA line and prior highs after triggering technical sell signals with a damaging loss.
>>> The latest Featured Stock Update with an annotated graph appeared on 11/3/2010. Click here.
View all notes |
Alert me of new notes |
CANSLIM.net Company Profile |
SEC |
Zacks Reports |
StockTalk |
News |
Chart |
Request a new note
C
A N
S L
I M
|
Symbol/Exchange
Company Name
Industry Group |
PRICE |
CHANGE
(%Change) |
Day High |
Volume
(% DAV)
(% 50 day avg vol) |
52 Wk Hi
% From Hi |
Featured
Date |
Price
Featured |
Pivot Featured |
|
Max Buy |
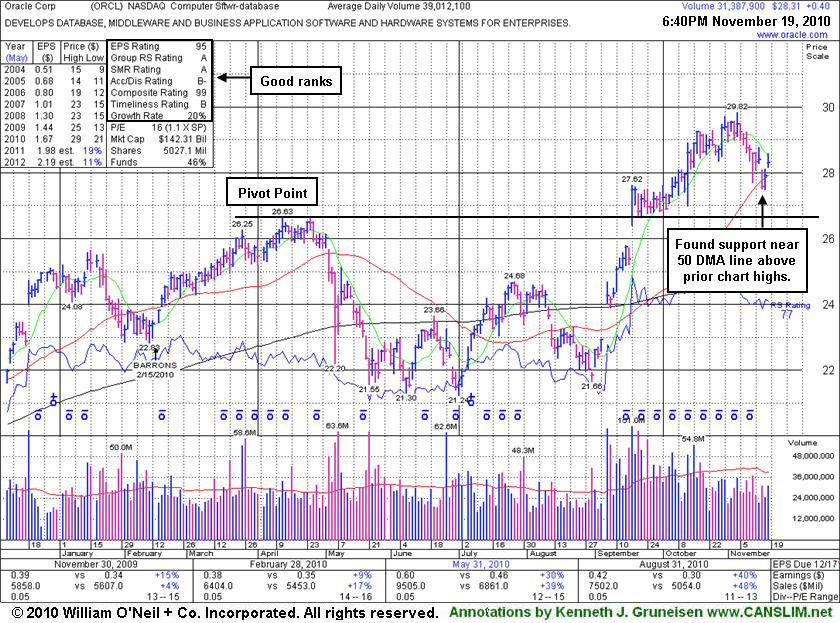
ORCL
-
NASDAQ
Oracle Corp
COMPUTER SOFTWARE and SERVICES - Application Software
|
$28.31
|
+0.40
1.43% |
$28.60
|
32,672,098
82.48% of 50 DAV
50 DAV is 39,613,400
|
$29.82
-5.06%
|
9/20/2010
|
$27.32
|
PP = $26.73
|
|
MB = $28.07
|
Most Recent Note - 11/17/2010 3:10:21 PM
Y - Small gain today, trading back above its 50 DMA line. Recent weakness raised concerns even while the volume totals were below average. More damaging losses below its latest chart lows near $27.50 would raise greater concerns.
>>> The latest Featured Stock Update with an annotated graph appeared on 11/18/2010. Click here.
View all notes |
Alert me of new notes |
CANSLIM.net Company Profile |
SEC |
Zacks Reports |
StockTalk |
News |
Chart |
Request a new note
C
A N
S L
I M
|
PAY
-
NYSE
Verifone Systems Inc
COMPUTER HARDWARE - Transaction Automation Systems
|
$33.51
|
+0.60
1.82% |
$33.65
|
2,026,794
161.14% of 50 DAV
50 DAV is 1,257,800
|
$35.94
-6.76%
|
8/25/2010
|
$24.30
|
PP = $23.74
|
|
MB = $24.93
|
Most Recent Note - 11/18/2010 5:47:03 PM
G - Posted a second gain today with above average volume, rallying after news it will acquire Hypercom Corp (HYC) for $7.32 in an all-stock deal. Perched above prior highs ($31.40) and its 50 DMA line while consolidating. It has the look of an advanced "ascending base" pattern after an impressive rally from its 7/26/10 breakout.
>>> The latest Featured Stock Update with an annotated graph appeared on 10/25/2010. Click here.
View all notes |
Alert me of new notes |
CANSLIM.net Company Profile |
SEC |
Zacks Reports |
StockTalk |
News |
Chart |
Request a new note
C
A N
S L
I M
|
RAX
-
NYSE
Rackspace Hosting Inc
INTERNET - Internet Software and; Services
|
$27.00
|
+0.27
1.01% |
$27.45
|
1,089,736
40.07% of 50 DAV
50 DAV is 2,719,700
|
$29.35
-8.01%
|
9/21/2010
|
$22.84
|
PP = $23.61
|
|
MB = $24.79
|
Most Recent Note - 11/18/2010 5:17:40 PM
G - Gains have been backed by light volume after its slump near prior highs that define initial chart support above its 50 DMA line. This high-ranked Internet - Network Solutions firm is -8% from last week's all-time highs.
>>> The latest Featured Stock Update with an annotated graph appeared on 11/17/2010. Click here.
View all notes |
Alert me of new notes |
CANSLIM.net Company Profile |
SEC |
Zacks Reports |
StockTalk |
News |
Chart |
Request a new note
C
A N
S L
I M
|
ROVI
-
NASDAQ
Rovi Corp
COMPUTER SOFTWARE andamp; SERVICES - Security Software andamp; Services
|
$53.42
|
+0.06
0.11% |
$54.75
|
1,179,966
73.74% of 50 DAV
50 DAV is 1,600,200
|
$54.07
-1.20%
|
10/29/2010
|
$49.99
|
PP = $53.10
|
|
MB = $55.76
|
Most Recent Note - 11/18/2010 4:58:33 PM
Y - Hit a new 2010 high today but closed near the session low with a negligible gain. Recently wedging to new highs without great volume conviction. Its 50 DMA line defines important support to watch.
>>> The latest Featured Stock Update with an annotated graph appeared on 10/20/2010. Click here.
View all notes |
Alert me of new notes |
CANSLIM.net Company Profile |
SEC |
Zacks Reports |
StockTalk |
News |
Chart |
Request a new note
C
A N
S L
I M
|
SHOO
-
NASDAQ
Steven Madden Limited
CONSUMER NON-DURABLES - Textile - Apparel Footwear
|
$42.39
|
+0.74
1.78% |
$42.74
|
217,212
62.62% of 50 DAV
50 DAV is 346,900
|
$44.85
-5.48%
|
9/15/2010
|
$38.94
|
PP = $40.27
|
|
MB = $42.28
|
Most Recent Note - 11/17/2010 3:16:02 PM
G - Gain today on light volume, still finding support above its 50 DMA line and prior chart highs in the $40 area. It may be forming a "double bottom" type base, but it is currently short of the minimum 8-weeks length of a proper double bottom pattern. More damaging losses leading to a close below its short-term average would raise concerns and trigger technical sell signals.
>>> The latest Featured Stock Update with an annotated graph appeared on 9/29/2010. Click here.
View all notes |
Alert me of new notes |
CANSLIM.net Company Profile |
SEC |
Zacks Reports |
StockTalk |
News |
Chart |
Request a new note
C
A N
S L
I M
|
Symbol/Exchange
Company Name
Industry Group |
PRICE |
CHANGE
(%Change) |
Day High |
Volume
(% DAV)
(% 50 day avg vol) |
52 Wk Hi
% From Hi |
Featured
Date |
Price
Featured |
Pivot Featured |
|
Max Buy |
SLW
-
NYSE
Silver Wheaton Corp
METALS and; MINING - Silver
|
$34.06
|
+1.24
3.78% |
$34.82
|
11,482,782
127.36% of 50 DAV
50 DAV is 9,015,800
|
$37.20
-8.44%
|
8/25/2010
|
$21.40
|
PP = $21.99
|
|
MB = $23.09
|
Most Recent Note - 11/18/2010 3:49:17 PM
G - Gapped up today, rebounding impressively after few heavy distribution days. Recently noted - "Very extended from any sound base, it has been sputtering since its worrisome negative reversal on 11/09/10. Its 50 DMA line and prior highs in the $28 area define the nearest chart support."
>>> The latest Featured Stock Update with an annotated graph appeared on 10/18/2010. Click here.
View all notes |
Alert me of new notes |
CANSLIM.net Company Profile |
SEC |
Zacks Reports |
StockTalk |
News |
Chart |
Request a new note
C
A N
S L
I M
|
UA
-
NYSE
Under Armour Inc Cl A
CONSUMER NON-DURABLES - Textile - Apparel Clothing
|
$51.96
|
+1.05
2.06% |
$52.42
|
607,181
79.31% of 50 DAV
50 DAV is 765,600
|
$52.30
-0.65%
|
9/9/2010
|
$39.99
|
PP = $40.10
|
|
MB = $42.11
|
Most Recent Note - 11/18/2010 5:14:07 PM
G - Extended from any sound base and support at its 50 DMA line, it closed a penny below its best close of 2010 today. It has not encountered any distributional pressure and could produce more climactic gains, however fundamental flaws with respect to the fact-based investment system have been recently noted as concerns.
>>> The latest Featured Stock Update with an annotated graph appeared on 11/4/2010. Click here.
View all notes |
Alert me of new notes |
CANSLIM.net Company Profile |
SEC |
Zacks Reports |
StockTalk |
News |
Chart |
Request a new note
C
A N
S L
I M
|
ULTA
-
NASDAQ
Ulta Salon Cosm & Frag
SPECIALTY RETAIL - Specialty Retail, Other
|
$31.97
|
+0.47
1.49% |
$32.68
|
200,172
41.60% of 50 DAV
50 DAV is 481,200
|
$33.50
-4.57%
|
9/3/2010
|
$26.36
|
PP = $25.89
|
|
MB = $27.18
|
Most Recent Note - 11/18/2010 5:05:50 PM
G - Small gain today with light volume halted a 5 session streak of small losses. Volume totals have been continually drying up since its big gain on 10/12/10. It is within close striking distance of its all-time high of $35.63 in Nov '07. Its 50 DMA line defines initial support to watch.
>>> The latest Featured Stock Update with an annotated graph appeared on 11/1/2010. Click here.
View all notes |
Alert me of new notes |
CANSLIM.net Company Profile |
SEC |
Zacks Reports |
StockTalk |
News |
Chart |
Request a new note
C
A N
S L
I M
|
VIT
-
NYSE
Vanceinfo Tech Inc Ads
COMPUTER SOFTWARE and SERVICES - Business Software and Services
|
$35.75
|
+1.25
3.62% |
$36.28
|
723,261
117.62% of 50 DAV
50 DAV is 614,900
|
$38.43
-6.97%
|
7/8/2010
|
$25.20
|
PP = $26.58
|
|
MB = $27.91
|
Most Recent Note - 11/18/2010 5:00:09 PM
G - Up today following a positive reversal on the prior session after a brief violation of its 50 DMA line that defines important chart support to watch.
>>> The latest Featured Stock Update with an annotated graph appeared on 10/21/2010. Click here.
View all notes |
Alert me of new notes |
CANSLIM.net Company Profile |
SEC |
Zacks Reports |
StockTalk |
News |
Chart |
Request a new note
C
A N
S L
I M
|