You are not logged in.
This means you
CAN ONLY VIEW reports that were published prior to Wednesday, April 2, 2025.
You
MUST UPGRADE YOUR MEMBERSHIP if you want to see any current reports.
AFTER MARKET UPDATE - THURSDAY, NOVEMBER 17TH, 2011
Previous After Market Report Next After Market Report >>>
|
|
|
|
DOW |
-134.86 |
11,770.73 |
-1.13% |
|
Volume |
1,024,668,760 |
+11% |
|
Volume |
2,148,749,530 |
+13% |
|
NASDAQ |
-51.62 |
2,587.99 |
-1.96% |
|
Advancers |
558 |
18% |
|
Advancers |
708 |
27% |
|
S&P 500 |
-20.78 |
1,216.13 |
-1.68% |
|
Decliners |
2,457 |
79% |
|
Decliners |
1,791 |
68% |
|
Russell 2000 |
-11.11 |
718.75 |
-1.52% |
|
52 Wk Highs |
21 |
|
|
52 Wk Highs |
17 |
|
|
S&P 600 |
-5.10 |
398.63 |
-1.26% |
|
52 Wk Lows |
61 |
|
|
52 Wk Lows |
101 |
|
|
 |
Major Averages Fall With Increasing Volume
Kenneth J. Gruneisen - Passed the CAN SLIM® Master's Exam
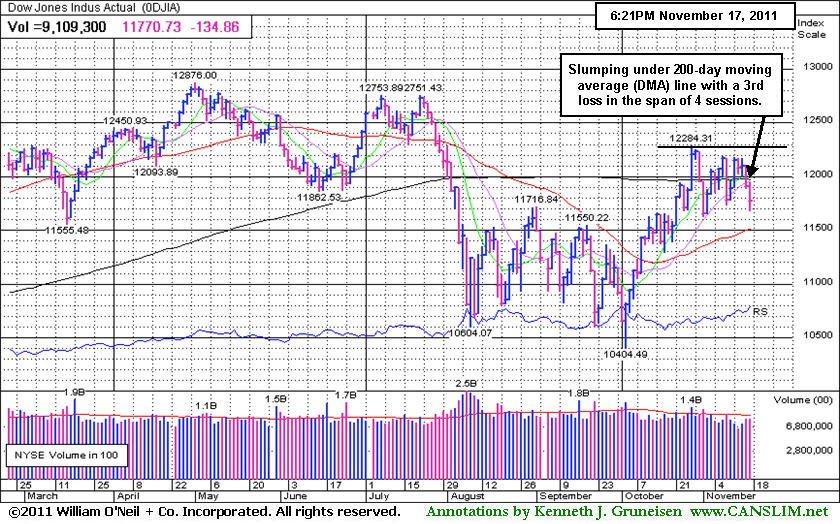
The major averages finished Thursday's session in negative territory, and higher volume totals were reported on both major exchanges indicating more distributional pressure or selling from the institutional crowd. Declining issues outnumbered advancing issues by more than 4-1 on the NYSE and by 5-2 on the Nasdaq exchange. New 52-week lows outnumbered new 52-week highs on the Nasdaq exchange and on the NYSE. There were only 4 high-ranked companies from the CANSLIM.net Leaders List that made new 52-week highs and appeared on the CANSLIM.net BreakOuts Page, down from the prior session total of 29 stocks. There were losses for all of the 18 high-ranked companies currently included on the Featured Stocks Page.
Action was once again driven by euro zone concerns. Markets lost ground early on as Spanish bonds sank, driving 10-year yields to the highest level since 1999. Equities extended their decline as Reuters reported a euro-area official said there are no plans for Italian aid from Europe's bailout fund.
Deficit reduction talks added to the sell-off. Republicans and Democrats on the Super Committee hardened positions with less than a week until the November 23rd deadline. Encouraging economic reports were not enough to improve sentiment. Weekly jobless claims fell 5,000, hitting a seven-month low. October housing starts fell less than expected and mortgage delinquencies dropped below 8%. On the downside, the November Philly Fed Index displayed slowing regional growth in November.
All sectors were down, led by technology and materials. Earnings results were mixed. NetApp Inc (NTAP -12.30%) fell after missing sales expectations and lowering its outlook. Dollar Tree Inc (DLTR +0.29%) edged higher after posting a better than expected profit. Sears Holdings (SHLD -4.55%) fell after a quarterly loss that nearly doubled. Gap (GPS -1.19%) and Marvell Technology Group Ltd (MRVL -4.55%) posted earnings after the bell.
Our monthly newsletter CANSLIM.net News will be published soon with an informative review of current market conditions, leading groups, and best buy candidates. Via the Premium Member Homepage links to all prior reports and webcasts are always available.
PICTURED: The Dow Jones Industrial Average slumped further below its 200-day moving average (DMA) line with a 3rd loss in 4 sessions.
|
 Kenneth J. Gruneisen started out as a licensed stockbroker in August 1987, a couple of months prior to the historic stock market crash that took the Dow Jones Industrial Average down -22.6% in a single day. He has published daily fact-based fundamental and technical analysis on high-ranked stocks online for two decades. Through FACTBASEDINVESTING.COM, Kenneth provides educational articles, news, market commentary, and other information regarding proven investment systems that work in good times and bad.
Comments contained in the body of this report are technical opinions only and are not necessarily those of Gruneisen Growth Corp. The material herein has been obtained from sources believed to be reliable and accurate, however, its accuracy and completeness cannot be guaranteed. Our firm, employees, and customers may effect transactions, including transactions contrary to any recommendation herein, or have positions in the securities mentioned herein or options with respect thereto. Any recommendation contained in this report may not be suitable for all investors and it is not to be deemed an offer or solicitation on our part with respect to the purchase or sale of any securities. |
|
 |
Tech, Financial and Commodity-Linked Groups Led Widespread Losses
Kenneth J. Gruneisen - Passed the CAN SLIM® Master's Exam
The Semiconductor Index ($SOX -3.99%) led the tech sector lower while the Internet Index ($IIX -2.79%), Networking Index ($NWX -2.47%), and the Biotechnology Index ($BTK -1.24%) ended with unanimous losses. Financial shares also were a negative influence on the major averages as the Broker/Dealer Index ($XBD -2.25%) and the Bank Index ($BKX -1.87%) fell. Commodity-linked groups had a negative bias as the Gold & Silver Index ($XAU -3.61%), Oil Services Index ($OSX -3.16%), and Integrated Oil Index ($XOI -1.82%) slumped. Losses for the Retail Index ($RLX -1.80%) and the Healthcare Index ($HMO -0.49%) rounded out a widely negative session for most all industry groups.
Charts courtesy www.stockcharts.com
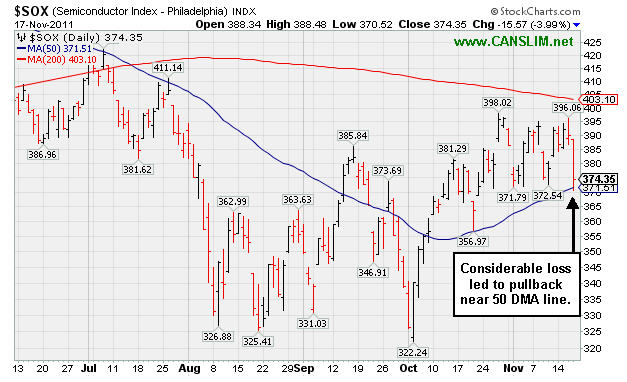
PICTURED: The Semiconductor Index ($SOX -3.99%) suffered a considerable loss today, slumping near its 50-day moving average (DMA) line.
| Oil Services |
$OSX |
228.33 |
-7.44 |
-3.16% |
-6.85% |
| Healthcare |
$HMO |
2,188.58 |
-10.76 |
-0.49% |
+29.35% |
| Integrated Oil |
$XOI |
1,192.40 |
-22.07 |
-1.82% |
-1.71% |
| Semiconductor |
$SOX |
374.35 |
-15.57 |
-3.99% |
-9.10% |
| Networking |
$NWX |
231.89 |
-5.87 |
-2.47% |
-17.35% |
| Internet |
$IIX |
287.19 |
-8.26 |
-2.79% |
-6.67% |
| Broker/Dealer |
$XBD |
79.50 |
-1.83 |
-2.25% |
-34.58% |
| Retail |
$RLX |
528.89 |
-9.71 |
-1.80% |
+4.03% |
| Gold & Silver |
$XAU |
197.79 |
-7.40 |
-3.61% |
-12.71% |
| Bank |
$BKX |
37.30 |
-0.71 |
-1.87% |
-28.56% |
| Biotech |
$BTK |
1,047.24 |
-13.10 |
-1.24% |
-19.30% |
|
|
|
 |
Slump Into Prior Base Raises Concerns While Testing 50-Day Average
Kenneth J. Gruneisen - Passed the CAN SLIM® Master's Exam
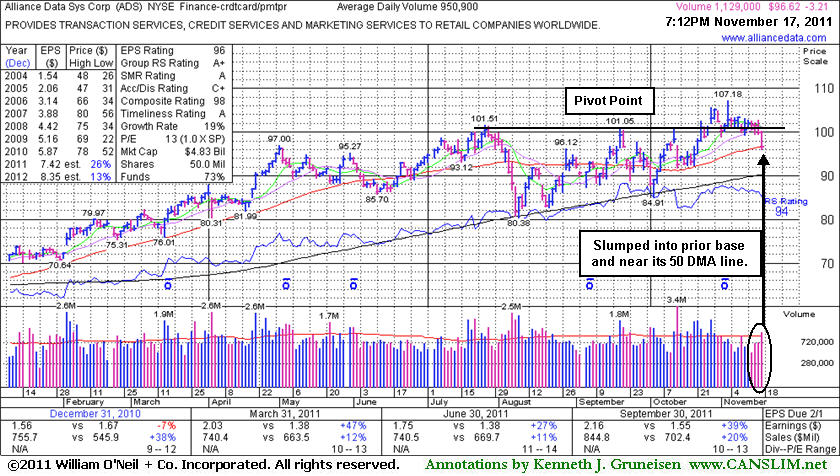
Alliance Data Systems Corporation (ADS -$3.21 or -3.22% to $96.62) suffered a damaging loss today that led to deterioration back into its prior base, raising concerns while slumping below its pivot point and prior chart highs in the $101 area. It finished the day testing near the previously noted support at its 50-day moving average (DMA) line. Its last appearance in this FSU section with an annotated graph was on 10/21/11 with an annotated graph under the headline, "Favorable Characteristics Following Years of Good Earnings Growth."
ADS was featured in yellow with a pivot point based on its 9/20/11 high plus 10 cents in the 10/21/11 mid-day report. It was on the rise, rallying within close range of its all-time high, and finished near the session high with a second consecutive volume-driven gain. It found support at its 200-day moving average (DMA) line again during the latest consolidation. Subsequent volume-driven gains above its pivot point may trigger a technical buy signal. As always, protect your capital buy selling if any stock falls 7-8% your purchase price.
Its last appearance in this FSU section with an annotated graph was way back on 1/23/07 with an annotated graph under the headline, "High Ranked Leader Perched Near Highs". It has maintained a good annual earnings (A criteria) history, even through challenging economic times in recent years which created flaws in the A criteria for many growth stocks. Its past 3 quarterly comparisons (Mar, Jun, and Sep '11) showed earnings per share increases greater than the +25% minimum guideline (C criteria). Current leadership from other companies in the Finance - Credit Card/Payment Processing group (L criteria) is a favorable characteristic. Ownership by top-rated funds also rose from 618 in Dec '10 to 755 in Sep '11, a reassuring sign concerning the I criteria.
 |
|
|
Color Codes Explained :
Y - Better candidates highlighted by our
staff of experts.
G - Previously featured
in past reports as yellow but may no longer be buyable under the
guidelines.
***Last / Change / Volume data in this table is the closing quote data***
Symbol/Exchange
Company Name
Industry Group |
PRICE |
CHANGE
(%Change) |
Day High |
Volume
(% DAV)
(% 50 day avg vol) |
52 Wk Hi
% From Hi |
Featured
Date |
Price
Featured |
Pivot Featured |
|
Max Buy |
AAPL
-
NASDAQ
Apple Inc
COMPUTER HARDWARE - Personal Computers
|
$377.41
|
-7.36
-1.91% |
$384.58
|
17,144,206
84.30% of 50 DAV
50 DAV is 20,337,600
|
$426.70
-11.55%
|
9/16/2011
|
$399.14
|
PP = $404.60
|
|
MB = $424.83
|
Most Recent Note - 11/16/2011 5:18:37 PM
G - Slumped to a close -9.8% off its 52-week high today. Gains in recent weeks lacked volume conviction while it has endured distributional pressure. Its 200 DMA line defines the next important chart support to watch.
>>> The latest Featured Stock Update with an annotated graph appeared on 11/16/2011. Click here.
View all notes |
Alert me of new notes |
CANSLIM.net Company Profile |
SEC |
Zacks Reports |
StockTalk |
News |
Chart |
Request a new note
C
A N
S L
I M


|
ADS
-
NYSE
Alliance Data Sys Corp
COMPUTER SOFTWARE and SERVICES - Information and Delivery Service
|
$96.62
|
-3.21
-3.22% |
$100.16
|
1,130,438
119.01% of 50 DAV
50 DAV is 949,900
|
$107.18
-9.85%
|
10/21/2011
|
$97.94
|
PP = $101.15
|
|
MB = $106.21
|
 Most Recent Note - 11/17/2011 6:05:00 PM
Y - Damaging loss today led to deterioration back into its prior base raising concerns while slumping below its pivot point and prior chart highs in the $101 area. Testing the previously noted support at its 50 DMA line.
>>> The latest Featured Stock Update with an annotated graph appeared on 11/17/2011. Click here.
View all notes |
Alert me of new notes |
CANSLIM.net Company Profile |
SEC |
Zacks Reports |
StockTalk |
News |
Chart |
Request a new note
C
A N
S L
I M
|
ALXN
-
NASDAQ
Alexion Pharmaceuticals
DRUGS - Drug Manufacturers - Other
|
$64.69
|
-1.48
-2.24% |
$66.71
|
1,210,565
79.57% of 50 DAV
50 DAV is 1,521,300
|
$70.42
-8.14%
|
9/15/2011
|
$63.20
|
PP = $60.81
|
|
MB = $63.85
|
Most Recent Note - 11/17/2011 6:11:14 PM
Y - Loss today on lighter volume, slumping to a close just below its 50 DMA line. Deterioration below recent chart lows ($67.72 on 11/10/11) would raise concerns and trigger technical sell signals. See latest FSU analysis for more details and a new annotated daily graph.
>>> The latest Featured Stock Update with an annotated graph appeared on 11/14/2011. Click here.
View all notes |
Alert me of new notes |
CANSLIM.net Company Profile |
SEC |
Zacks Reports |
StockTalk |
News |
Chart |
Request a new note
C
A N
S L
I M
|
CATM
-
NASDAQ
Cardtronics Inc
DIVERSIFIED SERVICES - Business/Management Services
|
$25.92
|
-0.31
-1.18% |
$26.81
|
292,662
69.40% of 50 DAV
50 DAV is 421,700
|
$28.46
-8.92%
|
11/8/2011
|
$25.99
|
PP = $25.95
|
|
MB = $27.25
|
Most Recent Note - 11/17/2011 6:12:23 PM
Y - Small loss today on light volume. Volume totals have been cooling while consolidating above prior highs in the $26 area which acted as support following its 11/08/11 breakout.
>>> The latest Featured Stock Update with an annotated graph appeared on 11/8/2011. Click here.
View all notes |
Alert me of new notes |
CANSLIM.net Company Profile |
SEC |
Zacks Reports |
StockTalk |
News |
Chart |
Request a new note
C
A N
S L
I M
|
CELG
-
NASDAQ
Celgene Corp
DRUGS - Drug Manufacturers - Major
|
$64.66
|
-0.21
-0.32% |
$65.30
|
4,160,027
108.29% of 50 DAV
50 DAV is 3,841,700
|
$68.25
-5.26%
|
9/16/2011
|
$61.21
|
PP = $62.59
|
|
MB = $65.72
|
Most Recent Note - 11/17/2011 6:14:44 PM
Y -Finished in the upper third of its intra-day range today, consolidating near its 50 DMA line defining important near-term chart support. Deterioration leading to a subsequent close below its short-term average and recent chart low ($62.71 on 11/01/11) would raise greater concerns and trigger technical sell signals.
>>> The latest Featured Stock Update with an annotated graph appeared on 11/7/2011. Click here.
View all notes |
Alert me of new notes |
CANSLIM.net Company Profile |
SEC |
Zacks Reports |
StockTalk |
News |
Chart |
Request a new note
C
A N
S L
I M
|
Symbol/Exchange
Company Name
Industry Group |
PRICE |
CHANGE
(%Change) |
Day High |
Volume
(% DAV)
(% 50 day avg vol) |
52 Wk Hi
% From Hi |
Featured
Date |
Price
Featured |
Pivot Featured |
|
Max Buy |
CEVA
-
NASDAQ
Ceva Inc
ELECTRONICS - Semiconductor - Specialized
|
$30.51
|
-0.08
-0.26% |
$30.96
|
237,678
100.58% of 50 DAV
50 DAV is 236,300
|
$35.60
-14.30%
|
10/28/2011
|
$34.38
|
PP = $35.70
|
|
MB = $37.49
|
Most Recent Note - 11/17/2011 6:15:40 PM
Y - Still consolidating above prior highs since its gap up on 10/27/11 helped it break out of a "double bottom" base pattern. In the 10/28/11 mid-day report (read here) it was featured again in yellow with pivot point based on its 52-week high plus 10 cents while rallying from a larger cup shaped base. It has encountered distributional pressure since, while volume-driven gains above its pivot point are needed to trigger a new (or add-on) technical buy signal.
>>> The latest Featured Stock Update with an annotated graph appeared on 11/2/2011. Click here.
View all notes |
Alert me of new notes |
CANSLIM.net Company Profile |
SEC |
Zacks Reports |
StockTalk |
News |
Chart |
Request a new note
C
A N
S L
I M
|
FEIC
-
NASDAQ
F E I Co
ELECTRONICS - Diversified Electronics
|
$38.60
|
-1.19
-2.99% |
$39.97
|
259,138
59.31% of 50 DAV
50 DAV is 436,900
|
$42.25
-8.64%
|
10/28/2011
|
$40.31
|
PP = $40.88
|
|
MB = $42.92
|
Most Recent Note - 11/17/2011 6:17:13 PM
Y - Pulled back today on lighter volume and slumped further below its pivot point, finishing -8.6% off its 52-week high. Disciplined investors limit losses if a stock falls more than -7% from their purchase price.
>>> The latest Featured Stock Update with an annotated graph appeared on 10/28/2011. Click here.
View all notes |
Alert me of new notes |
CANSLIM.net Company Profile |
SEC |
Zacks Reports |
StockTalk |
News |
Chart |
Request a new note
C
A N
S L
I M
|
GNC
-
NYSE
G N C Holdings Inc
RETAIL - Drug Stores
|
$26.72
|
-0.38
-1.40% |
$27.33
|
998,783
77.77% of 50 DAV
50 DAV is 1,284,300
|
$27.99
-4.54%
|
10/26/2011
|
$24.60
|
PP = $24.80
|
|
MB = $26.04
|
Most Recent Note - 11/17/2011 6:18:35 PM
G - Small loss today on lighter volume following a negative reversal for a loss on more than 2 times average volume on 11/16/11 after touching a new all-time high. Completed a Secondary Offering on 10/15/11. Recent chart lows (near $23.80) define near term support to watch above its 50 DMA line.
>>> The latest Featured Stock Update with an annotated graph appeared on 10/26/2011. Click here.
View all notes |
Alert me of new notes |
CANSLIM.net Company Profile |
SEC |
Zacks Reports |
StockTalk |
News |
Chart |
Request a new note
C
A N
S L
I M
|
HMSY
-
NASDAQ
H M S Holdings Corp
COMPUTER SOFTWARE and SERVICES - Healthcare Information Service
|
$28.81
|
-0.30
-1.03% |
$29.30
|
725,526
106.92% of 50 DAV
50 DAV is 678,600
|
$31.99
-9.94%
|
10/27/2011
|
$26.44
|
PP = $28.37
|
|
MB = $29.79
|
Most Recent Note - 11/17/2011 6:20:04 PM
G - Today was its 4th consecutive small loss on near average volume following a negative reversal on 11/14/11 after hitting a new all-time high. Prior highs in the $27-28 area define support to watch on pullbacks.
>>> The latest Featured Stock Update with an annotated graph appeared on 11/4/2011. Click here.
View all notes |
Alert me of new notes |
CANSLIM.net Company Profile |
SEC |
Zacks Reports |
StockTalk |
News |
Chart |
Request a new note
C
A N
S L
I M
|
ISRG
-
NASDAQ
Intuitive Surgical Inc
HEALTH SERVICES - Medical Appliances and Equipment
|
$428.89
|
-9.57
-2.18% |
$441.81
|
369,506
89.53% of 50 DAV
50 DAV is 412,700
|
$449.06
-4.49%
|
10/19/2011
|
$424.69
|
PP = $415.29
|
|
MB = $436.05
|
Most Recent Note - 11/17/2011 6:23:42 PM
G - Today's 2nd consecutive loss came with near average volume following 4 consecutive gains on lighter than average volume. Volume totals have been cooling in recent weeks while holding its ground and rising. See the latest FSU analysis for more details and a new annotated weekly graph.
>>> The latest Featured Stock Update with an annotated graph appeared on 11/15/2011. Click here.
View all notes |
Alert me of new notes |
CANSLIM.net Company Profile |
SEC |
Zacks Reports |
StockTalk |
News |
Chart |
Request a new note
C
A N
S L
I M
|
Symbol/Exchange
Company Name
Industry Group |
PRICE |
CHANGE
(%Change) |
Day High |
Volume
(% DAV)
(% 50 day avg vol) |
52 Wk Hi
% From Hi |
Featured
Date |
Price
Featured |
Pivot Featured |
|
Max Buy |
MG
-
NYSE
Mistras Group Inc
DIVERSIFIED SERVICES - Bulding and Faci;ity Management Services
|
$22.21
|
-0.29
-1.29% |
$22.64
|
109,887
53.06% of 50 DAV
50 DAV is 207,100
|
$23.51
-5.53%
|
10/28/2011
|
$22.49
|
PP = $23.61
|
|
MB = $24.79
|
Most Recent Note - 11/17/2011 6:25:06 PM
Y - Second consecutive small loss today on light volume following a solid gain on 11/15/11 backed by above average volume. Still perched within striking distance of all-time high. Its 50 DMA line and prior highs define chart support near $21.
>>> The latest Featured Stock Update with an annotated graph appeared on 11/11/2011. Click here.
View all notes |
Alert me of new notes |
CANSLIM.net Company Profile |
SEC |
Zacks Reports |
StockTalk |
News |
Chart |
Request a new note
C
A N
S L
I M
|
MKTX
-
NASDAQ
Marketaxess Holdings Inc
FINANCIAL SERVICES - Investment Brokerage - Nationa
|
$27.02
|
-0.75
-2.70% |
$28.58
|
190,572
78.72% of 50 DAV
50 DAV is 242,100
|
$31.45
-14.09%
|
10/28/2011
|
$29.79
|
PP = $31.05
|
|
MB = $32.60
|
Most Recent Note - 11/17/2011 6:30:45 PM
G - Sank below its 50 DMA line raising concerns and its color code is changed to green. Prior lows and its 200 DMA line in the $24-25 area define the next support area to watch.
>>> The latest Featured Stock Update with an annotated graph appeared on 10/31/2011. Click here.
View all notes |
Alert me of new notes |
CANSLIM.net Company Profile |
SEC |
Zacks Reports |
StockTalk |
News |
Chart |
Request a new note
C
A N
S L
I M
|
OSIS
-
NASDAQ
O S I Systems Inc
ELECTRONICS - Semiconductor Equipment and Mate
|
$44.17
|
-0.21
-0.47% |
$46.43
|
152,861
103.01% of 50 DAV
50 DAV is 148,400
|
$47.39
-6.80%
|
11/1/2011
|
$42.07
|
PP = $45.57
|
|
MB = $47.85
|
Most Recent Note - 11/17/2011 6:54:09 PM
Y - Finished in the upper third of its intra-day range today after sputtering below its pivot point. Previously noted - "Lighter than average behind last week's gains, not indicative of great institutional (I criteria) buying demand. Volume-driven gains above its pivot point may trigger a technical buy signal."
>>> The latest Featured Stock Update with an annotated graph appeared on 11/1/2011. Click here.
View all notes |
Alert me of new notes |
CANSLIM.net Company Profile |
SEC |
Zacks Reports |
StockTalk |
News |
Chart |
Request a new note
C
A N
S L
I M
|
RAX
-
NYSE
Rackspace Hosting Inc
INTERNET - Internet Software and; Services
|
$41.93
|
-0.74
-1.73% |
$43.60
|
1,260,221
79.23% of 50 DAV
50 DAV is 1,590,600
|
$46.50
-9.82%
|
11/8/2011
|
$44.28
|
PP = $46.27
|
|
MB = $48.58
|
Most Recent Note - 11/17/2011 6:58:54 PM
Y - Consolidating -9.8% off its 52-week high today, forming an ideal downward sloping handle with light volume totals following a 19-week cup shaped base pattern. Volume driven gains above its pivot point may trigger a technical buy signal.
>>> The latest Featured Stock Update with an annotated graph appeared on 11/10/2011. Click here.
View all notes |
Alert me of new notes |
CANSLIM.net Company Profile |
SEC |
Zacks Reports |
StockTalk |
News |
Chart |
Request a new note
C
A N
S L
I M
|
SWI
-
NYSE
Solarwinds Inc
COMPUTER SOFTWARE and SERVICES - Application Software
|
$30.91
|
-0.40
-1.28% |
$31.69
|
786,245
67.07% of 50 DAV
50 DAV is 1,172,200
|
$31.69
-2.46%
|
10/27/2011
|
$27.78
|
PP = $25.62
|
|
MB = $26.90
|
Most Recent Note - 11/17/2011 7:02:02 PM
G - Hovering near all-time highs today, holding its ground with volume quiet. It is extended from its previous base pattern. Prior highs in the $25-26 area define initial chart support to watch on pullbacks.
>>> The latest Featured Stock Update with an annotated graph appeared on 10/27/2011. Click here.
View all notes |
Alert me of new notes |
CANSLIM.net Company Profile |
SEC |
Zacks Reports |
StockTalk |
News |
Chart |
Request a new note
C
A N
S L
I M
|
Symbol/Exchange
Company Name
Industry Group |
PRICE |
CHANGE
(%Change) |
Day High |
Volume
(% DAV)
(% 50 day avg vol) |
52 Wk Hi
% From Hi |
Featured
Date |
Price
Featured |
Pivot Featured |
|
Max Buy |
TDG
-
NYSE
Transdigm Group Inc
AEROSPACE/DEFENSE - Aerospace/Defense Products and; Services
|
$93.57
|
-3.55
-3.66% |
$98.51
|
1,218,095
294.94% of 50 DAV
50 DAV is 413,000
|
$99.70
-6.15%
|
11/9/2011
|
$98.45
|
PP = $95.14
|
|
MB = $99.90
|
Most Recent Note - 11/17/2011 1:04:29 PM
Y - Negatively reversed after hitting a new 52-week high today. A volume-driven gain on 11/08/11 helped it break out from a 19-week base. Reported earnings +42% on +54% sales revenus for the quarter ended September 30, 2011.
>>> The latest Featured Stock Update with an annotated graph appeared on 11/9/2011. Click here.
View all notes |
Alert me of new notes |
CANSLIM.net Company Profile |
SEC |
Zacks Reports |
StockTalk |
News |
Chart |
Request a new note
C
A N
S L
I M
|
UA
-
NYSE
Under Armour Inc Cl A
CONSUMER NON-DURABLES - Textile - Apparel Clothing
|
$78.60
|
-2.25
-2.78% |
$83.42
|
1,195,741
90.01% of 50 DAV
50 DAV is 1,328,400
|
$87.40
-10.07%
|
10/25/2011
|
$82.43
|
PP = $80.80
|
|
MB = $84.84
|
Most Recent Note - 11/17/2011 7:06:04 PM
Y - Volume was higher but near average as it sank below prior highs near $80 previously noted as initial support. It closed below prior highs today, technically negating its recent breakout and raising concerns. It remains above its 50 DMA line.
>>> The latest Featured Stock Update with an annotated graph appeared on 11/3/2011. Click here.
View all notes |
Alert me of new notes |
CANSLIM.net Company Profile |
SEC |
Zacks Reports |
StockTalk |
News |
Chart |
Request a new note
C
A N
S L
I M
|
V
-
NYSE
Visa Inc Cl A
DIVERSIFIED SERVICES - Business/Management Services
|
$91.40
|
-2.00
-2.14% |
$95.00
|
4,307,267
81.19% of 50 DAV
50 DAV is 5,305,100
|
$95.87
-4.66%
|
10/24/2011
|
$94.21
|
PP = $94.85
|
|
MB = $99.59
|
Most Recent Note - 11/17/2011 7:08:02 PM
Y - Loss today led to a slump near its 50 DMA line previously noted as near-term chart support to watch. A violation of that important short-term average line would trigger more worrisome technical sell signals.
>>> The latest Featured Stock Update with an annotated graph appeared on 10/24/2011. Click here.
View all notes |
Alert me of new notes |
CANSLIM.net Company Profile |
SEC |
Zacks Reports |
StockTalk |
News |
Chart |
Request a new note
C
A N
S L
I M
|
|
|
|
THESE ARE NOT BUY RECOMMENDATIONS!
Comments contained in the body of this report are technical
opinions only. The material herein has been obtained
from sources believed to be reliable and accurate, however,
its accuracy and completeness cannot be guaranteed.
This site is not an investment advisor, hence it does
not endorse or recommend any securities or other investments.
Any recommendation contained in this report may not
be suitable for all investors and it is not to be deemed
an offer or solicitation on our part with respect to
the purchase or sale of any securities. All trademarks,
service marks and trade names appearing in this report
are the property of their respective owners, and are
likewise used for identification purposes only.
This report is a service available
only to active Paid Premium Members.
You may opt-out of receiving report notifications
at any time. Questions or comments may be submitted
by writing to Premium Membership Services 665 S.E. 10 Street, Suite 201 Deerfield Beach, FL 33441-5634 or by calling 1-800-965-8307
or 954-785-1121.
|
|
|

