You are not logged in.
This means you
CAN ONLY VIEW reports that were published prior to Tuesday, April 22, 2025.
You
MUST UPGRADE YOUR MEMBERSHIP if you want to see any current reports.
AFTER MARKET UPDATE - MONDAY, NOVEMBER 16TH, 2009
Previous After Market Report Next After Market Report >>>
|
|
|
|
DOW |
+136.49 |
10,406.96 |
+1.33% |
|
Volume |
1,145,347,400 |
+16% |
|
Volume |
2,153,925,990 |
+11% |
|
NASDAQ |
+29.97 |
2,197.85 |
+1.38% |
|
Advancers |
2,483 |
79% |
|
Advancers |
2,107 |
74% |
|
S&P 500 |
+15.82 |
1,109.30 |
+1.45% |
|
Decliners |
575 |
18% |
|
Decliners |
659 |
23% |
|
Russell 2000 |
+16.59 |
602.87 |
+2.83% |
|
52 Wk Highs |
318 |
|
|
52 Wk Highs |
160 |
|
|
S&P 600 |
+8.76 |
319.22 |
+2.82% |
|
52 Wk Lows |
1 |
|
|
52 Wk Lows |
16 |
|
|
 |
Averages' Rally on Higher Volume Indicates Accumulation
Adam Sarhan, Contributing Writer,
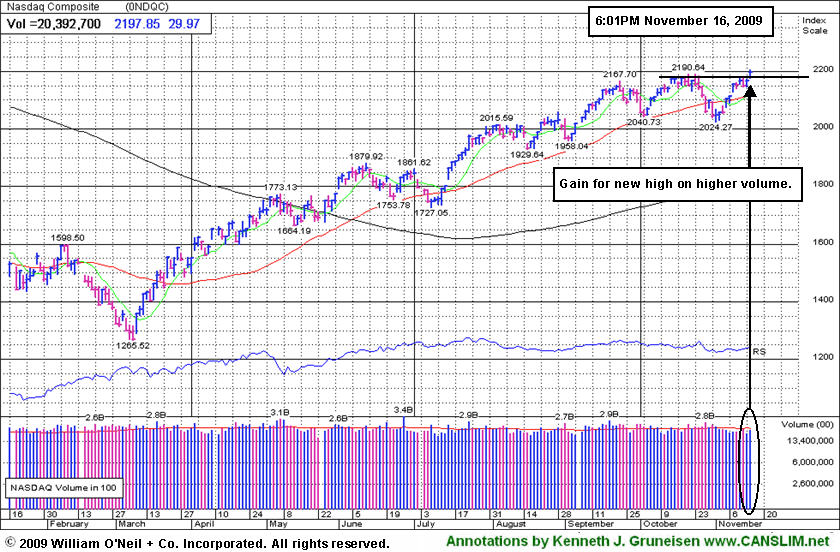
The major averages rallied smartly on Monday which sent the benchmark Standard & Poor’s 500 Index above resistance and to a fresh 2009 high! Volume, a critical component of institutional demand, was higher than Friday's levels on the Nasdaq exchange and the NYSE which signaled large institutions were accumulating stocks. Advancers trumped decliners by over a 4-to-1 ratio on the NYSE and by over a 3-to-1 ratio on the Nasdaq exchange. There were 61 high-ranked companies from the CANSLIM.net Leaders List making a new 52-week high and appearing on the CANSLIM.net BreakOuts Page, up from the 22 issues that appeared on the prior session. In terms of new leadership, it was encouraging to see new 52-week highs outnumber new 52-week lows on the NYSE and Nasdaq exchange.
Stocks rallied across the globe as the US dollar fell after Asian government's pledged to standby their economic stimulus packages. The 21-member Asia-Pacific Economic Cooperation group, which currently comprises over half of the global economy (approximately +54%), announced that they will maintain their massive economic stimulus packages well into 2010. The greenback fell to a fresh 15-month low which sent a host of dollar denominated assets higher: mainly stocks and commodities! The Dollar Index which measures how the dollar performs against six other currencies, fell to 74.820 and touched 74.679 which was the lowest level since August 2008. The Reuters/Jefferies CRB Index of 19 raw materials rose +2.9% which was its largest single day advance since August! The weaker dollar helped send gold to another record high which lifted a slew of gold stocks in its wake.
Turning to the economic front, the US government said retail sales grew +1.4% in October. A slew of retailers jumped on the news as investors bet the forthcoming holiday season will top estimates. Several of the country's largest credit card issuers rallied after reporting charge backs (i.e. bad loans) fell for a six straight month. American Express Co.( AXP +2.7%) jumped to a fresh 2009 high as volume swelled. This was another stronger-than-expected economic data point which suggests the economic recovery is in full force. Elsewhere, Federal Reserve Chairman Ben Bernanke gave a speech to the Economic Club in New York and said economic “headwinds” remain in the economy. He also said that, “Significant economic challenges remain" He went on to say, "The flow of credit remains constrained, economic activity weak and unemployment much too high. Future setbacks are possible.” He also noted that we are in a much better place in Q4 2009 then where we in the same period last year.
It is important to note that the S&P 500 Index has rebounded +64% from its 12-year low in March which is a very impressive feat! Turning to the market, high-quality leadership among small cap growth areas remains very thin.
PICTURED: The Nasdaq Composite Index rallied to a new 2009 high with better volume behind its gain.
|
|
|
 |
Commodity-Linked and Defensive Areas Lead Widespread Gains
Kenneth J. Gruneisen - Passed the CAN SLIM® Master's Exam
Commodity-linked areas were among Monday's best gainers as the Gold & Silver Index ($XAU +2.92%), Oil Services Index ($OSX +3.34%), and Integrated Oil Index ($XOI +1.68%) rose. The Healthcare Index ($HMO +1.94%) was also a solid gainer as defensive groups were among Monday's pace setters. Helping underpin the major averages' climb, the Retail Index ($RLX +1.10%) and financial group posted gains as the Broker/Dealer Index ($XBD +1.38%) and Bank Index ($BKX +1.09%) rallied. The Semiconductor Index ($SOX +1.99%), Networking Index ($NWX +1.40%), and Biotechnology Index ($BTK +1.30%) led the tech sector higher, meanwhile the Internet Index ($IIX +0.76%) posted a smaller gain.
Charts courtesy www.stockcharts.com
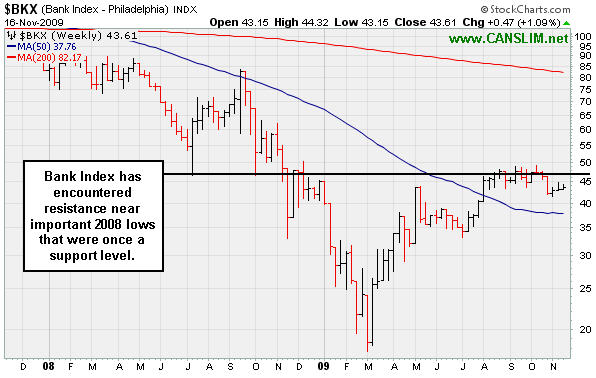
PICTURED: The Bank Index has encountered resistance near important 2008 lows that were once a support level.
| Oil Services |
$OSX |
203.80 |
+6.59 |
+3.34% |
+67.89% |
| Healthcare |
$HMO |
1,334.00 |
+25.41 |
+1.94% |
+38.93% |
| Integrated Oil |
$XOI |
1,103.38 |
+18.24 |
+1.68% |
+12.63% |
| Semiconductor |
$SOX |
323.83 |
+6.33 |
+1.99% |
+52.63% |
| Networking |
$NWX |
235.92 |
+3.25 |
+1.40% |
+63.96% |
| Internet |
$IIX |
228.08 |
+1.73 |
+0.76% |
+70.50% |
| Broker/Dealer |
$XBD |
119.33 |
+1.63 |
+1.38% |
+54.03% |
| Retail |
$RLX |
409.87 |
+4.46 |
+1.10% |
+46.77% |
| Gold & Silver |
$XAU |
186.27 |
+5.28 |
+2.92% |
+50.40% |
| Bank |
$BKX |
43.61 |
+0.47 |
+1.09% |
-1.60% |
| Biotech |
$BTK |
902.81 |
+11.57 |
+1.30% |
+39.50% |
|
|
|
 |
Consolidation Above 50 DMA Line Too Brief For New Flat Base
Kenneth J. Gruneisen - Passed the CAN SLIM® Master's Exam
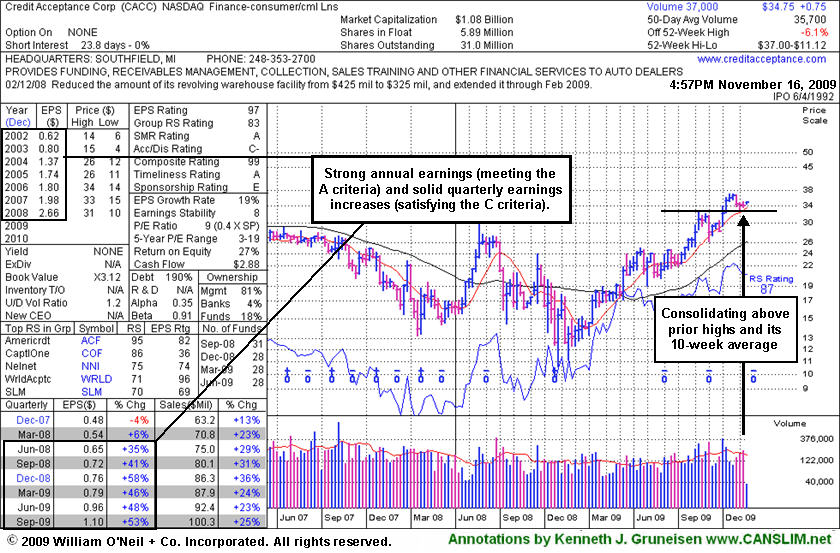
Credit Acceptance Corp (CACC +$0.75 or +2.21% to $34.75) opened the week with a small gap up gain today on average volume. It is continuing its consolidation in an orderly fashion above prior chart highs and its 50-day moving average (DMA) line in the $32 area. They coincide to define an important support level to watch on pullbacks. The Finance - Consumer/Commercial Loans firm has maintained a great track record of annual and quarterly sales revenues and earnings increases, satisfying the C and A criteria of the investment system. The high-ranked leader's 9/29/09 breakout gain was backed by more than 2 times average volume. Since featured it has also risen above its 2006-2007 highs ($33-34) to new all-time highs, which is a very reassuring sign of strength. CACC was featured in yellow in the 9/29/09 mid-day report (read here).
Investors might consider the current consolidation an opportunity to accumulate shares, however its recent price/volume action gives watchful investors an indication it is encountering some distributional pressure. Without chasing it more than +5% above prior chart highs, one might watch for a sound new base to form. It has been consolidating for 4 weeks since hitting a 2009 high of $37.00. In another week it might meet the definition of a new "flat base" which, at 5-weeks minimum, is technically the shortest of all basic chart patterns.
|
|
|
Color Codes Explained :
Y - Better candidates highlighted by our
staff of experts.
G - Previously featured
in past reports as yellow but may no longer be buyable under the
guidelines.
***Last / Change / Volume quote data in this table corresponds with the timestamp on the note***
Symbol/Exchange
Company Name
Industry Group |
Last |
Chg. |
Vol
% DAV |
Date Featured |
Price Featured |
Latest Pivot Point
Featured |
Status |
| Latest Max Buy Price |
ARST
-
|
$25.81
|
-0.19
|
495,644
75% DAV
660,700
|
9/1/2009
(Date
Featured) |
$19.91
(Price
Featured) |
PP = $20.90 |
G |
| MB = $21.95 |
Most Recent Note - 11/16/2009 4:48:02 PM
G - Negatively reversed today for a small loss on below average volume. Color code remains green while dismissing its 10/15/09 high as a new pivot point, with concern over its "late stage" action without a recent base of substantial length. ARST was first featured in yellow at $19.91 in the 9/01/09 mid-day report with an annotated daily graph (read here).
>>> The latest Featured Stock Update with an annotated graph appeared on 11/6/2009. click here.
|
|
C
A
S
I |
News |
Chart |
SEC
View all notes Alert
me of new notes
Company
Profile
|
ASIA
-
|
$25.73
|
+0.68
|
714,044
72% DAV
997,900
|
10/14/2009
(Date
Featured) |
$23.05
(Price
Featured) |
PP = $22.19 |
G |
| MB = $23.30 |
Most Recent Note - 11/16/2009 4:49:21 PM
G - Small gap up gain on light volume today for a new high close. It is extended from its latest sound base. Featured 10/14/09 in the mid-day report (read here) as it gapped up for a new 52-week high with 5 times average volume, triggering a technical buy signal by blasting above its pivot point. First featured in the August 2009 CANSLIM.net News (read here).
>>> The latest Featured Stock Update with an annotated graph appeared on 11/12/2009. click here.
|
|
C
A
S
I |
News |
Chart |
SEC
View all notes Alert
me of new notes
Company
Profile
|
BIDU
- NASDAQ
Baidu Inc Ads
INTERNET - Internet Information Providers
|
$438.32
|
+5.82
|
1,663,263
72% DAV
2,306,500
|
9/8/2009
(Date
Featured) |
$351.80
(Price
Featured) |
PP = $368.59 |
G |
| MB = $387.02 |
Most Recent Note - 11/16/2009 4:50:35 PM
G - Quiet volume today helped it rally to a new all-time high. Proved resilient near its 50 DMA line after its 10/27/09 gap down. As recently noted, "Choppy action has not allowed it to form a sound base in recent weeks." BIDU traded up as much as +23% from its price when featured in yellow in the 9/08/09 Mid-Day BreakOuts Report (read here).
>>> The latest Featured Stock Update with an annotated graph appeared on 11/10/2009. click here.
|
|
C
A
S
I |
News |
Chart |
SEC
View all notes Alert
me of new notes
Company
Profile
|
CACC
- NASDAQ
Credit Acceptance Corp
FINANCIAL SERVICES - Credit Services
|
$34.75
|
+0.75
|
37,813
106% DAV
35,700
|
9/29/2009
(Date
Featured) |
$33.48
(Price
Featured) |
PP = $32.60 |
G |
| MB = $34.23 |
Most Recent Note - 11/16/2009 4:52:31 PM
G - Small gap up gain today on average volume, Continuing its consolidation in an orderly fashion above prior chart highs and its 50 DMA line in the $32 area coinciding as an important support level to watch on pullbacks. The Finance - Consumer/Commercial Loans firm has maintained a great track record of annual and quarterly sales revenues and earnings increases. It was featured on 9/29/09 in yellow in the mid-day report (read here).
>>> The latest Featured Stock Update with an annotated graph appeared on 11/16/2009. click here.
|
|
C
A
S
I |
News |
Chart |
SEC
View all notes Alert
me of new notes
Company
Profile
|
CRM
- NYSE
Salesforce.com Inc
INTERNET - Internet Software & Services
|
$66.85
|
+0.72
|
2,366,605
141% DAV
1,674,700
|
8/16/2009
(Date
Featured) |
$47.12
(Price
Featured) |
PP = $45.59 |
G |
| MB = $47.87 |
Most Recent Note - 11/16/2009 4:53:27 PM
G - Second consecutive gain with above average volume today for a new 2009 high. It is extended from any sound base. Found support and rallied up from its 50 DMA line last week after noted technical deterioration raised some concerns. Recent chart lows in the $56 area are important support now, and any violation would raise more serious concerns and trigger more worrisome technical sell signals.
>>> The latest Featured Stock Update with an annotated graph appeared on 11/9/2009. click here.
|
|
C
A
S
I |
News |
Chart |
SEC
View all notes Alert
me of new notes
Company
Profile
|
GMCR
- NASDAQ
Green Mtn Coffee Roastrs
FOOD & BEVERAGE - Processed & Packaged Goods
|
$69.96
|
+1.50
|
1,609,450
121% DAV
1,325,900
|
10/5/2009
(Date
Featured) |
$71.11
(Price
Featured) |
PP = $75.89 |
G |
| MB = $79.68 |
Most Recent Note - 11/16/2009 4:55:19 PM
G - Small gain today on average volume helped it close just above its 50 DMA line. Holding its ground following a gap down on 11/12/09 after reporting strong quarterly results for the period ended Sept 30, 2009. As recently noted, "Its choppy action in recent weeks has not allowed for a sound new base to form." Deterioration under its recent lows near $65 would raise more serious concerns and trigger a worrisome technical sell signal.
>>> The latest Featured Stock Update with an annotated graph appeared on 11/11/2009. click here.
|
|
C
A
S
I |
News |
Chart |
SEC
View all notes Alert
me of new notes
Company
Profile
|
|
|
|
THESE ARE NOT BUY RECOMMENDATIONS!
Comments contained in the body of this report are technical
opinions only. The material herein has been obtained
from sources believed to be reliable and accurate, however,
its accuracy and completeness cannot be guaranteed.
This site is not an investment advisor, hence it does
not endorse or recommend any securities or other investments.
Any recommendation contained in this report may not
be suitable for all investors and it is not to be deemed
an offer or solicitation on our part with respect to
the purchase or sale of any securities. All trademarks,
service marks and trade names appearing in this report
are the property of their respective owners, and are
likewise used for identification purposes only.
This report is a service available
only to active Paid Premium Members.
You may opt-out of receiving report notifications
at any time. Questions or comments may be submitted
by writing to Premium Membership Services 665 S.E. 10 Street, Suite 201 Deerfield Beach, FL 33441-5634 or by calling 1-800-965-8307
or 954-785-1121.
|
|
|


