You are not logged in.
This means you
CAN ONLY VIEW reports that were published prior to Tuesday, March 11, 2025.
You
MUST UPGRADE YOUR MEMBERSHIP if you want to see any current reports.
AFTER MARKET UPDATE - FRIDAY, NOVEMBER 13TH, 2009
Previous After Market Report Next After Market Report >>>
|
|
|
|
DOW |
+73.00 |
10,270.47 |
+0.72% |
|
Volume |
985,041,940 |
-6% |
|
Volume |
1,944,577,840 |
-12% |
|
NASDAQ |
+18.86 |
2,167.88 |
+0.88% |
|
Advancers |
2,206 |
71% |
|
Advancers |
1,809 |
64% |
|
S&P 500 |
+6.24 |
1,093.48 |
+0.57% |
|
Decliners |
794 |
26% |
|
Decliners |
898 |
32% |
|
Russell 2000 |
+5.96 |
586.28 |
+1.03% |
|
52 Wk Highs |
97 |
|
|
52 Wk Highs |
51 |
|
|
S&P 600 |
+2.78 |
310.46 |
+0.90% |
|
52 Wk Lows |
2 |
|
|
52 Wk Lows |
36 |
|
|
 |
Confirmed New Rally Producing Very Few Actionable Buy Candidates
Adam Sarhan, Contributing Writer,
The major averages confirmed a new rally attempt and ended higher for the week as investors digested the latest round of earnings and economic data. Volume, a critical component of institutional demand, was lower on the Nasdaq exchange and the NYSE compared to Thursday's levels. Advancers trumped decliners by about a 3-to-1 ratio on the NYSE and by over a 2-to-1 ratio on the Nasdaq exchange. There were 22 high-ranked companies from the CANSLIM.net Leaders List making a new 52-week high and appearing on the CANSLIM.net BreakOuts Page, exactly the same as the 22 issues that appeared on the prior session. In terms of new leadership, it was encouraging to see new 52-week highs outnumber new 52-week lows on the NYSE and Nasdaq exchange.
On Monday, stocks scored a follow-through day (FTD) after the Group of 20 largest industrial nations agreed to maintain their economic stimulus package as the global economy continues to recover. It is important to note that this market remains very strong. On every rally since the initial lows in March 2009, each pullback has been less than -8% and the bulls have promptly showed up to quell the bearish pressure and send stocks higher. The latest correction began on October 28, 2009 and ended on November 9, 2009 when this rally-attempt was confirmed. To avoid any confusion, the official status of the market changed from "rally attempt" to "confirmed rally." Now that the market is back in a confirmed rally, growth investors have a green light for buying stocks when they trigger fresh technical buy signals and break out of sound bases. The stock market remains strong as long as the US dollar continues to fall and the global economic stimulus package continues.
On Tuesday, stocks ended mixed as investors digested the latest round of economic data. The National Association of Realtors said that home prices fell in 8 out of every 10 US cities last quarter. Sellers continue to lower prices to attract buyers which has caused the price of the average home to decline to $177,900 which is -11% below Q3 2008's levels. Distressed sales, a.k.a. deeply discounted sales, made up 30% of all deals according to their data. The good news in the report was that home sales continued to climb and two dozen cities saw home prices actually climb! Remember the ideal scenario for the real-estate market to recover will be higher home prices coupled with more sales.
On Wednesday, stocks rallied and sent the benchmark S&P 500 Index to a fresh 2009 high. China reported that its industrial production surged thanks in part to strong demand. This bodes well for the global economic recovery and helps allay concern that the 8-month rally in global equities is exaggerated. Elsewhere, the Fed signaled they do not plan on raising rates any time soon. This also removed a ton of pressure on those that subscribe to the notion that the stock market's 8-month advance was due to a massive government induced liquidity driven rally. The underlying notion is that banks are able to borrow money near record lows and then use that money however they may see fit.
On Thursday, the stock market and a slew of commodities sold off as the US dollar rallied. The US dollar rallied against 15 of 16 major currencies after the Federal Deficit soared to a new record of $176.4 billion in October. Stocks sold off after Hewlett-Packard (HPQ +0.42%) announced plans to acquire 3Com (COMS +0.67%). 3Com surged a whopping +31% on the news and enjoyed its single largest advance since 2007 on the $2.7 billion deal. This helped send a slew of computer networking stocks higher.
Stocks shook off negative news regarding consumer sentiment and ended higher on Friday. So far, over 80% of S&P 500 companies that reported Q3 results have topped estimates which has helped the market hold up rather well considering that profits were negative for a record ninth consecutive quarter. What does all this mean for growth investors? Be patient and continue to watch for leading stocks to breakout of sound bases. Do not force a trade and let the market come to you; i.e. do not chase. It is also important to remain cognizant of what is working in this environment: mainly very liquid large cap leaders as they bounce off their 50-day moving average line or breakout of sound bases. Some of those leaders include: Apple Computer (AAPL +1.22%), Amazon (AMZN +1.87%), Priceline.com (PCLN +2.42%), Google (GOOG -+0.74%), and Baidu Inc. (BIDU +1.25%). The action in these names have served as a great proxy for the overall rally which began in March 2009. Jesse Livermore's timeless advice is true once gain, "Follow The Leaders."
PICTURED: The Nasdaq Composite Index remains perched just below its 2009 high of 2,190.64.
Does Your "Expert" Portfolio Manager Have You Over-Diversified And Under-Performing?
In recent weeks we have heard from a number of investors who were frustrated to see their accounts over diversified and under performing at the hands of investment managers claiming to make their moves based on this fact-based system. To find out more about working directly with full service professionals doing it the right way, simply fill out this form and we will contact you to discuss a specific course of action that suits you best (CLICK HERE) *Accounts over $250,000 please, and serious inquiries only.
|
|
|
 |
Internet Index Rises to New 2009 High Close
Kenneth J. Gruneisen - Passed the CAN SLIM® Master's Exam
The Gold & Silver Index ($XAU +2.05%) was a standout gainer on Friday. Energy-related shares posted modest gains helping the Oil Services Index ($OSX +0.61%) and Integrated Oil Index ($XOI +0.81%) rise, and the Healthcare Index ($HMO +0.72%) was another defensive group on the rise. Gains from the Retail Index ($RLX +1.21%) and most tech groups also helped the major averages trade with a positive bias. The Semiconductor Index ($SOX +1.11%), Internet Index ($IIX +1.32%), and Networking Index ($NWX +1.48%) while the Biotechnology Index ($BTK -0.19%) closed with a slight loss. Financial shares were mixed and little changed as the Bank Index ($BKX -0.37%) edged lower and Broker/Dealer Index ($XBD +0.39%) ended slightly higher.
Charts courtesy www.stockcharts.com
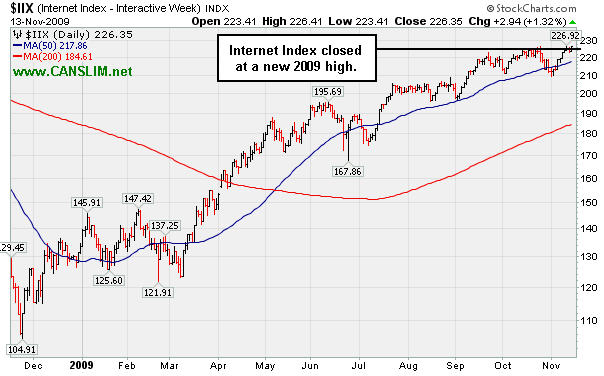
PICTURED: The Internet Index ($IIX +1.32%) closed at a new 2009 high.
| Oil Services |
$OSX |
197.21 |
+1.20 |
+0.61% |
+62.46% |
| Healthcare |
$HMO |
1,308.59 |
+9.39 |
+0.72% |
+36.29% |
| Integrated Oil |
$XOI |
1,085.14 |
+8.69 |
+0.81% |
+10.76% |
| Semiconductor |
$SOX |
317.50 |
+3.50 |
+1.11% |
+49.64% |
| Networking |
$NWX |
232.67 |
+3.40 |
+1.48% |
+61.70% |
| Internet |
$IIX |
226.35 |
+2.94 |
+1.32% |
+69.21% |
| Broker/Dealer |
$XBD |
117.70 |
+0.46 |
+0.39% |
+51.93% |
| Retail |
$RLX |
405.41 |
+4.83 |
+1.21% |
+45.17% |
| Gold & Silver |
$XAU |
180.99 |
+3.64 |
+2.05% |
+46.14% |
| Bank |
$BKX |
43.14 |
-0.16 |
-0.37% |
-2.66% |
| Biotech |
$BTK |
891.24 |
-1.71 |
-0.19% |
+37.71% |
|
|
|
 |
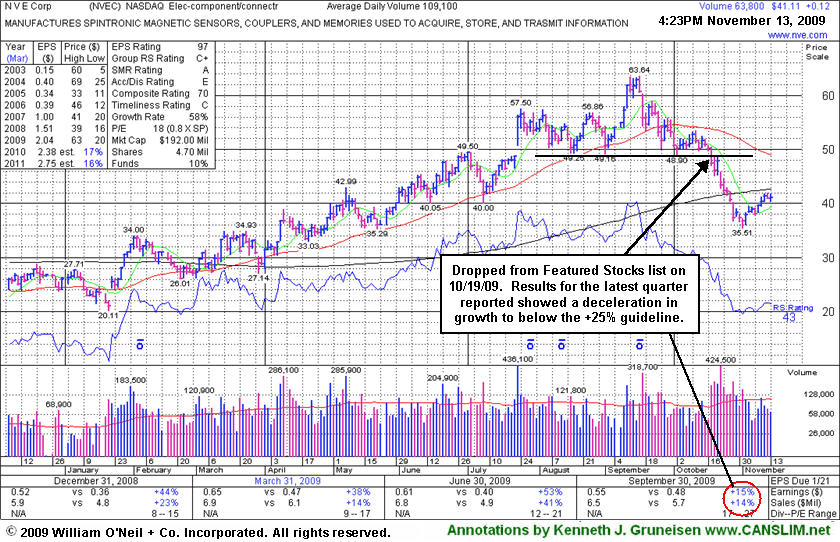
Technical Breakdown Followed By Weaker Fundamentals
Kenneth J. Gruneisen - Passed the CAN SLIM® Master's Exam
NVE Corp (NVEC +$0.12 or +0.29% to $41.11) is not currently included on the CANSLIM.net Featured Stocks list, however it could be constructive to look at it again for any lessons that can be learned. It was dropped on October 19th after triggering technical sell signals which were summarized with an annotated graph under the headline, "Weak Technical Action Is A Worrisome Sign". At that time we observed, "The weak technical action is a worrisome sign, even though NVEC still has maintained a good quarterly and annual earnings growth history (C & A criteria)." However, since that time you can see that the comparison for the quarter ended September 30, 2009 showed increases below the +25% guideline. This demonstrates how, as so often is the case, technical action in a stock is commonly followed by fundamental news that sheds light after the fact on the stock's behavior.
The high-ranked leader in the Electronics - Components/Connectors group had traded up as much as +88% after first being featured in yellow at $33.85 on 3/13/09 in the mid-day report (read here).
|
|
|
Color Codes Explained :
Y - Better candidates highlighted by our
staff of experts.
G - Previously featured
in past reports as yellow but may no longer be buyable under the
guidelines.
***Last / Change / Volume quote data in this table corresponds with the timestamp on the note***
Symbol/Exchange
Company Name
Industry Group |
Last |
Chg. |
Vol
% DAV |
Date Featured |
Price Featured |
Latest Pivot Point
Featured |
Status |
| Latest Max Buy Price |
ARST
-
|
$26.00
|
+0.23
|
290,879
42% DAV
695,100
|
9/1/2009
(Date
Featured) |
$19.91
(Price
Featured) |
PP = $20.90 |
G |
| MB = $21.95 |
Most Recent Note - 11/13/2009 5:18:19 PM
G - Positively reversed today. Color code remains green while dismissing its 10/15/09 high as a new pivot point, with concern over its "late stage" action without a recent base of substantial length. ARST was first featured in yellow at $19.91 in the 9/01/09 mid-day report with an annotated daily graph (read here).
>>> The latest Featured Stock Update with an annotated graph appeared on 11/6/2009. click here.
|
|
C
A
S
I |
News |
Chart |
SEC
View all notes Alert
me of new notes
Company
Profile
|
ASIA
-
|
$25.05
|
+0.94
|
1,106,981
116% DAV
953,500
|
10/14/2009
(Date
Featured) |
$23.05
(Price
Featured) |
PP = $22.19 |
G |
| MB = $23.30 |
Most Recent Note - 11/13/2009 5:21:04 PM
G - Positively reversed today. It is extended from its latest sound base. Featured 10/14/09 in the mid-day report (read here) as it gapped up for a new 52-week high with 5 times average volume, triggering a technical buy signal by blasting above its pivot point. First featured in the August 2009 CANSLIM.net News (read here).
>>> The latest Featured Stock Update with an annotated graph appeared on 11/12/2009. click here.
|
|
C
A
S
I |
News |
Chart |
SEC
View all notes Alert
me of new notes
Company
Profile
|
BIDU
- NASDAQ
Baidu Inc Ads
INTERNET - Internet Information Providers
|
$432.50
|
+5.35
|
1,222,235
53% DAV
2,312,300
|
9/8/2009
(Date
Featured) |
$351.80
(Price
Featured) |
PP = $368.59 |
G |
| MB = $387.02 |
Most Recent Note - 11/13/2009 5:23:09 PM
G - Quietly perched -2% from all-time highs. Proved resilient near its 50 DMA line after its 10/27/09 gap down. As recently noted, "Choppy action has not allowed it to form a sound base in recent weeks." BIDU traded up as much as +23% from its price when featured in yellow in the 9/08/09 Mid-Day BreakOuts Report (read here).
>>> The latest Featured Stock Update with an annotated graph appeared on 11/10/2009. click here.
|
|
C
A
S
I |
News |
Chart |
SEC
View all notes Alert
me of new notes
Company
Profile
|
CACC
- NASDAQ
Credit Acceptance Corp
FINANCIAL SERVICES - Credit Services
|
$34.00
|
-0.06
|
37,491
97% DAV
38,500
|
9/29/2009
(Date
Featured) |
$33.48
(Price
Featured) |
PP = $32.60 |
G |
| MB = $34.23 |
Most Recent Note - 11/13/2009 5:25:31 PM
G - Consolidating in an orderly fashion above prior chart highs and its 50 DMA line in the $32 area, coinciding as an important support level to watch on pullbacks. The Finance - Consumer/Commercial Loans firm has maintained a great track record of annual and quarterly sales revenues and earnings increases. It was featured on 9/29/09 in yellow in the mid-day report (read here).
>>> The latest Featured Stock Update with an annotated graph appeared on 11/5/2009. click here.
|
|
C
A
S
I |
News |
Chart |
SEC
View all notes Alert
me of new notes
Company
Profile
|
CRM
- NYSE
Salesforce.com Inc
INTERNET - Internet Software & Services
|
$66.13
|
+3.23
|
2,389,997
143% DAV
1,672,100
|
8/16/2009
(Date
Featured) |
$47.12
(Price
Featured) |
PP = $45.59 |
G |
| MB = $47.87 |
Most Recent Note - 11/13/2009 5:26:37 PM
G - Gap up gain with above average volume today for a new 2009 high. It is extended from any sound base. Found support and rallied up from its 50 DMA line last week after noted technical deterioration raised some concerns. Recent chart lows in the $56 area are important support now, and any violation would raise more serious concerns and trigger more worrisome technical sell signals.
>>> The latest Featured Stock Update with an annotated graph appeared on 11/9/2009. click here.
|
|
C
A
S
I |
News |
Chart |
SEC
View all notes Alert
me of new notes
Company
Profile
|
GMCR
- NASDAQ
Green Mtn Coffee Roastrs
FOOD & BEVERAGE - Processed & Packaged Goods
|
$68.46
|
+0.11
|
2,047,303
183% DAV
1,115,800
|
10/5/2009
(Date
Featured) |
$71.11
(Price
Featured) |
PP = $75.89 |
G |
| MB = $79.68 |
Most Recent Note - 11/13/2009 5:28:24 PM
G - Held its ground today following a gap down on 11/12/09 after reporting strong quarterly results for the period ended Sept 30, 2009, suffering a considerable loss on heavy volume, closing below its 50 DMA line. As recently noted, "Its choppy action in recent weeks has not allowed for a sound new base to form." Deterioration under its recent lows near $65 would raise more serious concerns and trigger a worrisome technical sell signal.
>>> The latest Featured Stock Update with an annotated graph appeared on 11/11/2009. click here.
|
|
C
A
S
I |
News |
Chart |
SEC
View all notes Alert
me of new notes
Company
Profile
|
|
|
|
THESE ARE NOT BUY RECOMMENDATIONS!
Comments contained in the body of this report are technical
opinions only. The material herein has been obtained
from sources believed to be reliable and accurate, however,
its accuracy and completeness cannot be guaranteed.
This site is not an investment advisor, hence it does
not endorse or recommend any securities or other investments.
Any recommendation contained in this report may not
be suitable for all investors and it is not to be deemed
an offer or solicitation on our part with respect to
the purchase or sale of any securities. All trademarks,
service marks and trade names appearing in this report
are the property of their respective owners, and are
likewise used for identification purposes only.
This report is a service available
only to active Paid Premium Members.
You may opt-out of receiving report notifications
at any time. Questions or comments may be submitted
by writing to Premium Membership Services 665 S.E. 10 Street, Suite 201 Deerfield Beach, FL 33441-5634 or by calling 1-800-965-8307
or 954-785-1121.
|
|
|


