You are not logged in.
This means you
CAN ONLY VIEW reports that were published prior to Monday, February 26, 2024.
You
MUST UPGRADE YOUR MEMBERSHIP if you want to see any current reports.
AFTER MARKET UPDATE - THURSDAY, NOVEMBER 15TH, 2018
Previous After Market Report Next After Market Report >>>
|
|
|
|
DOW |
+208.77 |
25,289.27 |
+0.83% |
|
Volume |
950,781,280 |
-5% |
|
Volume |
2,506,397,640 |
-1% |
|
NASDAQ |
+122.64 |
7,259.03 |
+1.72% |
|
Advancers |
1,713 |
57% |
|
Advancers |
2,083 |
67% |
|
S&P 500 |
+28.62 |
2,730.20 |
+1.06% |
|
Decliners |
1,289 |
43% |
|
Decliners |
1,009 |
33% |
|
Russell 2000 |
+21.62 |
1,524.12 |
+1.44% |
|
52 Wk Highs |
21 |
|
|
52 Wk Highs |
20 |
|
|
S&P 600 |
+12.39 |
958.54 |
+1.31% |
|
52 Wk Lows |
241 |
|
|
52 Wk Lows |
202 |
|
|
 |
Indices Overcame Weakness to Post Gains With Lighter Volume
Kenneth J. Gruneisen - Passed the CAN SLIM® Master's Exam
Stocks overcame early weakness to finish higher Thursday. The Dow added 208 points to 25,289 while the S&P 500 climbed 28 points higher to 2,730. The Nasdaq Composite advanced 122 points to 7,259. The volume totals reported were lighter on the NYSE and on the Nasdaq exchange versus the prior session, indicative of lackluster buying demand from the institutional crowd. Advancers led decliners by a 4-3 margin on the NYSE and 2-1 on the Nasdaq exchange. There were 11 high-ranked companies from the Leaders List that made new 52-week highs and were listed on the BreakOuts Page, versus 10 on the prior session. New 52-week lows solidly outnumbered new 52-week highs totals on the NYSE and on the Nasdaq exchange. Technically, bullish action last week marked a shift in the market direction (M criteria) confirming a new uptrend, however, pressure returned as leadership has again grown thin. The Featured Stocks Page provides the most timely analysis on high-ranked leaders. Strict buying and selling rules should always be followed on a case by case basis. Charts used courtesy of www.stockcharts.com
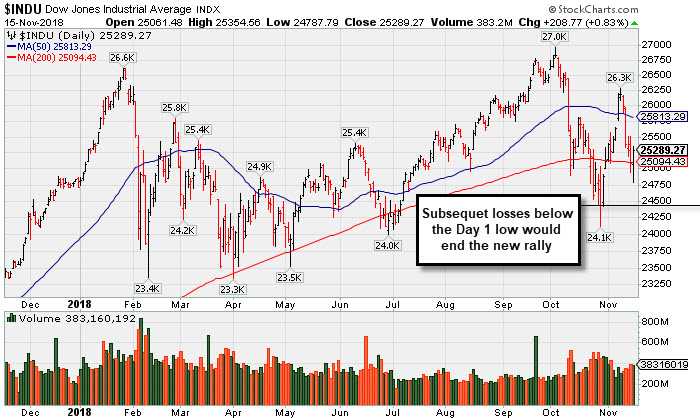
PICTURED: The Dow Jones Industrial Average overcame early weakness and managed "positive reversal" after sputtering below its 200-day moving average (DMA) line and toward the prior low. The solid follow-through day on 11/07/18 was noted as a reassuring sign, however, subsequent losses undercutting the Day 1 lows would technically end the latest confirmed rally.
The S&P 500 snapped a five session losing streak as strong corporate earnings and a rebound in Tech stocks overcame uncertainty from overseas. In geopolitics, several U.K. cabinet officials announced their resignations overnight, causing further questions on future Brexit plans. On the data front, a report showed retail sales spiked 0.8% in October, the largest increase in five months. Separately, initial jobless claims came in at 216,000 in the most recent week.
The Technology sector jumped as Apple (AAPL +2.47%) rebounded but remained below its 200 DMA line. Cisco Systems (CSCO +5.50%) boosted the group, finishing the session higher after the company bested quarterly profit estimates. Meanwhile, Walmart (WMT -1.96%) lagged the broader market advance as the company’s shares slipped. The world’s largest retailer’s positive quarterly report was offset by news that Warren Buffett dissolved his equity stake. Homebuilders also struggled as KB Homes (KBH -15.34%) fell after it cut its current quarter guidance. The Utility sector also underperformed as PG&E (PCG -30.68%) dove amid continued uncertainty surrounding its role in the California wild-fires.
Treasuries were little changed as the yield on the benchmark 10-year note declined one basis point to 3.11%. In commodities, WTI crude advanced 0.4% to $56.49/barrel. COMEX gold added 0.3% to $1,213.60/ounce. |
 Kenneth J. Gruneisen started out as a licensed stockbroker in August 1987, a couple of months prior to the historic stock market crash that took the Dow Jones Industrial Average down -22.6% in a single day. He has published daily fact-based fundamental and technical analysis on high-ranked stocks online for two decades. Through FACTBASEDINVESTING.COM, Kenneth provides educational articles, news, market commentary, and other information regarding proven investment systems that work in good times and bad.
Comments contained in the body of this report are technical opinions only and are not necessarily those of Gruneisen Growth Corp. The material herein has been obtained from sources believed to be reliable and accurate, however, its accuracy and completeness cannot be guaranteed. Our firm, employees, and customers may effect transactions, including transactions contrary to any recommendation herein, or have positions in the securities mentioned herein or options with respect thereto. Any recommendation contained in this report may not be suitable for all investors and it is not to be deemed an offer or solicitation on our part with respect to the purchase or sale of any securities. |
|
 |
Financial, Tech, and Commodity-Linked Groups Rose
Kenneth J. Gruneisen - Passed the CAN SLIM® Master's Exam
The Bank Index ($BKX +1.69%) and Broker/Dealer Index ($XBD +1.43%) posted gains but the Retail Index ($RLX -0.02%) finished flat. The Semiconductor Index ($SOX +3.34%) and Biotech Index ($BTK +2.93%) outpaced the Networking Index ($NWX +1.95%) as the tech sector rebounded. Commodity-linked groups also had a positive bias as the Oil Services Index ($OSX +1.78%), Integrated Oil Index ($XOI +1.65%), and the Gold & Silver Index ($XAU +2.30%) all posted solid gains.
Charts courtesy of www.stockcharts.com
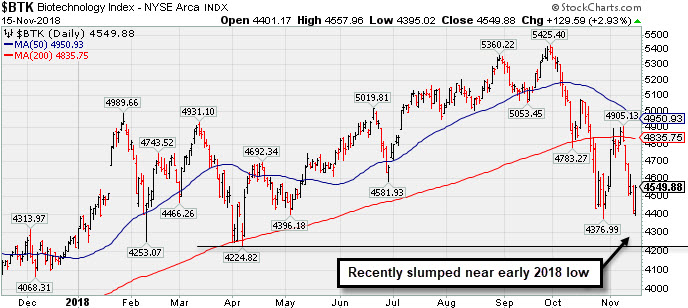 PICTURED: The Biotech Index ($BTK +2.93%) remains below its 50-day and 200-day moving average (DMA) lines after recently slumping near its 2018 low.
| Oil Services |
$OSX |
110.98 |
+1.94 |
+1.78% |
-25.79% |
| Integrated Oil |
$XOI |
1,327.70 |
+21.51 |
+1.65% |
-0.59% |
| Semiconductor |
$SOX |
1,234.62 |
+39.91 |
+3.34% |
-1.47% |
| Networking |
$NWX |
520.27 |
+9.94 |
+1.95% |
+6.06% |
| Broker/Dealer |
$XBD |
263.70 |
+3.71 |
+1.43% |
-0.58% |
| Retail |
$RLX |
2,103.83 |
-0.37 |
-0.02% |
+21.34% |
| Gold & Silver |
$XAU |
64.99 |
+1.46 |
+2.30% |
-23.78% |
| Bank |
$BKX |
100.55 |
+1.67 |
+1.69% |
-5.77% |
| Biotech |
$BTK |
4,549.88 |
+129.59 |
+2.93% |
+7.76% |
|
|
|
 |
Extended From Base After More Gain With Above Average Volume
Kenneth J. Gruneisen - Passed the CAN SLIM® Master's Exam
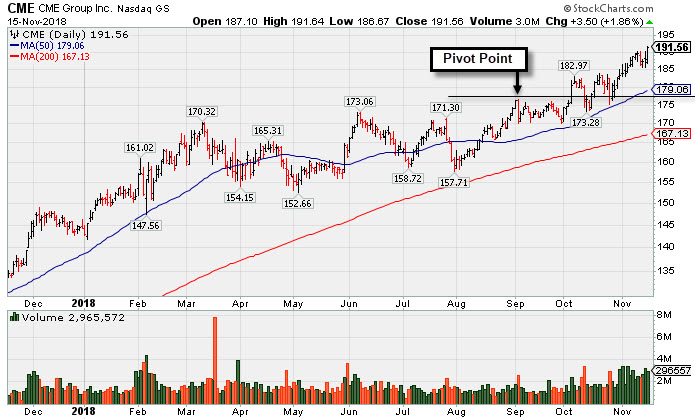
C M E Group Inc (CME +$3.50 or +1.86% to $191.56) hit another new all-time high with today's 3rd consecutive volume-driven gain. It is extended from the prior base. It found support above its 50-day moving average (DMA) line ($179) and made gradual progress since reporting earnings +22% on +2% sales revenues for the Sep '18 quarter, below the +25% minimum earnings guideline (C criteria), raising fundamental concerns. The 50 DMA line and prior low ($170.04 on 9/28/18) define important near-term support to watch on pullbacks.
Earnings increases in the Mar and Jun '18 quarters were above the +25% minimum guideline (C criteria) with solid sales revenues increases. Annual earnings (A criteria) growth has been steady.
The number of top-rated funds owning its shares rose from 1,688 in Dec '17 to 2.018 in Sep '18, a reassuring sign concerning the I criteria. Its current Up/Down Volume Ratio of 2.4 is an unbiased indication its shares have been under accumulation over the past 50 days. It has earned an A Timeliness Rating.
Additional leadership in the group (L criteria) is a reassuring sign. However, several of its peers in the Financial Services - Specialty group stumbled in recent weeks. Its low Industry Group Relative Strength rating of 49 is a concern, plus the noted weakness in Financials which has been covered repeatedly in the Industry Group Watch section of recent After Market Reports.
Charts courtesy of www.stockcharts.com
 |
|
|
Color Codes Explained :
Y - Better candidates highlighted by our
staff of experts.
G - Previously featured
in past reports as yellow but may no longer be buyable under the
guidelines.
***Last / Change / Volume data in this table is the closing quote data***
Symbol/Exchange
Company Name
Industry Group |
PRICE |
CHANGE
(%Change) |
Day High |
Volume
(% DAV)
(% 50 day avg vol) |
52 Wk Hi
% From Hi |
Featured
Date |
Price
Featured |
Pivot Featured |
|
Max Buy |
MPX
-
NYSE
Marine Products Corp
AUTOMOTIVE - Recreational Vehicles
|
$22.93
|
+0.15
0.66% |
$23.54
|
37,702
83.78% of 50 DAV
50 DAV is 45,000
|
$24.82
-7.61%
|
10/24/2018
|
$23.00
|
PP = $24.92
|
|
MB = $26.17
|
Most Recent Note - 11/13/2018 5:44:01 PM
Y - Encountered distributional pressure and finished lower today after challenging its 52-week high. Very little resistance remains due to overhead supply. Subsequent gains above the pivot point backed by at least +40% above average volume may trigger a technical buy signal. Recent low ($20.25 on 10/26/18) defines important support below its 50 DMA line. See the latest FSU analysis for more details and a new annotated graph.
>>> FEATURED STOCK ARTICLE : Perched Within Striking Distance of Pivot Point - 11/13/2018 |
View all notes |
Set NEW NOTE alert |
Company Profile |
SEC
News |
Chart |
Request a new note
C
A
S
I |
GMED
-
NYSE
Globus Medical Inc Cl A
CHEMICALS - Specialty Chemicals
|
$51.50
|
+1.06
2.10% |
$51.52
|
732,297
98.43% of 50 DAV
50 DAV is 744,000
|
$57.83
-10.95%
|
9/26/2018
|
$56.11
|
PP = $57.65
|
|
MB = $60.53
|
Most Recent Note - 11/14/2018 5:29:22 PM
G - Sank below its 200 DMA line ($51.67) near the prior low with lighter volume behind today's 4th consecutive loss, finishing -12.8% off its all-time high. The prior low ($49.34 on 10/08/18) defines important near term support.
>>> FEATURED STOCK ARTICLE : Consolidating -5.2% Off 52-Week High Ahead of Earnings News - 11/5/2018 |
View all notes |
Set NEW NOTE alert |
Company Profile |
SEC
News |
Chart |
Request a new note
C
A
S
I |
ZBRA
-
NASDAQ
Zebra Tech Corp Cl A
COMPUTER HARDWARE - Computer Peripherals
|
$178.91
|
+5.65
3.26% |
$180.28
|
763,371
171.93% of 50 DAV
50 DAV is 444,000
|
$184.75
-3.16%
|
11/6/2018
|
$170.41
|
PP = $179.57
|
|
MB = $188.55
|
 Most Recent Note - 11/15/2018 6:06:01 PM
Y - Posted a big gain with above average volume today while rebounding near its pivot point. Disciplined investors are reminded to always follow strict buy and sell rules.
>>> FEATURED STOCK ARTICLE : Hit New High Following Another Strong Earnings Increase - 11/6/2018 |
View all notes |
Set NEW NOTE alert |
Company Profile |
SEC
News |
Chart |
Request a new note
C
A
S
I |
CME
-
NASDAQ
C M E Group Inc
DIVERSIFIED SERVICES - Business/Management Services
|
$191.56
|
+3.50
1.86% |
$191.64
|
2,891,970
159.60% of 50 DAV
50 DAV is 1,812,000
|
$190.43
0.59%
|
10/4/2018
|
$179.29
|
PP = $177.45
|
|
MB = $186.32
|
Most Recent Note - 11/13/2018 5:37:58 PM
G - Holding its ground near its all-time high after rising above its "max buy" level with an impressive streak of gains. Found support above its 50 DMA line ($178) after recently reporting earnings +22% on +2% sales revenues for the Sep '18 quarter, below the +25% minimum earnings guideline (C criteria), raising fundamental concerns. The 50 DMA line and prior low ($170.04 on 9/28/18) define important near-term support.
>>> FEATURED STOCK ARTICLE : Extended From Base After More Gain With Above Average Volume - 11/15/2018 |
View all notes |
Set NEW NOTE alert |
Company Profile |
SEC
News |
Chart |
Request a new note
C
A
S
I |
GDOT
-
NYSE
Green Dot Corp Cl A
FINANCIAL SERVICES - Credit Services
|
$83.00
|
+2.42
3.00% |
$83.29
|
476,592
110.07% of 50 DAV
50 DAV is 433,000
|
$93.00
-10.75%
|
11/8/2018
|
$90.35
|
PP = $91.61
|
|
MB = $96.19
|
Most Recent Note - 11/12/2018 3:05:33 PM
G - Color code is changed to green with another big loss today undercutting its 50 DMA line ($82.18) after it abruptly reversed into the prior base with a big loss on Friday. Disciplined investors always limit losses by selling any stock that falls more than -7% from their purchase price.
>>> FEATURED STOCK ARTICLE : Volume Heavy Behind Rally to New High - 11/8/2018 |
View all notes |
Set NEW NOTE alert |
Company Profile |
SEC
News |
Chart |
Request a new note
C
A
S
I |
Symbol/Exchange
Company Name
Industry Group |
PRICE |
CHANGE
(%Change) |
Day High |
Volume
(% DAV)
(% 50 day avg vol) |
52 Wk Hi
% From Hi |
Featured
Date |
Price
Featured |
Pivot Featured |
|
Max Buy |
HZO
-
NYSE
Marinemax Inc
SPECIALTY RETAIL - Specialty Retail, Other
|
$23.77
|
-0.29
-1.21% |
$24.00
|
349,895
105.07% of 50 DAV
50 DAV is 333,000
|
$26.11
-8.96%
|
11/2/2018
|
$25.10
|
PP = $25.15
|
|
MB = $26.41
|
Most Recent Note - 11/13/2018 5:40:34 PM
Y - Volume totals have cooled after slumping back into the prior base, raising concerns while completely negating the latest technical breakout. Fundamentals remain strong.
>>> FEATURED STOCK ARTICLE : Boat Retailer Has Strong Earnings History - 11/2/2018 |
View all notes |
Set NEW NOTE alert |
Company Profile |
SEC
News |
Chart |
Request a new note
C
A
S
I |
ULTA
-
NASDAQ
Ulta Beauty Inc
SPECIALTY RETAIL - Specialty Retail, Other
|
$311.81
|
-1.32
-0.42% |
$312.52
|
845,148
87.49% of 50 DAV
50 DAV is 966,000
|
$321.73
-3.08%
|
11/8/2018
|
$296.36
|
PP = $290.40
|
|
MB = $304.92
|
Most Recent Note - 11/14/2018 5:33:48 PM
G - Color code is changed to green after trading above its "max buy" level with recent gains and hitting a new all-time high today. Prior high ($290) defines initial support to watch on pullbacks.
>>> FEATURED STOCK ARTICLE : Volume Driven Gains Indicate Institutional Buying Demand - 11/9/2018 |
View all notes |
Set NEW NOTE alert |
Company Profile |
SEC
News |
Chart |
Request a new note
C
A
S
I |
UBNT
-
NASDAQ
Ubiquiti Networks Inc
TELECOMMUNICATIONS - Diversified Communication Serv
|
$111.93
|
+3.51
3.24% |
$112.29
|
787,669
150.03% of 50 DAV
50 DAV is 525,000
|
$112.38
-0.40%
|
11/9/2018
|
$108.20
|
PP = $101.43
|
|
MB = $106.50
|
Most Recent Note - 11/14/2018 1:28:57 PM
G - Color code is changed to green while trading above its "max buy" level and near its all-time high. Disciplined investors avoid chasing stocks more than +5% above the pivot point. Prior high ($101.33 on 9/25/18) defines initial support to watch on pullbacks.
>>> FEATURED STOCK ARTICLE : Pullback Following Breakout Gain on After Latest Earnings Report - 11/12/2018 |
View all notes |
Set NEW NOTE alert |
Company Profile |
SEC
News |
Chart |
Request a new note
C
A
S
I |
DPZ
-
NYSE
Dominos Pizza Inc
Retail-Restaurants
|
$259.62
|
-6.50
-2.44% |
$264.99
|
629,496
106.88% of 50 DAV
50 DAV is 589,000
|
$305.34
-14.97%
|
8/13/2018
|
$288.60
|
PP = $293.91
|
|
MB = $308.61
|
Most Recent Note - 11/15/2018 6:02:09 PM
G - Prior lows ($253) define important near-term support to watch while retesting its 200 DMA line ($259) with a loss today on higher (near average) volume. Met resistance at its 50 DMA line ($275), and a rebound above the 50 DMA line is needed for its outlook to improve. Fundamentals remain strong.
>>> FEATURED STOCK ARTICLE : Found Support at 200-Day Moving Average Line - 10/31/2018 |
View all notes |
Set NEW NOTE alert |
Company Profile |
SEC
News |
Chart |
Request a new note
C
A
S
I |
FIVE
-
NASDAQ
Five Below Inc
Retail-DiscountandVariety
|
$120.86
|
-2.02
-1.64% |
$122.52
|
1,107,244
112.41% of 50 DAV
50 DAV is 985,000
|
$136.13
-11.22%
|
7/6/2018
|
$98.90
|
PP = $104.09
|
|
MB = $109.29
|
Most Recent Note - 11/14/2018 5:24:30 PM
G - Consolidating above its 50 DMA line ($121.53). Faces some resistance due to overhead supply up to the $136 level. The recent low ($108.76 on 10/26/18) defines important near term support to watch on pullbacks. See the latest FSU analysis for more details and a new annotated graph.
>>> FEATURED STOCK ARTICLE : Consolidating Near 50-Day Moving Average After Finding Support - 11/14/2018 |
View all notes |
Set NEW NOTE alert |
Company Profile |
SEC
News |
Chart |
Request a new note
C
A
S
I |
Symbol/Exchange
Company Name
Industry Group |
PRICE |
CHANGE
(%Change) |
Day High |
Volume
(% DAV)
(% 50 day avg vol) |
52 Wk Hi
% From Hi |
Featured
Date |
Price
Featured |
Pivot Featured |
|
Max Buy |
HQY
-
NASDAQ
Healthequity Inc
COMPUTER SOFTWARE and SERVICES - Healthcare Information Service
|
$84.55
|
+0.16
0.19% |
$84.88
|
697,484
75.98% of 50 DAV
50 DAV is 918,000
|
$101.58
-16.77%
|
11/2/2018
|
$95.56
|
PP = $100.09
|
|
MB = $105.09
|
Most Recent Note - 11/14/2018 11:41:38 AM
G - Slumping abruptly after wedging to a new high last week. Prior low ($80.56 on 10/24/18) defines important near-term support. A rebound above the 50 DMA line is needed for its outlook to improve. Prior reports cautioned members - "A big gain on 11/07/18 was backed by only +20% above average volume. Subsequent gains above the pivot point backed by at least +40% above average volume may clinch a convincing new (or add on) technical buy signal."
>>> FEATURED STOCK ARTICLE : Rebound Above 50-Day Average Helped Outlook Improve - 11/1/2018 |
View all notes |
Set NEW NOTE alert |
Company Profile |
SEC
News |
Chart |
Request a new note
C
A
S
I |
OLLI
-
NASDAQ
Ollie's Bargain Outlet
Retail-DiscountandVariety
|
$89.19
|
-1.85
-2.03% |
$91.45
|
714,486
107.12% of 50 DAV
50 DAV is 667,000
|
$97.61
-8.63%
|
11/8/2018
|
$92.75
|
PP = $97.71
|
|
MB = $102.60
|
Most Recent Note - 11/15/2018 6:04:15 PM
G - Color code is changed to green after a loss today on higher (near average) volume led to a close bellow its 50 DMA line ($91.10). The recent low ($84.66 on 10/11/18) defines the next important support to watch. Fundamentals remain strong.
>>> FEATURED STOCK ARTICLE : Finding Support Near its 50-Day Moving Average - 10/30/2018 |
View all notes |
Set NEW NOTE alert |
Company Profile |
SEC
News |
Chart |
Request a new note
C
A
S
I |
PLNT
-
NYSE
Planet Fitness Inc Cl A
Leisure-Services
|
$53.76
|
+1.21
2.30% |
$54.13
|
1,079,789
83.77% of 50 DAV
50 DAV is 1,289,000
|
$57.66
-6.76%
|
11/7/2018
|
$57.10
|
PP = $55.45
|
|
MB = $58.22
|
Most Recent Note - 11/15/2018 6:08:49 PM
Y - Posted a 3rd consecutive gain today. Following a recent breakout it slumped back into the prior base with a damaging loss on 11/12/18 raising concerns. Its 50 DMA line ($49.95) defines important support.
>>> FEATURED STOCK ARTICLE : Big Gain for New High With Nearly 4 Times Average Volume - 11/7/2018 |
View all notes |
Set NEW NOTE alert |
Company Profile |
SEC
News |
Chart |
Request a new note
C
A
S
I |
|
|
|
THESE ARE NOT BUY RECOMMENDATIONS!
Comments contained in the body of this report are technical
opinions only. The material herein has been obtained
from sources believed to be reliable and accurate, however,
its accuracy and completeness cannot be guaranteed.
This site is not an investment advisor, hence it does
not endorse or recommend any securities or other investments.
Any recommendation contained in this report may not
be suitable for all investors and it is not to be deemed
an offer or solicitation on our part with respect to
the purchase or sale of any securities. All trademarks,
service marks and trade names appearing in this report
are the property of their respective owners, and are
likewise used for identification purposes only.
This report is a service available
only to active Paid Premium Members.
You may opt-out of receiving report notifications
at any time. Questions or comments may be submitted
by writing to Premium Membership Services 665 S.E. 10 Street, Suite 201 Deerfield Beach, FL 33441-5634 or by calling 1-800-965-8307
or 954-785-1121.
|
|
|

