You are not logged in.
This means you
CAN ONLY VIEW reports that were published prior to Monday, April 14, 2025.
You
MUST UPGRADE YOUR MEMBERSHIP if you want to see any current reports.
AFTER MARKET UPDATE - WEDNESDAY, NOVEMBER 13TH, 2013
Previous After Market Report Next After Market Report >>>
|
|
|
|
DOW |
+70.96 |
15,821.63 |
+0.45% |
|
Volume |
696,635,020 |
+7% |
|
Volume |
1,754,762,250 |
+2% |
|
NASDAQ |
+45.66 |
3,965.58 |
+1.16% |
|
Advancers |
2,059 |
66% |
|
Advancers |
1,784 |
67% |
|
S&P 500 |
+14.31 |
1,782.00 |
+0.81% |
|
Decliners |
947 |
30% |
|
Decliners |
769 |
29% |
|
Russell 2000 |
+10.71 |
1,112.18 |
+0.97% |
|
52 Wk Highs |
167 |
|
|
52 Wk Highs |
156 |
|
|
S&P 600 |
+5.18 |
638.63 |
+0.82% |
|
52 Wk Lows |
51 |
|
|
52 Wk Lows |
42 |
|
|
 |
Major Averages Resume Record Setting Ways
Kenneth J. Gruneisen - Passed the CAN SLIM® Master's Exam
Wednesday's session ended with gains for the major averages. The volume totals were reported higher on the NYSE and on the Nasdaq exchange. Breadth was positive as advancers led decliners by 2-1 on the NYSE and on the Nasdaq exchange. There were 73 high-ranked companies from the CANSLIM.net Leaders List that made new 52-week highs and appeared on the CANSLIM.net BreakOuts Page, up from 52 stocks on the prior session. The list of stocks hitting new 52-week highs expanded and easily outnumbered new lows on the NYSE and on the Nasdaq exchange. There were gains for 18 of the 22 high-ranked companies currently included on the Featured Stocks Page.
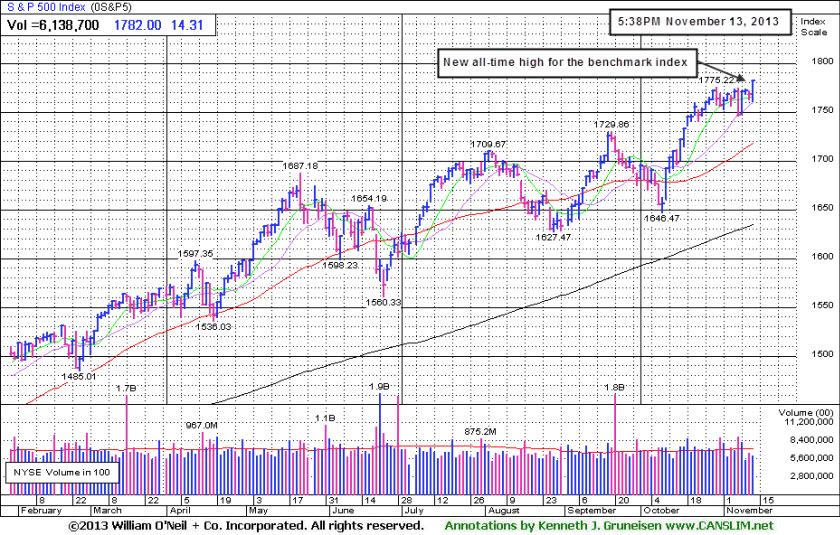
Stocks resumed their record setting ways on Wednesday. The Dow gained 71 points to close at an all-time high of 15,821. The S&P 500 finished at its best level, rising 14 points to 1,782. The Nasdaq Composite Index advanced 46 points to 3,965.
The major averages ended a choppy trading session in positive territory as a rally by retailers offset uncertainty surrounding Fed policy. Shares of Macy's Inc (M +9.4%) rose after quarterly results topped consensus estimates. The market recovered from an early retreat attributed to speculation that recent positive economic reports may prompt the central bank to trim its stimulus measures. Attention will remain on policy makers with tomorrow’s Senate Banking Committee hearing for Vice Chairman Janet Yellen to become the new head of the Fed.
Eight of 10 sectors in the S&P 500 were higher with consumer discretionary up the most on the session. In addition to Macy’s, Abercrombie & Fitch Co (ANF +3.0%) and Nordstrom Inc (JWN +2.5%) rose. Over in tech, Google Inc (GOOG +2.0%) and Cisco Systems Inc (CSCO +1.1%) rose ahead of scheduled earnings releases after the closing bell.
Treasuries gained with the 10-year note up 11/32 to yield 2.73%.
Market (M criteria) conditions are encouraging as the major averages overcame their latest bout of distributional pressure. New buying efforts should still be limited and very selective. The CANSLIM.net Featured Stocks Page shows the most action-worthy candidates and their latest notes and a new Headline Link directs members to the latest detailed analysis with data-packed graphs annotated by a Certified expert along with links to additional resources. The Premium Member Homepage - includes "dynamic archives" to all prior pay reports published. Watch for an announcement via email concerning the next WEBCAST.
PICTURED: The S&P 500 Index is at a new all-time high and up +25% year-to-date.
|
 Kenneth J. Gruneisen started out as a licensed stockbroker in August 1987, a couple of months prior to the historic stock market crash that took the Dow Jones Industrial Average down -22.6% in a single day. He has published daily fact-based fundamental and technical analysis on high-ranked stocks online for two decades. Through FACTBASEDINVESTING.COM, Kenneth provides educational articles, news, market commentary, and other information regarding proven investment systems that work in good times and bad.
Comments contained in the body of this report are technical opinions only and are not necessarily those of Gruneisen Growth Corp. The material herein has been obtained from sources believed to be reliable and accurate, however, its accuracy and completeness cannot be guaranteed. Our firm, employees, and customers may effect transactions, including transactions contrary to any recommendation herein, or have positions in the securities mentioned herein or options with respect thereto. Any recommendation contained in this report may not be suitable for all investors and it is not to be deemed an offer or solicitation on our part with respect to the purchase or sale of any securities. |
|
 |
Retail, Financial, Tech, and Commodity-Linked Groups Rose
Kenneth J. Gruneisen - Passed the CAN SLIM® Master's Exam
The Retail Index ($RLX +1.90%) rallied and helped to underpin the major averages' gains, and the financial groups also had a positive bias as the Bank Index ($BKX +0.89%) and the Broker/Dealer Index ($XBD +1.31%) both posted gains. The tech sector saw unanimous gains from the Biotechnology Index ($BTK +0.72%), Networking Index ($NWX +0.80%), and the Semiconductor Index ($SOX +0.87%). Commodity-linked groups also edged higher as the Gold & Silver Index ($XAU +0.68%), Oil Services Index ($OSX +0.69%), and Integrated Oil Index ($XOI +0.69%) posted modest gains.
Charts courtesy www.stockcharts.com
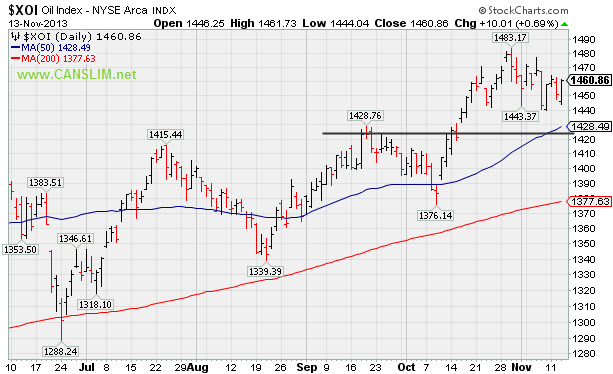
PICTURED: The Integrated Oil Index ($XOI +0.69%) posted a modest gain, consolidating above prior highs.
| Oil Services |
$OSX |
287.73 |
+1.97 |
+0.69% |
+30.69% |
| Integrated Oil |
$XOI |
1,460.86 |
+10.01 |
+0.69% |
+17.64% |
| Semiconductor |
$SOX |
508.00 |
+4.39 |
+0.87% |
+32.27% |
| Networking |
$NWX |
302.93 |
+2.41 |
+0.80% |
+33.71% |
| Broker/Dealer |
$XBD |
147.45 |
+1.91 |
+1.31% |
+56.32% |
| Retail |
$RLX |
913.65 |
+17.05 |
+1.90% |
+39.90% |
| Gold & Silver |
$XAU |
91.46 |
+0.62 |
+0.68% |
-44.77% |
| Bank |
$BKX |
65.71 |
+0.58 |
+0.89% |
+28.14% |
| Biotech |
$BTK |
2,171.14 |
+15.56 |
+0.72% |
+40.34% |
|
|
|
 |
Perched Near All-Time High Tallying Quiet Gains
Kenneth J. Gruneisen - Passed the CAN SLIM® Master's Exam
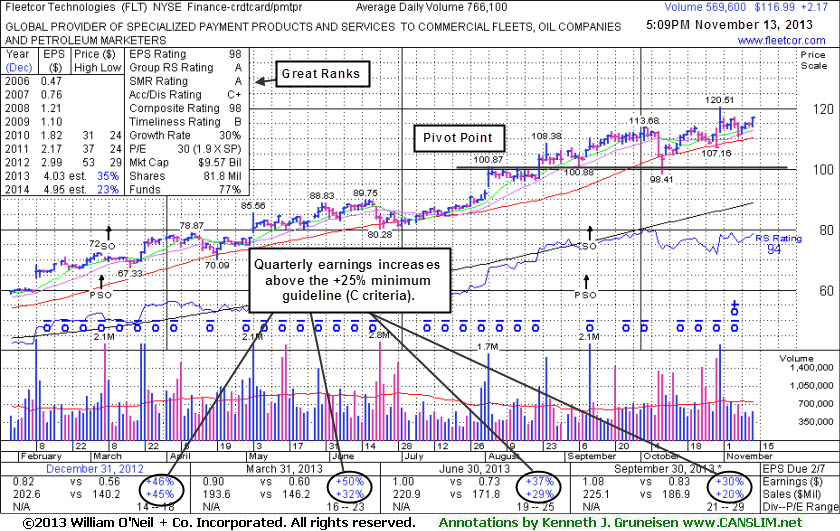
FleetCor Technologies, Inc. (FLT +$2.17% or +1.89% to $116.99) inched higher with light volume for a best-ever close. It endured distributional pressure in recent weeks and did not form a sound base. Its 50-day moving average (DMA) line defines near-term support to watch on pullbacks. It was last shown in this FSU section on 10/07/13 with an annotated daily graph under the headline, "Extended After 13 Weekly Gains in Span of 14 Weeks".
It is perched only -2.9% off its all-time high and no resistance remains due to overhead supply. The 9/06/13 summary, under the headline, "Holding Ground Following Latest Volume Driven Gains", showed a weekly graph where it recently rose with volume-driven gains from an advanced "3-weeks tight" base noted as a riskier "late stage" base. It had enjoyed a considerable rally even before the three latest Pivot Points (PP) were discussed on the ongoing coverage published while FLT has traded up as much as +69.39% since first featured in yellow at $71.14 in the mid-day report on 3/21/13 (read here). Disciplined investors avoid chasing stocks extended more than +5% above their pivot point or prior highs and always limit losses by selling any stock that falls more than -7% from their purchase price.
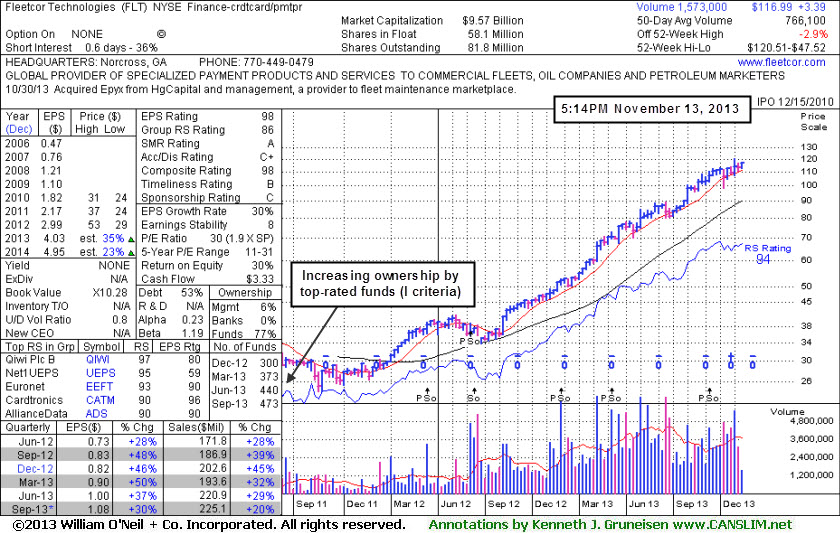
It reported earnings +30% on +20% sales revenues for the Sep '13 quarter, marking its 7th consecutive quarterly comparison with earnings above the +25% guideline (C criteria). The company completed yet another Secondary Offering on 9/11/13. On 3/14/12, 6/11/12, 11/29/12, and 3/08/13 it priced Secondary Offerings and it was previously noted, "Such offerings often are a short-term hindrance to upward price progress yet typically result in broader institutional ownership interest."
The number of top-rated funds owning its shares rose from 193 in Mar '12 to 473 in Sep '13, a reassuring sign concerning the I criteria. The company hails from the Finance - Credit Card Payment Processing group which improved to a 86 Group Relative Strength Rating from a 55 rating when shown in the FSU section on 7/18/13. Impressive strength and leadership from a couple of other firms in the same industry group is also considered a reassurance concerning the L criteria.
|
|
|
Color Codes Explained :
Y - Better candidates highlighted by our
staff of experts.
G - Previously featured
in past reports as yellow but may no longer be buyable under the
guidelines.
***Last / Change / Volume data in this table is the closing quote data***
Symbol/Exchange
Company Name
Industry Group |
PRICE |
CHANGE
(%Change) |
Day High |
Volume
(% DAV)
(% 50 day avg vol) |
52 Wk Hi
% From Hi |
Featured
Date |
Price
Featured |
Pivot Featured |
|
Max Buy |
BITA
-
NYSE
Bitauto Hldgs Ltd Ads
INTERNET - Internet Information Providers
|
$29.70
|
+1.49
5.28% |
$31.27
|
2,150,344
217.91% of 50 DAV
50 DAV is 986,800
|
$28.90
2.77%
|
9/24/2013
|
$16.40
|
PP = $17.31
|
|
MB = $18.18
|
 Most Recent Note - 11/13/2013 12:00:54 PM
G - Hitting another new 52-week high today while on track for a 4th consecutive volume-driven gain, getting more extended from any sound base. See the latest Featured Stock Update for more detailed analysis and annotated daily and weekly graphs.
>>> FEATURED STOCK ARTICLE : Consolidating After Getting Extended From Prior Base - 11/11/2013
View all notes |
Set NEW NOTE alert |
CANSLIM.net Company Profile |
SEC
News |
Chart |
Request a new note
C
A N
S L
I M


|
BLOX
-
NYSE
Infoblox Inc
COMPUTER HARDWARE - Networking and Communication Dev
|
$44.31
|
+1.31
3.05% |
$44.34
|
701,887
84.11% of 50 DAV
50 DAV is 834,500
|
$48.97
-9.51%
|
10/11/2013
|
$43.02
|
PP = $45.60
|
|
MB = $47.88
|
Most Recent Note - 11/13/2013 2:40:48 PM
Y - Posting a gain today with higher volume as it finds support at its 50 DMA line. Disciplined investors limit losses by selling any stock that falls more than -7% from their purchase price.
>>> FEATURED STOCK ARTICLE : Finished Another Week Higher With Volume Behind Gains - 10/11/2013
View all notes |
Set NEW NOTE alert |
CANSLIM.net Company Profile |
SEC
News |
Chart |
Request a new note
C
A N
S L
I M
|
CELG
-
NASDAQ
Celgene Corp
DRUGS - Drug Manufacturers - Major
|
$149.28
|
-0.13
-0.09% |
$149.94
|
3,453,602
120.22% of 50 DAV
50 DAV is 2,872,800
|
$161.64
-7.65%
|
9/12/2013
|
$149.50
|
PP = $150.02
|
|
MB = $157.52
|
Most Recent Note - 11/12/2013 6:52:08 PM
G - Still lingering below its 50 DMA line. The prior low ($142.10 on 11/07/13) is the next technical support level where a subsequent violation may trigger a more worrisome technical sell signal. Earnings +21% on +18% sales revenues for the Sep '13 quarter were below the +25% minimum guideline (C criteria) raising concerns.
>>> FEATURED STOCK ARTICLE : Testing 50-Day Average Following Sub Par Earnings Increase - 11/1/2013
View all notes |
Set NEW NOTE alert |
CANSLIM.net Company Profile |
SEC
News |
Chart |
Request a new note
C
A N
S L
I M
|
EGOV
-
NASDAQ
N I C Inc
INTERNET - Internet Software and Services
|
$23.72
|
+0.50
2.15% |
$23.79
|
249,873
80.50% of 50 DAV
50 DAV is 310,400
|
$25.99
-8.73%
|
10/18/2013
|
$25.17
|
PP = $23.66
|
|
MB = $24.84
|
Most Recent Note - 11/12/2013 6:54:24 PM
Y - Trading near its 50 DMA line after slumping back into its prior base raising concerns with damaging distributional action. Disciplined investors always limit losses by selling any stock that falls more than -7% from their purchase price.
>>> FEATURED STOCK ARTICLE : Technical Breakout From "Double Bottom" Base on 3 Times Average Volume - 10/18/2013
View all notes |
Set NEW NOTE alert |
CANSLIM.net Company Profile |
SEC
News |
Chart |
Request a new note
C
A N
S L
I M
|
FLT
-
NYSE
Fleetcor Technologies
DIVERSIFIED SERVICES - Business/Management Services
|
$116.99
|
+2.17
1.89% |
$117.06
|
569,676
74.36% of 50 DAV
50 DAV is 766,100
|
$120.51
-2.92%
|
8/19/2013
|
$99.01
|
PP = $100.97
|
|
MB = $106.02
|
Most Recent Note - 11/13/2013 5:19:03 PM
G - Inched higher with light volume today while for a best-ever close. Endured distributional pressure in recent weeks and did not form a sound base. Its 50 DMA line defines near-term support to watch on pullbacks. See the latest FSU analysis for more details and new annotated daily and weekly graphs.
>>> FEATURED STOCK ARTICLE : Perched Near All-Time High Tallying Quiet Gains - 11/13/2013
View all notes |
Set NEW NOTE alert |
CANSLIM.net Company Profile |
SEC
News |
Chart |
Request a new note
C
A N
S L
I M
|
Symbol/Exchange
Company Name
Industry Group |
PRICE |
CHANGE
(%Change) |
Day High |
Volume
(% DAV)
(% 50 day avg vol) |
52 Wk Hi
% From Hi |
Featured
Date |
Price
Featured |
Pivot Featured |
|
Max Buy |
GNRC
-
NYSE
Generac Hldgs Inc
CONSUMER DURABLES - Electronic Equipment
|
$48.95
|
-0.16
-0.33% |
$49.20
|
533,503
66.09% of 50 DAV
50 DAV is 807,200
|
$52.32
-6.44%
|
10/24/2013
|
$47.46
|
PP = $44.24
|
|
MB = $46.45
|
Most Recent Note - 11/13/2013 3:39:13 PM
G - Volume totals have been cooling while holding its ground stubbornly near all-time highs. Prior highs in the $44 area define near-term support to watch on pullbacks.
>>> FEATURED STOCK ARTICLE : Consolidating After "Breakway Gap" With 4 Times Average Volume - 10/30/2013
View all notes |
Set NEW NOTE alert |
CANSLIM.net Company Profile |
SEC
News |
Chart |
Request a new note
C
A N
S L
I M
|
JAZZ
-
NASDAQ
Jazz Pharmaceuticals Plc
DRUGS - Biotechnology
|
$109.95
|
+8.76
8.66% |
$110.30
|
1,674,324
243.25% of 50 DAV
50 DAV is 688,300
|
$102.17
7.61%
|
9/30/2013
|
$93.20
|
PP = $89.10
|
|
MB = $93.56
|
Most Recent Note - 11/13/2013 2:34:51 PM
G- Powering to a new 52-week high with today's 4th consecutive gain on ever-increasing volume, getting more extended from prior highs. Disciplined investors avoid chasing stocks more than +5% above prior highs and always limit losses by selling any stock that falls more than -7% from their purchase price.
>>> FEATURED STOCK ARTICLE : Hovering Near All-Time Highs Following Volume-Driven Gains - 11/7/2013
View all notes |
Set NEW NOTE alert |
CANSLIM.net Company Profile |
SEC
News |
Chart |
Request a new note
C
A N
S L
I M
|
KORS
-
NYSE
Michael Kors Hldgs Ltd
RETAIL - Apparel Stores
|
$82.19
|
+0.05
0.06% |
$82.34
|
6,687,598
146.09% of 50 DAV
50 DAV is 4,577,700
|
$82.73
-0.65%
|
8/6/2013
|
$69.66
|
PP = $66.28
|
|
MB = $69.59
|
Most Recent Note - 11/13/2013 12:29:34 PM
G - Perched near all-time highs after volume-driven gains, getting extended from prior highs in the $78 area that define near-term support.
>>> FEATURED STOCK ARTICLE : Hitting New Highs After Choppy Consolidation - 11/6/2013
View all notes |
Set NEW NOTE alert |
CANSLIM.net Company Profile |
SEC
News |
Chart |
Request a new note
C
A N
S L
I M
|
LOPE
-
NASDAQ
Grand Canyon Education
DIVERSIFIED SERVICES - Education and; Training Services
|
$47.25
|
+0.68
1.46% |
$47.57
|
208,212
50.55% of 50 DAV
50 DAV is 411,900
|
$50.48
-6.40%
|
6/19/2013
|
$31.47
|
PP = $34.17
|
|
MB = $35.88
|
Most Recent Note - 11/13/2013 3:34:35 PM
G - Still holding its ground near all-time highs following a considerable volume-driven gain on 10/30/13. Reported earnings +17% on +14% sales revenues for the Sep '13 quarter, its 2nd quarterly comparison with an earnings increase below the +25% minimum guideline (C criteria). Repeatedly noted - "Fundamental concerns remain while technical action has been reassuring."
>>> FEATURED STOCK ARTICLE : Formed Advanced Base But Fundamental Concerns Remain - 10/14/2013
View all notes |
Set NEW NOTE alert |
CANSLIM.net Company Profile |
SEC
News |
Chart |
Request a new note
C
A N
S L
I M
|
MRLN
-
NASDAQ
Marlin Business Services
DIVERSIFIED SERVICES - Rental and Leasing Services
|
$25.38
|
-0.30
-1.17% |
$25.93
|
30,623
98.78% of 50 DAV
50 DAV is 31,000
|
$28.64
-11.38%
|
9/9/2013
|
$23.75
|
PP = $24.03
|
|
MB = $25.23
|
Most Recent Note - 11/11/2013 1:07:09 PM
G - Consolidating near prior highs in the $26 area and recently finding support at its 50 DMA line. More damaging losses would raise greater concerns and trigger more worrisome technical sell signals.
>>> FEATURED STOCK ARTICLE : Faring Better Than Others While Testing 50-Day Average Line - 10/8/2013
View all notes |
Set NEW NOTE alert |
CANSLIM.net Company Profile |
SEC
News |
Chart |
Request a new note
C
A N
S L
I M
|
Symbol/Exchange
Company Name
Industry Group |
PRICE |
CHANGE
(%Change) |
Day High |
Volume
(% DAV)
(% 50 day avg vol) |
52 Wk Hi
% From Hi |
Featured
Date |
Price
Featured |
Pivot Featured |
|
Max Buy |
NOAH
-
NYSE
Noah Holdings Ltd Ads
FINANCIAL SERVICES - Asset Management
|
$21.88
|
+0.05
0.23% |
$22.88
|
914,962
126.24% of 50 DAV
50 DAV is 724,800
|
$22.99
-4.83%
|
10/15/2013
|
$19.10
|
PP = $18.33
|
|
MB = $19.25
|
Most Recent Note - 11/13/2013 12:33:22 PM
G - Challenging its 52-week high with today's gain after choppy action in recent weeks. Disciplined investors avoid chasing extended stocks and always limit losses by selling if any stock falls more than -7% from their purchase price.
>>> FEATURED STOCK ARTICLE : Finished Strong With Gain on 4 Times Average Volume - 10/15/2013
View all notes |
Set NEW NOTE alert |
CANSLIM.net Company Profile |
SEC
News |
Chart |
Request a new note
C
A N
S L
I M
|
OII
-
NYSE
Oceaneering Intl Inc
ENERGY - Oil and Gas Drilling and Explorati
|
$82.36
|
+0.01
0.01% |
$82.46
|
1,307,726
199.32% of 50 DAV
50 DAV is 656,100
|
$87.64
-6.02%
|
10/16/2013
|
$83.08
|
PP = $84.74
|
|
MB = $88.98
|
Most Recent Note - 11/13/2013 12:35:52 PM
G - Violated its 50 DMA line with above average volume behind losses triggering a technical sell signal and its color code was changed to green. Recently reported earnings +23% on +16% sales revenues, below the +25% minimum earnings guideline (C criteria) raising concerns.
>>> FEATURED STOCK ARTICLE : Forming Set-Up Above 50-Day Moving Average Line - 10/16/2013
View all notes |
Set NEW NOTE alert |
CANSLIM.net Company Profile |
SEC
News |
Chart |
Request a new note
C
A N
S L
I M
|
PCLN
-
NASDAQ
Priceline.Com Inc
INTERNET - Internet Software and Services
|
$1,124.20
|
+24.71
2.25% |
$1,125.89
|
881,272
143.90% of 50 DAV
50 DAV is 612,400
|
$1,109.50
1.32%
|
9/13/2013
|
$966.82
|
PP = $995.08
|
|
MB = $1,044.83
|
Most Recent Note - 11/11/2013 1:10:47 PM
G - Hitting new 52-week highs today with a 2nd consecutive volume-driven gain after finding support at its 50 DMA line last week. It has not formed a sound base pattern. Reported earnings +40% on +33% sales revenues for the Sep '13 quarter versus the year-ago period, improving after a slightly sub par Jun '13 report.
>>> FEATURED STOCK ARTICLE : Rallied to New Highs Following Pullback to 50-day Average - 10/29/2013
View all notes |
Set NEW NOTE alert |
CANSLIM.net Company Profile |
SEC
News |
Chart |
Request a new note
C
A N
S L
I M
|
PRAA
-
NASDAQ
Portfolio Recovery Assoc
DIVERSIFIED SERVICES - Business/Management Services
|
$56.85
|
-0.13
-0.23% |
$56.98
|
661,470
150.06% of 50 DAV
50 DAV is 440,800
|
$63.96
-11.12%
|
10/17/2013
|
$60.75
|
PP = $61.70
|
|
MB = $64.79
|
Most Recent Note - 11/11/2013 5:53:49 PM
G - Was down for a 9th consecutive loss today, slumping further below its 50 DMA line. Prior low of $56.20 on 10/09/13 defines the next important chart support level to watch.
>>> FEATURED STOCK ARTICLE : Near 50-Day Moving Average Enduring Distributional Pressure - 11/5/2013
View all notes |
Set NEW NOTE alert |
CANSLIM.net Company Profile |
SEC
News |
Chart |
Request a new note
C
A N
S L
I M
|
PRLB
-
NYSE
Proto Labs Inc
MANUFACTURING - Small Tools and Accessories
|
$87.01
|
+1.62
1.90% |
$88.00
|
330,584
78.84% of 50 DAV
50 DAV is 419,300
|
$89.97
-3.29%
|
7/29/2013
|
$64.86
|
PP = $67.50
|
|
MB = $70.88
|
Most Recent Note - 11/12/2013 6:49:48 PM
G - Touched a new 52-week high today but reversed into the red and finished near the session lows. Near term support to watch is at its 50 DMA line.
>>> FEATURED STOCK ARTICLE : Undercut 50-Day Moving Average Yet Found Prompt Support - 11/4/2013
View all notes |
Set NEW NOTE alert |
CANSLIM.net Company Profile |
SEC
News |
Chart |
Request a new note
C
A N
S L
I M
|
Symbol/Exchange
Company Name
Industry Group |
PRICE |
CHANGE
(%Change) |
Day High |
Volume
(% DAV)
(% 50 day avg vol) |
52 Wk Hi
% From Hi |
Featured
Date |
Price
Featured |
Pivot Featured |
|
Max Buy |
SFUN
-
NYSE
Soufun Hldgs Ltd Ads A
INTERNET - Internet Information Providers
|
$67.43
|
+4.97
7.96% |
$67.81
|
1,651,875
109.07% of 50 DAV
50 DAV is 1,514,500
|
$63.44
6.29%
|
10/17/2013
|
$58.02
|
PP = $53.87
|
|
MB = $56.56
|
Most Recent Note - 11/13/2013 3:17:19 PM
G - Powering to another new 52-week high with today's 4th consecutive gain, getting extended from its prior base. Found prompt support near its 50 DMA line last week as shown in the latest FSU analysis with greater detail including annotated daily and weekly graphs.
>>> FEATURED STOCK ARTICLE : Perched Near All-Time High After Testing Support - 11/8/2013
View all notes |
Set NEW NOTE alert |
CANSLIM.net Company Profile |
SEC
News |
Chart |
Request a new note
C
A N
S L
I M
|
SSNC
-
NASDAQ
S S & C Technologies
COMPUTER SOFTWARE and SERVICES - Application Software
|
$40.21
|
+0.01
0.02% |
$40.41
|
317,082
70.29% of 50 DAV
50 DAV is 451,100
|
$41.75
-3.69%
|
10/22/2013
|
$39.17
|
PP = $40.04
|
|
MB = $42.04
|
Most Recent Note - 11/12/2013 6:44:01 PM
Y - Volume totals have been cooling while consolidating since its 11/04/13 breakout gain. See the latest FSU analysis for more details and new annotated daily and weekly graphs.
>>> FEATURED STOCK ARTICLE : Volume Totals Cooling Following Recent Volume-Driven Breakout - 11/12/2013
View all notes |
Set NEW NOTE alert |
CANSLIM.net Company Profile |
SEC
News |
Chart |
Request a new note
C
A N
S L
I M
|
SSYS
-
NASDAQ
Stratasys Ltd
COMPUTER HARDWARE - Computer Peripherals
|
$125.35
|
+1.08
0.87% |
$126.60
|
866,346
67.98% of 50 DAV
50 DAV is 1,274,500
|
$128.75
-2.64%
|
10/11/2013
|
$102.94
|
PP = $105.38
|
|
MB = $110.65
|
Most Recent Note - 11/12/2013 12:18:14 PM
G - Pulling back today from a new 52-week high following a spurt of volume-driven gains. It is extended from a sound base. Reported earnings +13% on +153% sales revenues, below the +25% minimum earnings guideline (C criteria) raising fundamental concerns.
>>> FEATURED STOCK ARTICLE : Faltering and Relative Strength Waning After Offering - 10/9/2013
View all notes |
Set NEW NOTE alert |
CANSLIM.net Company Profile |
SEC
News |
Chart |
Request a new note
C
A N
S L
I M
|
STMP
-
NASDAQ
Stamps.Com Inc
INTERNET - Internet Software and Services
|
$48.30
|
+1.00
2.11% |
$48.34
|
69,577
61.25% of 50 DAV
50 DAV is 113,600
|
$49.40
-2.23%
|
9/24/2013
|
$45.54
|
PP = $46.57
|
|
MB = $48.90
|
Most Recent Note - 11/11/2013 5:49:57 PM
G - Held its ground above its 50 DMA line recently, where more damaging losses would raise greater concerns. Fundamental concerns were raised by waning sales revenues and earnings increases. Reported earnings +24% on +7% sales revenues for the Sep '13 quarter, just below the +25% minimum earnings guideline (C criteria).
>>> FEATURED STOCK ARTICLE : Fundamental Flaw May Prompt Disciplined Investors to Look Elsewhere - 10/31/2013
View all notes |
Set NEW NOTE alert |
CANSLIM.net Company Profile |
SEC
News |
Chart |
Request a new note
C
A N
S L
I M
|
ULTI
-
NASDAQ
Ultimate Software Group
INTERNET - Internet Software and Services
|
$158.80
|
+0.26
0.16% |
$159.04
|
65,542
43.99% of 50 DAV
50 DAV is 149,000
|
$162.88
-2.50%
|
10/16/2013
|
$142.95
|
PP = $151.18
|
|
MB = $158.74
|
Most Recent Note - 11/11/2013 5:54:41 PM
Y - Still consolidating in an orderly fashion below its "max buy" level, remaining above prior highs defining initial support.
>>> FEATURED STOCK ARTICLE : Hovering Less Than -5% From 52-Week High - 10/17/2013
View all notes |
Set NEW NOTE alert |
CANSLIM.net Company Profile |
SEC
News |
Chart |
Request a new note
C
A N
S L
I M
|
Symbol/Exchange
Company Name
Industry Group |
PRICE |
CHANGE
(%Change) |
Day High |
Volume
(% DAV)
(% 50 day avg vol) |
52 Wk Hi
% From Hi |
Featured
Date |
Price
Featured |
Pivot Featured |
|
Max Buy |
VRX
-
NYSE
Valeant Pharmaceuticals
DRUGS - Drug Manufacturers - Other
|
$107.15
|
+1.41
1.33% |
$107.30
|
1,038,086
88.74% of 50 DAV
50 DAV is 1,169,800
|
$115.40
-7.15%
|
9/11/2013
|
$100.26
|
PP = $105.50
|
|
MB = $110.78
|
Most Recent Note - 11/12/2013 6:57:11 PM
Y- Volume totals have been light while testing support near prior highs in the $105 area and its 50 DMA line. More damaging volume-driven losses may trigger technical sell signals. Recently reported earnings +24% on +74% sales revenues for the Sep '13 quarter, a notch below the +25% minimum guideline (C criteria).
>>> FEATURED STOCK ARTICLE : Found Support Above Prior Highs on Pullback - 10/10/2013
View all notes |
Set NEW NOTE alert |
CANSLIM.net Company Profile |
SEC
News |
Chart |
Request a new note
C
A N
S L
I M
|
YNDX
-
NASDAQ
Yandex N V Class A
INTERNET - Internet Information Providers
|
$37.09
|
+0.78
2.15% |
$37.13
|
1,425,200
52.10% of 50 DAV
50 DAV is 2,735,600
|
$42.00
-11.69%
|
9/5/2013
|
$34.24
|
PP = $34.79
|
|
MB = $36.53
|
Most Recent Note - 11/13/2013 3:37:06 PM
G - Holding its ground near its 50 DMA line, but posting recent gains with very light volume. Prior low ($34.31 on 10/08/13) defines the next chart support level to watch.
>>> FEATURED STOCK ARTICLE : Consolidating After Getting Extended From Sound Base - 10/28/2013
View all notes |
Set NEW NOTE alert |
CANSLIM.net Company Profile |
SEC
News |
Chart |
Request a new note
C
A N
S L
I M
|
|
|
|
THESE ARE NOT BUY RECOMMENDATIONS!
Comments contained in the body of this report are technical
opinions only. The material herein has been obtained
from sources believed to be reliable and accurate, however,
its accuracy and completeness cannot be guaranteed.
This site is not an investment advisor, hence it does
not endorse or recommend any securities or other investments.
Any recommendation contained in this report may not
be suitable for all investors and it is not to be deemed
an offer or solicitation on our part with respect to
the purchase or sale of any securities. All trademarks,
service marks and trade names appearing in this report
are the property of their respective owners, and are
likewise used for identification purposes only.
This report is a service available
only to active Paid Premium Members.
You may opt-out of receiving report notifications
at any time. Questions or comments may be submitted
by writing to Premium Membership Services 665 S.E. 10 Street, Suite 201 Deerfield Beach, FL 33441-5634 or by calling 1-800-965-8307
or 954-785-1121.
|
|
|

