You are not logged in.
This means you
CAN ONLY VIEW reports that were published prior to Monday, April 14, 2025.
You
MUST UPGRADE YOUR MEMBERSHIP if you want to see any current reports.
AFTER MARKET UPDATE - WEDNESDAY, NOVEMBER 12TH, 2014
Previous After Market Report Next After Market Report >>>
|
|
|
|
DOW |
-2.70 |
17,612.20 |
-0.02% |
|
Volume |
702,210,140 |
+17% |
|
Volume |
1,624,045,910 |
+7% |
|
NASDAQ |
+14.57 |
4,675.13 |
+0.31% |
|
Advancers |
1,678 |
52% |
|
Advancers |
1,683 |
59% |
|
S&P 500 |
-1.43 |
2,038.25 |
-0.07% |
|
Decliners |
1,428 |
44% |
|
Decliners |
1,051 |
37% |
|
Russell 2000 |
+6.51 |
1,186.47 |
+0.55% |
|
52 Wk Highs |
138 |
|
|
52 Wk Highs |
133 |
|
|
S&P 600 |
+4.50 |
686.06 |
+0.66% |
|
52 Wk Lows |
40 |
|
|
52 Wk Lows |
54 |
|
|
 |
Major Averages Ended Mixed After Early Weakness
Kenneth J. Gruneisen - Passed the CAN SLIM® Master's Exam
The major averages finished mixed on Wednesday. The volume totals were reported higher than the prior session totals on the NYSE and on the Nasdaq exchange. Breadth was positive as advancers led decliners by an 8-7 margin on the NYSE while advancers led decliners by a 3-2 margin on the Nasdaq exchange. There were 75 high-ranked companies from the CANSLIM.net Leaders List that made new 52-week highs and appeared on the CANSLIM.net BreakOuts Page, down from the prior session total of 89 stocks. New 52-week highs outnumbered new 52-week lows on the NYSE and on the Nasdaq exchange. There were gains for 5 of the 12 high-ranked companies currently on the Featured Stocks Page. Disciplined investors know that new buying efforts may be made under the fact-based investment system only in stocks meeting all key criteria.
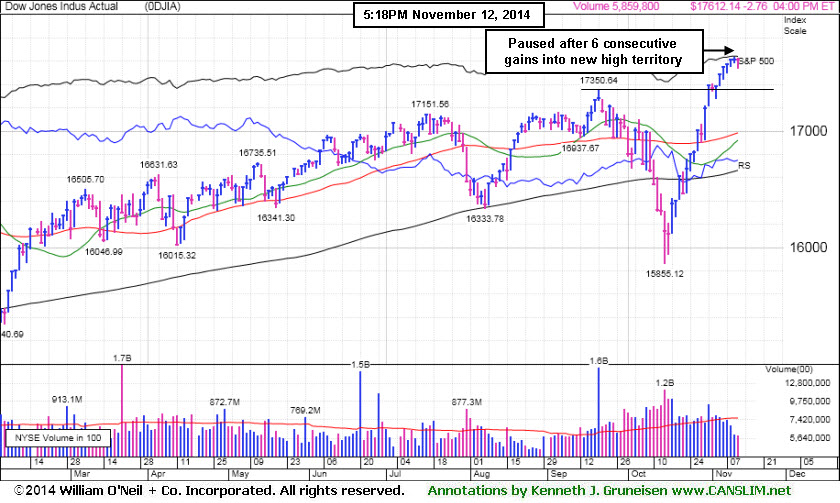
PICTURED: The Dow Jones Industrial Average declined 2 points to 1,7612, breaking a 6 session winning streak.
The major averages erased earlier losses to finish mixed, snapping a streak of record highs for the Dow and S&P 500.The S&P 500 was 1 point lower to 2038. The NASDAQ bucked the trend and gained 14 points to 4,675.
Investors weighed corporate profits and central bank activity. Macy's (M +5.1%) rose after the company's quarterly sales results exceeded estimates. Cisco (CSCO -0.2%) was slightly lower ahead of its earnings announcement after the close. In Europe ECB President Mario Draghi said stimulus measures may not be enough to boost economic growth. Meanwhile both the Bank of England and German officials separately lowered their growth forecasts.
At the close six of 10 sectors in the S&P 500 were in positive territory. Telecom stocks were a relative outperformer as Verizon (VZ +0.4%) edged higher. Utilities were down the most as Exelon (EXC -3.4%) fell. Financials were under pressure. JP Morgan Chase & Co (JPM -1.3%) and Citigroup (C -0.7%) fell after reports that European regulators fined both banks.
Treasuries finished lower, following an auction of $24 billion in 10-year notes. The benchmark 10-year security fell 1/32 to yield 2.37%. In commodities WTI crude on the NYMEX declined -1.5% to $76.80 per barrel.
Large gains on 10/21/14 backed by higher volume totals while leadership (stocks hitting new 52-week highs) expanded met the definition of a "follow-through day" confirming a new uptrend for the market (M criteria). The S&P 500 Index, Nasdaq Composite Index, and the Dow Jones Industrial Average have collectively rebounded above their respective 50-day and 200-day moving average (DMA) lines, technically putting the market in a healthier stance.
The CANSLIM.net Featured Stocks Page shows the most action-worthy candidates and their latest notes and a Headline Link directs members to the latest detailed analysis with data-packed graphs annotated by a Certified expert along with links to additional resources. The Premium Member Homepage includes "dynamic archives" to all prior pay reports published.
|
 Kenneth J. Gruneisen started out as a licensed stockbroker in August 1987, a couple of months prior to the historic stock market crash that took the Dow Jones Industrial Average down -22.6% in a single day. He has published daily fact-based fundamental and technical analysis on high-ranked stocks online for two decades. Through FACTBASEDINVESTING.COM, Kenneth provides educational articles, news, market commentary, and other information regarding proven investment systems that work in good times and bad.
Comments contained in the body of this report are technical opinions only and are not necessarily those of Gruneisen Growth Corp. The material herein has been obtained from sources believed to be reliable and accurate, however, its accuracy and completeness cannot be guaranteed. Our firm, employees, and customers may effect transactions, including transactions contrary to any recommendation herein, or have positions in the securities mentioned herein or options with respect thereto. Any recommendation contained in this report may not be suitable for all investors and it is not to be deemed an offer or solicitation on our part with respect to the purchase or sale of any securities. |
|
 |
Retail Index Rose While Other Groups Were Indecisive
Kenneth J. Gruneisen - Passed the CAN SLIM® Master's Exam
The Retail Index ($RLX +0.64%) was a positive influence on the major averages, however other industry groups provided little help. Financial shares had a slightly negative bias as the Broker/Dealer Index ($XBD -0.11%) and the Bank Index ($BKX -0.05%) ended slightly in the red. The Biotechnology Index ($BTK +0.09%) and the Networking Index ($NWX +0.22%) both posted small gains while the Semiconductor Index ($SOX -0.10%) finished with a small loss. Energy-related shares fell as the Integrated Oil Index ($XOI -0.94%) and the Oil Services Index ($OSX -0.86%) both lost ground, and the Gold & Silver Index ($XAU -0.24%) also edged lower.
Charts courtesy www.stockcharts.com
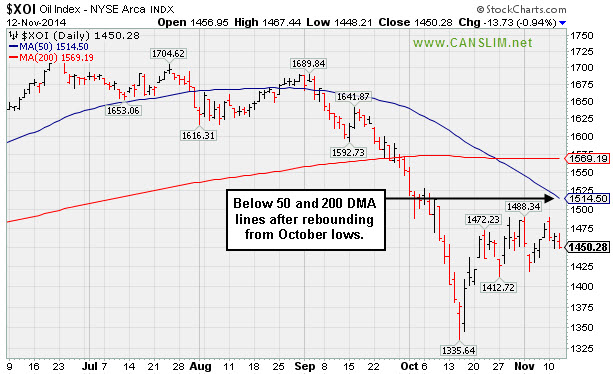
PICTURED: The Integrated Oil Index ($XOI -0.94%) remains below its 50-day and 200-day moving average (DMA) lines after rebounding from its October lows.
| Oil Services |
$OSX |
244.81 |
-2.12 |
-0.86% |
-12.89% |
| Integrated Oil |
$XOI |
1,450.28 |
-13.73 |
-0.94% |
-3.52% |
| Semiconductor |
$SOX |
639.76 |
-0.67 |
-0.10% |
+19.57% |
| Networking |
$NWX |
336.16 |
+0.75 |
+0.22% |
+3.77% |
| Broker/Dealer |
$XBD |
177.64 |
-0.20 |
-0.11% |
+10.64% |
| Retail |
$RLX |
970.27 |
+6.21 |
+0.64% |
+3.24% |
| Gold & Silver |
$XAU |
67.71 |
-0.16 |
-0.24% |
-19.54% |
| Bank |
$BKX |
73.18 |
-0.04 |
-0.05% |
+5.66% |
| Biotech |
$BTK |
3,338.56 |
+2.88 |
+0.09% |
+43.26% |
|
|
|
 |
Loss on Heavy Volume a Sign of Distributional Pressure
Kenneth J. Gruneisen - Passed the CAN SLIM® Master's Exam
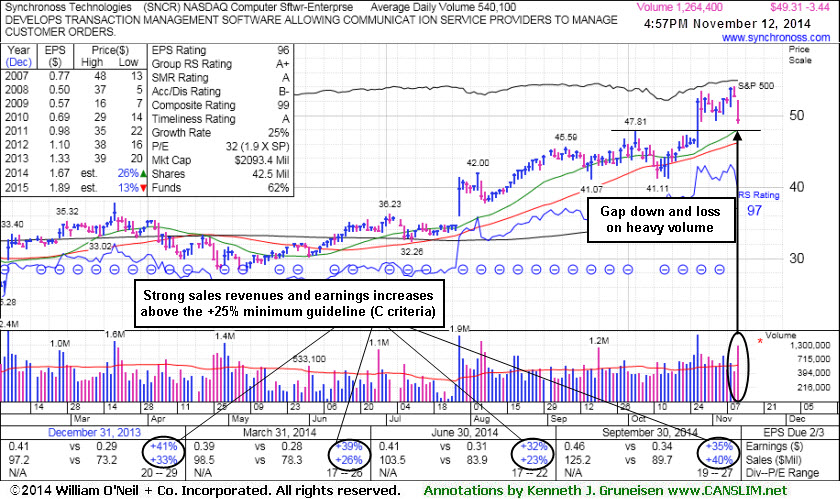
Synchronoss Technologies (SNCR -$3.44 or -6.52% to $49.31) gapped down today for a loss on higher volume, a sign of distributional pressure. Prior highs in the $47 area define initial support to watch above its 50-day moving average (DMA) line ($46.17) on pullbacks. Damaging violations would raise concerns and trigger technical sell signals.
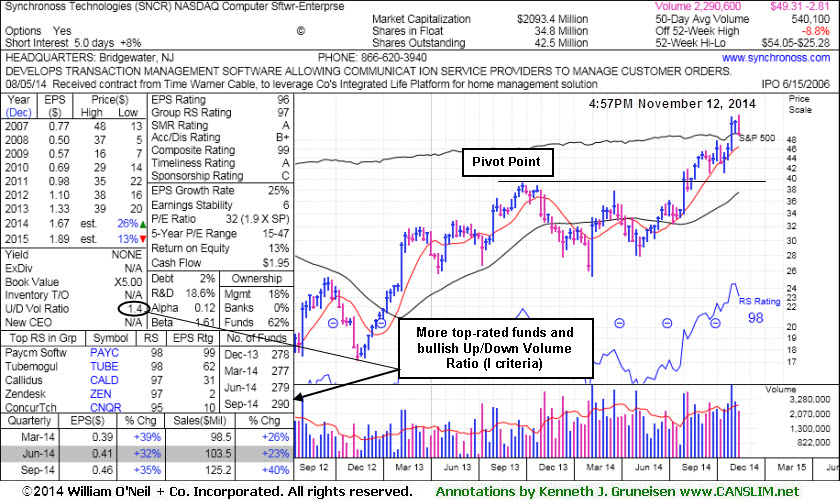
SNCR was last shown in this FSU section on 10/27/14 with annotated graphs under the headline, "No Resistance Remains; Perched at Secondary Buy Point", after highlighted in yellow while perched near its 52-week high with an annotated weekly graph in the earlier mid-day report (read here). It blasted higher on the next session after the high-ranked Computer Software - Enterprise firm reported earnings +35% on +40% sales revenues for the Sep '14 quarter. Prior quarterly earnings had been above the +25% minimum guideline (C criteria) of the fact-based system, and it has a strong annual earnings (A criteria) history.
The number of top-rated funds owning its shares rose from 277 in Mar '14 to 290 in Sep '14, a reassuring sign concerning the I criteria. Its current Up/Down Volume Ratio of 1.4 is an unbiased indication its shares have been under accumulation over the past 50 days.
|
|
|
Color Codes Explained :
Y - Better candidates highlighted by our
staff of experts.
G - Previously featured
in past reports as yellow but may no longer be buyable under the
guidelines.
***Last / Change / Volume data in this table is the closing quote data***
Symbol/Exchange
Company Name
Industry Group |
PRICE |
CHANGE
(%Change) |
Day High |
Volume
(% DAV)
(% 50 day avg vol) |
52 Wk Hi
% From Hi |
Featured
Date |
Price
Featured |
Pivot Featured |
|
Max Buy |
ACT
-
NYSE
Actavis plc
Medical-Generic Drugs
|
$240.62
|
-3.01
-1.24% |
$249.76
|
3,062,130
130.75% of 50 DAV
50 DAV is 2,342,000
|
$254.41
-5.42%
|
6/20/2014
|
$216.53
|
PP = $230.87
|
|
MB = $242.41
|
 Most Recent Note - 11/12/2014 1:05:02 PM
Y - Color code is changed to yellow after pulling back below its "max buy" level. Recent lows near $208 define initial support to watch below its nearby 50 DMA line ($237.90) where damaging violations would raise concerns.
>>> FEATURED STOCK ARTICLE : New Highs Following Deep "V" Shaped Pullback - Not a Sound Base - 11/6/2014
View all notes |
Set NEW NOTE alert |
CANSLIM.net Company Profile |
SEC
News |
Chart |
Request a new note
C
A N
S L
I M


|
AFSI
-
NASDAQ
Amtrust Financial Svcs
INSURANCE - Property and; Casualty Insurance
|
$51.74
|
+1.08
2.13% |
$51.76
|
893,515
92.02% of 50 DAV
50 DAV is 971,000
|
$53.50
-3.29%
|
10/17/2014
|
$45.24
|
PP = $46.02
|
|
MB = $48.32
|
Most Recent Note - 11/11/2014 6:15:32 PM
G - Holding its ground after rallying back toward its 52-week high. Found prompt support at its 50 DMA line following an analyst downgrade. Recent lows near $42 define important near-term support.
>>> FEATURED STOCK ARTICLE : 50-Day Average Acted as Support Following Analyst Downgrade - 11/5/2014
View all notes |
Set NEW NOTE alert |
CANSLIM.net Company Profile |
SEC
News |
Chart |
Request a new note
C
A N
S L
I M
|
ALXN
-
NASDAQ
Alexion Pharmaceuticals
DRUGS - Drug Manufacturers - Other
|
$193.69
|
-1.23
-0.63% |
$195.21
|
613,264
49.98% of 50 DAV
50 DAV is 1,227,000
|
$197.64
-2.00%
|
10/23/2014
|
$184.01
|
PP = $185.53
|
|
MB = $194.81
|
Most Recent Note - 11/12/2014 1:07:08 PM
Y - Stubbornly holding its ground near its 52-week high and near its "max buy" level. Prior highs in the $180 area define initial support to watch on pullbacks.
>>> FEATURED STOCK ARTICLE : New High Close With Gain on Light Volume - 11/10/2014
View all notes |
Set NEW NOTE alert |
CANSLIM.net Company Profile |
SEC
News |
Chart |
Request a new note
C
A N
S L
I M
|
BIDU
-
NASDAQ
Baidu Inc Ads
INTERNET - Internet Information Providers
|
$249.82
|
-0.52
-0.21% |
$251.65
|
2,450,258
63.83% of 50 DAV
50 DAV is 3,839,000
|
$251.00
-0.47%
|
10/30/2014
|
$234.08
|
PP = $231.51
|
|
MB = $243.09
|
Most Recent Note - 11/10/2014 5:43:52 PM
G - Color code is changed to green after a big gain today on slightly above average volume for a new all-time high above its "max buy" level. Prior highs near $230 define near-term support to watch on pullbacks.
>>> FEATURED STOCK ARTICLE : Technical Breakout on Triple Average Volume Following Strong Earnings - 10/30/2014
View all notes |
Set NEW NOTE alert |
CANSLIM.net Company Profile |
SEC
News |
Chart |
Request a new note
C
A N
S L
I M
|
EPAM
-
NYSE
Epam Systems Inc
COMPUTER SOFTWARE and SERVICES - Information Technology Service
|
$47.79
|
+0.17
0.36% |
$47.86
|
151,553
36.52% of 50 DAV
50 DAV is 415,000
|
$50.00
-4.42%
|
10/23/2014
|
$45.21
|
PP = $46.09
|
|
MB = $48.39
|
Most Recent Note - 11/10/2014 5:46:58 PM
Y - Managed a "positive reversal" today after dipping near prior highs in the $44 area defining initial support above its 50 DMA line ($42.49).
>>> FEATURED STOCK ARTICLE : Consolidating Above Prior Highs Following Technical Breakout - 11/11/2014
View all notes |
Set NEW NOTE alert |
CANSLIM.net Company Profile |
SEC
News |
Chart |
Request a new note
C
A N
S L
I M
|
Symbol/Exchange
Company Name
Industry Group |
PRICE |
CHANGE
(%Change) |
Day High |
Volume
(% DAV)
(% 50 day avg vol) |
52 Wk Hi
% From Hi |
Featured
Date |
Price
Featured |
Pivot Featured |
|
Max Buy |
FB
-
NASDAQ
Facebook Inc Cl A
INTERNET
|
$74.72
|
+0.11
0.15% |
$75.14
|
26,496,503
67.31% of 50 DAV
50 DAV is 39,363,000
|
$81.16
-7.93%
|
9/9/2014
|
$76.67
|
PP = $76.84
|
|
MB = $80.68
|
Most Recent Note - 11/10/2014 5:47:51 PM
G - Encountered resistance at its 50 DMA line following a violation on 3 times average volume on 10/29/14 that raised concerns and triggered a technical sell signal.
>>> FEATURED STOCK ARTICLE : Gapped Down Following Latest Strong Earnings Report - 10/29/2014
View all notes |
Set NEW NOTE alert |
CANSLIM.net Company Profile |
SEC
News |
Chart |
Request a new note
C
A N
S L
I M
|
FLT
-
NYSE
Fleetcor Technologies
DIVERSIFIED SERVICES - Business/Management Services
|
$147.40
|
-0.63
-0.43% |
$148.08
|
615,211
86.04% of 50 DAV
50 DAV is 715,000
|
$153.52
-3.99%
|
10/31/2014
|
$148.50
|
PP = $146.29
|
|
MB = $153.60
|
Most Recent Note - 11/10/2014 5:50:08 PM
Y - Holding its ground stubbornly with volume totals cooling after highlighted in yellow in the 10/31/14 mid-day report (read here) clinching a convincing technical buy signal. It remains trading above its pivot point and below its "max buy" level.
>>> FEATURED STOCK ARTICLE : Strong Finish Following Gap Up After Earnings News - 10/31/2014
View all notes |
Set NEW NOTE alert |
CANSLIM.net Company Profile |
SEC
News |
Chart |
Request a new note
C
A N
S L
I M
|
ILMN
-
NASDAQ
Illumina Inc
DRUGS - Biotechnology
|
$186.92
|
-1.12
-0.60% |
$188.59
|
529,802
42.22% of 50 DAV
50 DAV is 1,255,000
|
$197.37
-5.29%
|
10/22/2014
|
$188.77
|
PP = $182.27
|
|
MB = $191.38
|
Most Recent Note - 11/12/2014 1:09:12 PM
Y - Still consolidating above its pivot point and below its "max buy" level. Prior highs near $182 define initial support to watch on pullbacks.
>>> FEATURED STOCK ARTICLE : Consolidating Above Prior Highs Which Define Initial Support - 11/7/2014
View all notes |
Set NEW NOTE alert |
CANSLIM.net Company Profile |
SEC
News |
Chart |
Request a new note
C
A N
S L
I M
|
NBCB
-
NASDAQ
First N B C Bank Hldg
Banks-Southeast
|
$37.95
|
+0.59
1.58% |
$38.14
|
75,834
88.18% of 50 DAV
50 DAV is 86,000
|
$37.83
0.32%
|
10/31/2014
|
$36.31
|
PP = $35.93
|
|
MB = $37.73
|
Most Recent Note - 11/12/2014 1:01:52 PM
G - Color code is changed to green while trading just above its "max buy" level. Held its ground stubbornly following a streak of volume-driven gains. No resistance remains due to overhead supply. Prior highs near $34 define near-term support to watch on pullbacks.
>>> FEATURED STOCK ARTICLE : Financial Firm at 52-Week High Tallied 8th Consecutive Gain - 11/3/2014
View all notes |
Set NEW NOTE alert |
CANSLIM.net Company Profile |
SEC
News |
Chart |
Request a new note
C
A N
S L
I M
|
PANW
-
NYSE
Palo Alto Networks
Computer Sftwr-Security
|
$108.89
|
+0.59
0.54% |
$109.39
|
735,123
32.92% of 50 DAV
50 DAV is 2,232,800
|
$110.16
-1.15%
|
7/30/2014
|
$84.21
|
PP = $85.88
|
|
MB = $90.17
|
Most Recent Note - 11/11/2014 12:27:45 PM
G - Perched at its all-time high and making its 3rd consecutive mid-day report appearance. Its 50 DMA line ($99.87) defines near-term support to watch. Prior notes cautioned members - "Volume totals cooled in recent weeks, a sign that few investors have headed for the exit, however it has not formed a sound base."
>>> FEATURED STOCK ARTICLE : Rebound and Rally Leaves Tech Firm Extended From Base - 10/28/2014
View all notes |
Set NEW NOTE alert |
CANSLIM.net Company Profile |
SEC
News |
Chart |
Request a new note
C
A N
S L
I M
|
Symbol/Exchange
Company Name
Industry Group |
PRICE |
CHANGE
(%Change) |
Day High |
Volume
(% DAV)
(% 50 day avg vol) |
52 Wk Hi
% From Hi |
Featured
Date |
Price
Featured |
Pivot Featured |
|
Max Buy |
SNCR
-
NASDAQ
Synchronoss Technologies
COMPUTER SOFTWARE andamp; SERVICES - Application Software
|
$49.31
|
-3.44
-6.52% |
$52.14
|
1,266,049
234.45% of 50 DAV
50 DAV is 540,000
|
$54.05
-8.77%
|
10/27/2014
|
$46.40
|
PP = $47.81
|
|
MB = $50.20
|
Most Recent Note - 11/12/2014 5:51:44 PM
G - Gapped down today for a loss on higher volume, a sign of distributional pressure. Prior highs in the $47 area define initial support to watch above its 50 DMA line ($46.17) on pullbacks. See the latest FSU analysis for more details and new annotated graphs.
>>> FEATURED STOCK ARTICLE : Loss on Heavy Volume a Sign of Distributional Pressure - 11/12/2014
View all notes |
Set NEW NOTE alert |
CANSLIM.net Company Profile |
SEC
News |
Chart |
Request a new note
C
A N
S L
I M
|
STRT
-
NASDAQ
Strattec Security Corp
AUTOMOTIVE - Auto Parts
|
$103.00
|
-0.90
-0.87% |
$106.28
|
19,881
76.47% of 50 DAV
50 DAV is 26,000
|
$109.44
-5.88%
|
9/19/2014
|
$86.06
|
PP = $89.97
|
|
MB = $94.47
|
Most Recent Note - 11/10/2014 5:52:07 PM
G - Stubbornly holding its ground near its 52-week high, extended from its prior base after volume-driven gains. Prior highs in the $88 area define important near-term support to watch above its 50 DMA line ($87.27).
>>> FEATURED STOCK ARTICLE : Stock With Small Supply Quickly Got Extended From Prior Base - 11/4/2014
View all notes |
Set NEW NOTE alert |
CANSLIM.net Company Profile |
SEC
News |
Chart |
Request a new note
C
A N
S L
I M
|
|
|
|
THESE ARE NOT BUY RECOMMENDATIONS!
Comments contained in the body of this report are technical
opinions only. The material herein has been obtained
from sources believed to be reliable and accurate, however,
its accuracy and completeness cannot be guaranteed.
This site is not an investment advisor, hence it does
not endorse or recommend any securities or other investments.
Any recommendation contained in this report may not
be suitable for all investors and it is not to be deemed
an offer or solicitation on our part with respect to
the purchase or sale of any securities. All trademarks,
service marks and trade names appearing in this report
are the property of their respective owners, and are
likewise used for identification purposes only.
This report is a service available
only to active Paid Premium Members.
You may opt-out of receiving report notifications
at any time. Questions or comments may be submitted
by writing to Premium Membership Services 665 S.E. 10 Street, Suite 201 Deerfield Beach, FL 33441-5634 or by calling 1-800-965-8307
or 954-785-1121.
|
|
|

