You are not logged in.
This means you
CAN ONLY VIEW reports that were published prior to Monday, April 14, 2025.
You
MUST UPGRADE YOUR MEMBERSHIP if you want to see any current reports.
AFTER MARKET UPDATE - TUESDAY, NOVEMBER 11TH, 2014
Previous After Market Report Next After Market Report >>>
|
|
|
|
DOW |
+1.16 |
17,614.90 |
+0.01% |
|
Volume |
599,460,590 |
-14% |
|
Volume |
1,521,497,730 |
-11% |
|
NASDAQ |
+8.94 |
4,660.56 |
+0.19% |
|
Advancers |
1,578 |
49% |
|
Advancers |
1,267 |
45% |
|
S&P 500 |
+1.42 |
2,039.68 |
+0.07% |
|
Decliners |
1,483 |
46% |
|
Decliners |
1,446 |
51% |
|
Russell 2000 |
+0.39 |
1,179.96 |
+0.03% |
|
52 Wk Highs |
202 |
|
|
52 Wk Highs |
117 |
|
|
S&P 600 |
+0.17 |
681.56 |
+0.02% |
|
52 Wk Lows |
36 |
|
|
52 Wk Lows |
51 |
|
|
 |
Indices' Quiet Gains Hit New Records on Veterans Day
Kenneth J. Gruneisen - Passed the CAN SLIM® Master's Exam
The major averages finished just slightly higher on Tuesday. The volume totals were reported lighter than the prior session total on the NYSE and on the Nasdaq exchange, impacted by the fact it was Veterans Day and the bond market was closed. Breadth was mixed as advancers narrowly led decliners by about a 3-2 margin on the NYSE while decliners had a slight lead over advancers on the Nasdaq exchange. There were 89 high-ranked companies from the CANSLIM.net Leaders List that made new 52-week highs and appeared on the CANSLIM.net BreakOuts Page, down from the prior session total of 97 stocks. New 52-week highs outnumbered new 52-week lows on the NYSE and on the Nasdaq exchange. There were gains for only 3 of the 12 high-ranked companies currently on the Featured Stocks Page, a list which recently gained several new companies as broader market conditions improved. Disciplined investors know that new buying efforts may be made under the fact-based investment system only in stocks meeting all key criteria.
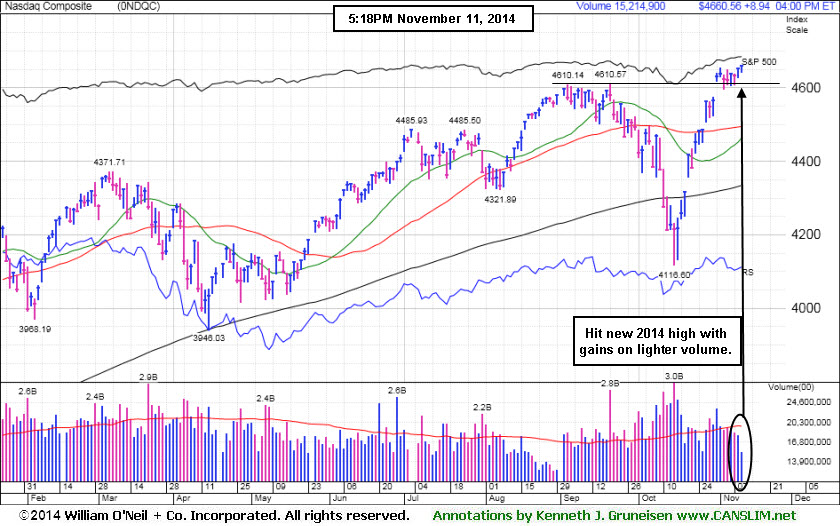
PICTURED: The Nasdaq Composite Index advanced 8 points to 4,660, hitting new 2014 highs with gains on lighter volume.
The Dow was up 1 point to 17,614 and the S&P 500 also climbed 1 point to 2,039 as both indices closed at record highs for the fifth straight session.
The major averages toggled between gains and losses as investors focused on corporate earnings with Wal-Mart (WMT ) unofficially ending the season on Thursday. Overall, about 80% of S&P 500 companies beat EPS estimates and 60% topped sales projections, according to Bloomberg. Rackspace (RAX +13.2%) and Vodafone (VOD +5.4%) climbed after both companies exceeded analyst earnings estimates. However, AECOM (ACM -7%) fell following disappointing quarterly sales.
At the close five of the 10 sectors in the S&P 500 were in positive territory. Utilities were off the most as the price of natural gas fell. Duke Energy (DUK -0.2%) inched lower. Materials were the relative outperformer. Shares of Monsanto (MON +1.2%) rose as it formed partnerships with pharmaceutical and chemical companies.
Bond markets were closed in observance of Veterans Day. This week the Treasury Department is expected to auction $42 billion in 10- and 30-year bonds.
Commodities were volatile and closed higher. WTI crude rose +0.2% to $77.54 per barrel on the NYMEX. On the COMEX gold climbed +0.5% to $1,165.00 per ounce.
Large gains on 10/21/14 backed by higher volume totals while leadership (stocks hitting new 52-week highs) expanded met the definition of a "follow-through day" confirming a new uptrend for the market (M criteria). The S&P 500 Index, Nasdaq Composite Index, and the Dow Jones Industrial Average have collectively rebounded above their respective 50-day and 200-day moving average (DMA) lines, technically putting the market in a healthier stance.
The CANSLIM.net Featured Stocks Page shows the most action-worthy candidates and their latest notes and a Headline Link directs members to the latest detailed analysis with data-packed graphs annotated by a Certified expert along with links to additional resources. The Premium Member Homepage includes "dynamic archives" to all prior pay reports published.
|
 Kenneth J. Gruneisen started out as a licensed stockbroker in August 1987, a couple of months prior to the historic stock market crash that took the Dow Jones Industrial Average down -22.6% in a single day. He has published daily fact-based fundamental and technical analysis on high-ranked stocks online for two decades. Through FACTBASEDINVESTING.COM, Kenneth provides educational articles, news, market commentary, and other information regarding proven investment systems that work in good times and bad.
Comments contained in the body of this report are technical opinions only and are not necessarily those of Gruneisen Growth Corp. The material herein has been obtained from sources believed to be reliable and accurate, however, its accuracy and completeness cannot be guaranteed. Our firm, employees, and customers may effect transactions, including transactions contrary to any recommendation herein, or have positions in the securities mentioned herein or options with respect thereto. Any recommendation contained in this report may not be suitable for all investors and it is not to be deemed an offer or solicitation on our part with respect to the purchase or sale of any securities. |
|
 |
Retail and Biotech Indexes Posted Small Gains
Kenneth J. Gruneisen - Passed the CAN SLIM® Master's Exam
The tech sector saw losses from the Networking Index ($NWX -0.53%) and the Semiconductor Index ($SOX -0.28%) while the Biotechnology Index ($BTK +0.56%) posted a modest gain. The Retail Index ($RLX +0.53%) had a positive influence on the major averages. Financial shares were mixed as the Broker/Dealer Index ($XBD +0.21%) edged higher while the Bank Index ($BKX -0.25%) edged lower. Energy-related shares had a slightly positive bias as the Integrated Oil Index ($XOI +0.12%) and the Oil Services Index ($OSX +0.37%) posted small gains. The Gold & Silver Index ($XAU +4.27%) was a standout gainer, continuing with its wider than usual intra-day swings.
Charts courtesy www.stockcharts.com
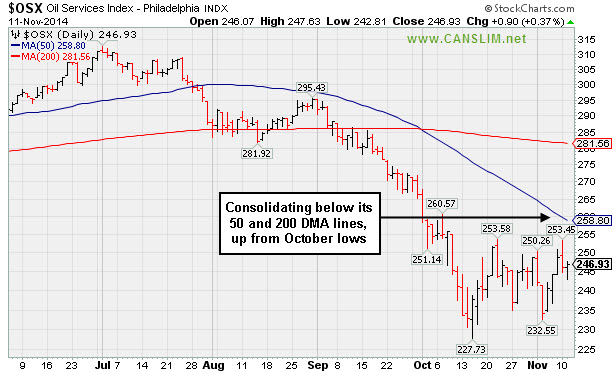
PICTURED: The Oil Services Index ($OSX +0.37%) is consolidating below its 50-day and 200-day moving average (DMA) lines, up from its October lows.
| Oil Services |
$OSX |
246.93 |
+0.90 |
+0.37% |
-12.13% |
| Integrated Oil |
$XOI |
1,464.01 |
+1.82 |
+0.12% |
-2.60% |
| Semiconductor |
$SOX |
640.43 |
-1.82 |
-0.28% |
+19.70% |
| Networking |
$NWX |
335.42 |
-1.80 |
-0.53% |
+3.54% |
| Broker/Dealer |
$XBD |
177.84 |
+0.38 |
+0.21% |
+10.76% |
| Retail |
$RLX |
964.06 |
+5.12 |
+0.53% |
+2.58% |
| Gold & Silver |
$XAU |
67.87 |
+2.78 |
+4.27% |
-19.35% |
| Bank |
$BKX |
73.22 |
-0.18 |
-0.25% |
+5.72% |
| Biotech |
$BTK |
3,335.68 |
+18.42 |
+0.56% |
+43.14% |
|
|
|
 |
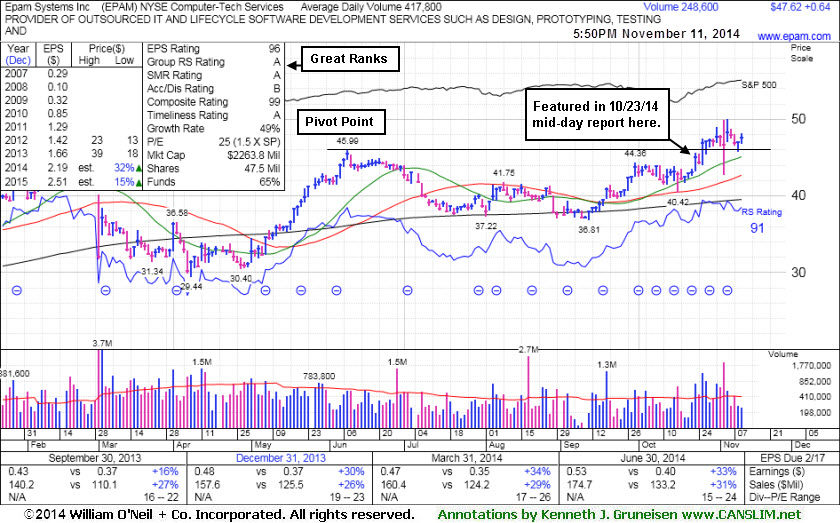
Consolidating Above Prior Highs Following Technical Breakout
Kenneth J. Gruneisen - Passed the CAN SLIM® Master's Exam
Epam Systems Inc (EPAM +$0.64 or +1.36% to $47.62) has been quietly holding its ground after retesting prior highs in the $44 area defining initial support above its 50-day moving average (DMA) line ($42.70). Subsequent losses leading to a close below its old high close ($45.51 on 6/09/14) would raise concerns while completely negating the recent technical breakout.
It was last shown in this FSU section on 10/24/14 with annotated graphs under the headline, "Pulled Back After Challenging Prior Highs", after highlighted in yellow in the 10/23/14 mid-day report (read here). Subsequent volume-driven gains above the pivot point cited triggered a technical buy signal.
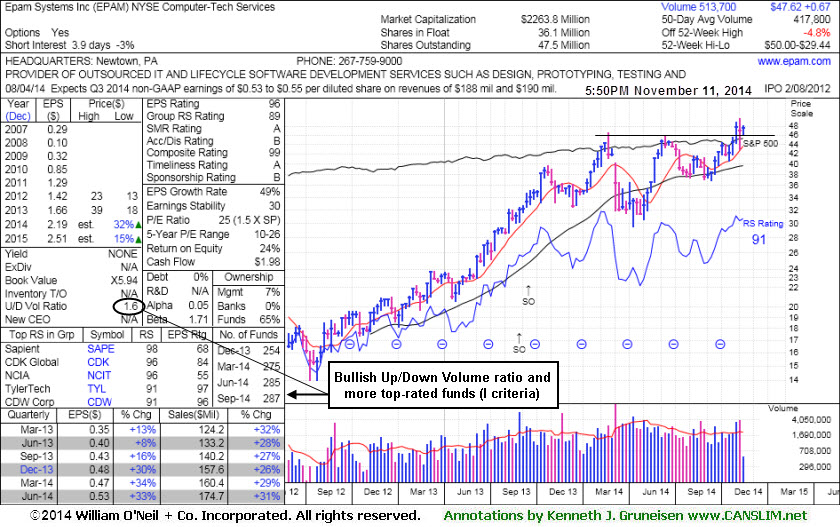
The high-ranked Computer - Tech Services firm reported earnings for the Sep '14 quarter above views (not yet shown on the chart as of today) and also gave upbeat sales guidance for the current quarter. It had previously reported earnings +33% on +31% sales revenues for the Jun '14 quarter, a 3rd consecutive quarter with earnings above the +25% guideline, making it a better match concerning the C criteria. Annual earnings growth (A criteria) has been strong.
It completed Secondary Offerings 8/30/13 and 9/17/13. Its current Up/Down Volume Ratio of 1.6 is an unbiased indication its shares have been under accumulation in the past 50 days. The number of top-rated funds owning its shares rose from 254 in Dec '13 to 287 in Sep '14, a reassuring sign concerning the I criteria. Its small supply of only 36.1 million shares (S criteria) can contribute to greater volatility in the event of institutional buying or selling.
|
|
|
Color Codes Explained :
Y - Better candidates highlighted by our
staff of experts.
G - Previously featured
in past reports as yellow but may no longer be buyable under the
guidelines.
***Last / Change / Volume data in this table is the closing quote data***
Symbol/Exchange
Company Name
Industry Group |
PRICE |
CHANGE
(%Change) |
Day High |
Volume
(% DAV)
(% 50 day avg vol) |
52 Wk Hi
% From Hi |
Featured
Date |
Price
Featured |
Pivot Featured |
|
Max Buy |
ACT
-
NYSE
Actavis plc
Medical-Generic Drugs
|
$243.63
|
-2.10
-0.85% |
$246.82
|
2,111,281
90.61% of 50 DAV
50 DAV is 2,330,000
|
$254.41
-4.24%
|
6/20/2014
|
$216.53
|
PP = $230.87
|
|
MB = $242.41
|
Most Recent Note - 11/6/2014 5:38:55 PM
G - Perched at its 52-week high today following 2 volume-driven gains, extended from any sound base. Recent lows near $208 define initial support to watch below its 50 DMA line ($236) on pullbacks. See the latest FSU analysis for more details and new annotated graphs.
>>> FEATURED STOCK ARTICLE : New Highs Following Deep "V" Shaped Pullback - Not a Sound Base - 11/6/2014
View all notes |
Set NEW NOTE alert |
CANSLIM.net Company Profile |
SEC
News |
Chart |
Request a new note
C
A N
S L
I M


|
AFSI
-
NASDAQ
Amtrust Financial Svcs
INSURANCE - Property and; Casualty Insurance
|
$50.66
|
+0.12
0.24% |
$51.38
|
850,583
87.96% of 50 DAV
50 DAV is 967,000
|
$53.50
-5.31%
|
10/17/2014
|
$45.24
|
PP = $46.02
|
|
MB = $48.32
|
 Most Recent Note - 11/11/2014 6:15:32 PM
G - Holding its ground after rallying back toward its 52-week high. Found prompt support at its 50 DMA line following an analyst downgrade. Recent lows near $42 define important near-term support.
>>> FEATURED STOCK ARTICLE : 50-Day Average Acted as Support Following Analyst Downgrade - 11/5/2014
View all notes |
Set NEW NOTE alert |
CANSLIM.net Company Profile |
SEC
News |
Chart |
Request a new note
C
A N
S L
I M
|
ALXN
-
NASDAQ
Alexion Pharmaceuticals
DRUGS - Drug Manufacturers - Other
|
$194.92
|
-0.88
-0.45% |
$197.00
|
762,372
62.08% of 50 DAV
50 DAV is 1,228,000
|
$197.64
-1.38%
|
10/23/2014
|
$184.01
|
PP = $185.53
|
|
MB = $194.81
|
Most Recent Note - 11/6/2014 5:41:54 PM
Y - Managed a best-ever close with today's gain on slightly higher than average volume. Prior highs in the $180 area define initial support to watch on pullbacks.
>>> FEATURED STOCK ARTICLE : New High Close With Gain on Light Volume - 11/10/2014
View all notes |
Set NEW NOTE alert |
CANSLIM.net Company Profile |
SEC
News |
Chart |
Request a new note
C
A N
S L
I M
|
BIDU
-
NASDAQ
Baidu Inc Ads
INTERNET - Internet Information Providers
|
$250.34
|
+2.76
1.11% |
$251.00
|
3,550,459
91.72% of 50 DAV
50 DAV is 3,871,000
|
$247.70
1.07%
|
10/30/2014
|
$234.08
|
PP = $231.51
|
|
MB = $243.09
|
Most Recent Note - 11/10/2014 5:43:52 PM
G - Color code is changed to green after a big gain today on slightly above average volume for a new all-time high above its "max buy" level. Prior highs near $230 define near-term support to watch on pullbacks.
>>> FEATURED STOCK ARTICLE : Technical Breakout on Triple Average Volume Following Strong Earnings - 10/30/2014
View all notes |
Set NEW NOTE alert |
CANSLIM.net Company Profile |
SEC
News |
Chart |
Request a new note
C
A N
S L
I M
|
EPAM
-
NYSE
Epam Systems Inc
COMPUTER SOFTWARE and SERVICES - Information Technology Service
|
$47.62
|
+0.64
1.36% |
$48.20
|
248,688
59.64% of 50 DAV
50 DAV is 417,000
|
$50.00
-4.76%
|
10/23/2014
|
$45.21
|
PP = $46.09
|
|
MB = $48.39
|
Most Recent Note - 11/10/2014 5:46:58 PM
Y - Managed a "positive reversal" today after dipping near prior highs in the $44 area defining initial support above its 50 DMA line ($42.49).
>>> FEATURED STOCK ARTICLE : Consolidating Above Prior Highs Following Technical Breakout - 11/11/2014
View all notes |
Set NEW NOTE alert |
CANSLIM.net Company Profile |
SEC
News |
Chart |
Request a new note
C
A N
S L
I M
|
Symbol/Exchange
Company Name
Industry Group |
PRICE |
CHANGE
(%Change) |
Day High |
Volume
(% DAV)
(% 50 day avg vol) |
52 Wk Hi
% From Hi |
Featured
Date |
Price
Featured |
Pivot Featured |
|
Max Buy |
FB
-
NASDAQ
Facebook Inc Cl A
INTERNET
|
$74.61
|
-0.39
-0.52% |
$74.98
|
18,715,957
47.16% of 50 DAV
50 DAV is 39,688,000
|
$81.16
-8.07%
|
9/9/2014
|
$76.67
|
PP = $76.84
|
|
MB = $80.68
|
Most Recent Note - 11/10/2014 5:47:51 PM
G - Encountered resistance at its 50 DMA line following a violation on 3 times average volume on 10/29/14 that raised concerns and triggered a technical sell signal.
>>> FEATURED STOCK ARTICLE : Gapped Down Following Latest Strong Earnings Report - 10/29/2014
View all notes |
Set NEW NOTE alert |
CANSLIM.net Company Profile |
SEC
News |
Chart |
Request a new note
C
A N
S L
I M
|
FLT
-
NYSE
Fleetcor Technologies
DIVERSIFIED SERVICES - Business/Management Services
|
$148.03
|
-1.87
-1.25% |
$150.18
|
524,773
73.50% of 50 DAV
50 DAV is 714,000
|
$153.52
-3.58%
|
10/31/2014
|
$148.50
|
PP = $146.29
|
|
MB = $153.60
|
Most Recent Note - 11/10/2014 5:50:08 PM
Y - Holding its ground stubbornly with volume totals cooling after highlighted in yellow in the 10/31/14 mid-day report (read here) clinching a convincing technical buy signal. It remains trading above its pivot point and below its "max buy" level.
>>> FEATURED STOCK ARTICLE : Strong Finish Following Gap Up After Earnings News - 10/31/2014
View all notes |
Set NEW NOTE alert |
CANSLIM.net Company Profile |
SEC
News |
Chart |
Request a new note
C
A N
S L
I M
|
ILMN
-
NASDAQ
Illumina Inc
DRUGS - Biotechnology
|
$188.04
|
-0.23
-0.12% |
$189.50
|
710,225
56.41% of 50 DAV
50 DAV is 1,259,000
|
$197.37
-4.73%
|
10/22/2014
|
$188.77
|
PP = $182.27
|
|
MB = $191.38
|
Most Recent Note - 11/7/2014 6:00:16 PM
Y - Color code was changed to yellow after dipping below its "max buy" level. Prior highs near $182 define initial support to watch on pullbacks. See the latest FSU analysis for more details and new annotated graphs.
>>> FEATURED STOCK ARTICLE : Consolidating Above Prior Highs Which Define Initial Support - 11/7/2014
View all notes |
Set NEW NOTE alert |
CANSLIM.net Company Profile |
SEC
News |
Chart |
Request a new note
C
A N
S L
I M
|
NBCB
-
NASDAQ
First N B C Bank Hldg
Banks-Southeast
|
$37.36
|
-0.05
-0.13% |
$37.78
|
62,099
70.57% of 50 DAV
50 DAV is 88,000
|
$37.83
-1.24%
|
10/31/2014
|
$36.31
|
PP = $35.93
|
|
MB = $37.73
|
Most Recent Note - 11/5/2014 6:30:11 PM
Y - Pulled back today on higher (near average) volume following 8 consecutive gains. No resistance remains due to overhead supply. Highlighted in yellow in the 10/31/14 mid-day report (read here). Prior highs near $34 define near-term support to watch on pullbacks.
>>> FEATURED STOCK ARTICLE : Financial Firm at 52-Week High Tallied 8th Consecutive Gain - 11/3/2014
View all notes |
Set NEW NOTE alert |
CANSLIM.net Company Profile |
SEC
News |
Chart |
Request a new note
C
A N
S L
I M
|
PANW
-
NYSE
Palo Alto Networks
Computer Sftwr-Security
|
$108.30
|
-0.72
-0.66% |
$109.84
|
1,016,342
44.14% of 50 DAV
50 DAV is 2,302,700
|
$110.16
-1.69%
|
7/30/2014
|
$84.21
|
PP = $85.88
|
|
MB = $90.17
|
Most Recent Note - 11/11/2014 12:27:45 PM
G - Perched at its all-time high and making its 3rd consecutive mid-day report appearance. Its 50 DMA line ($99.87) defines near-term support to watch. Prior notes cautioned members - "Volume totals cooled in recent weeks, a sign that few investors have headed for the exit, however it has not formed a sound base."
>>> FEATURED STOCK ARTICLE : Rebound and Rally Leaves Tech Firm Extended From Base - 10/28/2014
View all notes |
Set NEW NOTE alert |
CANSLIM.net Company Profile |
SEC
News |
Chart |
Request a new note
C
A N
S L
I M
|
Symbol/Exchange
Company Name
Industry Group |
PRICE |
CHANGE
(%Change) |
Day High |
Volume
(% DAV)
(% 50 day avg vol) |
52 Wk Hi
% From Hi |
Featured
Date |
Price
Featured |
Pivot Featured |
|
Max Buy |
SNCR
-
NASDAQ
Synchronoss Technologies
COMPUTER SOFTWARE andamp; SERVICES - Application Software
|
$52.75
|
-0.92
-1.71% |
$54.05
|
426,077
78.61% of 50 DAV
50 DAV is 542,000
|
$54.00
-2.31%
|
10/27/2014
|
$46.40
|
PP = $47.81
|
|
MB = $50.20
|
Most Recent Note - 11/6/2014 5:40:47 PM
G - Matched its best-ever close with today's volume-driven gain. Prior highs in the $47 area define initial support to watch above its 50 DMA line ($45.53) on pullbacks.
>>> FEATURED STOCK ARTICLE : No Resistance Remains; Perched at Secondary Buy Point - 10/27/2014
View all notes |
Set NEW NOTE alert |
CANSLIM.net Company Profile |
SEC
News |
Chart |
Request a new note
C
A N
S L
I M
|
STRT
-
NASDAQ
Strattec Security Corp
AUTOMOTIVE - Auto Parts
|
$103.90
|
-1.67
-1.58% |
$106.44
|
14,905
55.20% of 50 DAV
50 DAV is 27,000
|
$109.44
-5.06%
|
9/19/2014
|
$86.06
|
PP = $89.97
|
|
MB = $94.47
|
Most Recent Note - 11/10/2014 5:52:07 PM
G - Stubbornly holding its ground near its 52-week high, extended from its prior base after volume-driven gains. Prior highs in the $88 area define important near-term support to watch above its 50 DMA line ($87.27).
>>> FEATURED STOCK ARTICLE : Stock With Small Supply Quickly Got Extended From Prior Base - 11/4/2014
View all notes |
Set NEW NOTE alert |
CANSLIM.net Company Profile |
SEC
News |
Chart |
Request a new note
C
A N
S L
I M
|
|
|
|
THESE ARE NOT BUY RECOMMENDATIONS!
Comments contained in the body of this report are technical
opinions only. The material herein has been obtained
from sources believed to be reliable and accurate, however,
its accuracy and completeness cannot be guaranteed.
This site is not an investment advisor, hence it does
not endorse or recommend any securities or other investments.
Any recommendation contained in this report may not
be suitable for all investors and it is not to be deemed
an offer or solicitation on our part with respect to
the purchase or sale of any securities. All trademarks,
service marks and trade names appearing in this report
are the property of their respective owners, and are
likewise used for identification purposes only.
This report is a service available
only to active Paid Premium Members.
You may opt-out of receiving report notifications
at any time. Questions or comments may be submitted
by writing to Premium Membership Services 665 S.E. 10 Street, Suite 201 Deerfield Beach, FL 33441-5634 or by calling 1-800-965-8307
or 954-785-1121.
|
|
|

