You are not logged in.
This means you
CAN ONLY VIEW reports that were published prior to Monday, April 14, 2025.
You
MUST UPGRADE YOUR MEMBERSHIP if you want to see any current reports.
AFTER MARKET UPDATE - THURSDAY, NOVEMBER 12TH, 2009
Previous After Market Report Next After Market Report >>>
|
|
|
|
DOW |
-93.79 |
10,197.47 |
-0.91% |
|
Volume |
1,050,143,280 |
+0% |
|
Volume |
2,219,699,440 |
+17% |
|
NASDAQ |
-17.88 |
2,149.02 |
-0.83% |
|
Advancers |
629 |
20% |
|
Advancers |
653 |
23% |
|
S&P 500 |
-11.27 |
1,087.24 |
-1.03% |
|
Decliners |
2,396 |
77% |
|
Decliners |
2,054 |
73% |
|
Russell 2000 |
-12.39 |
580.32 |
-2.09% |
|
52 Wk Highs |
110 |
|
|
52 Wk Highs |
60 |
|
|
S&P 600 |
-6.67 |
307.68 |
-2.12% |
|
52 Wk Lows |
5 |
|
|
52 Wk Lows |
40 |
|
|
 |
Distributional Pressure and Negative Breadth Weighs Major Averages Down
Adam Sarhan, Contributing Writer,
The major averages ended lower as the US dollar surged on Thursday. Volume, a critical component of institutional demand, was higher on the Nasdaq exchange and near the prior session total on the NYSE. Decliners trumped advancers by about a 4-to-1 ratio on the NYSE and by about a 3-to-1 ratio on the Nasdaq exchange. There were 22 high-ranked companies from the CANSLIM.net Leaders List making a new 52-week high and appearing on the CANSLIM.net BreakOuts Page, less than half of the 47 issues that appeared on the prior session. In terms of new leadership, it was encouraging to see new 52-week highs outnumber new 52-week lows on the NYSE and Nasdaq exchange.
The stock market and a slew of commodities sold off on Thursday as the US dollar rallied. The US dollar rallied against 15 of 16 major currencies after the Federal Deficit soared to a new record of $176.4 billion in October. Elsewhere, billionaire investor Warrent Buffett said the financial panic is over according to Reuters.com.
Stocks sold off after Hewlett-Packard (HPQ -0.60%) announced plans to acquire 3Com (COMS +31.11%). 3Com surged a whopping +31% on the news and enjoyed its single largest advance since 2007 on the $2.7 billion deal. This helped send a slew of computer networking stocks higher.
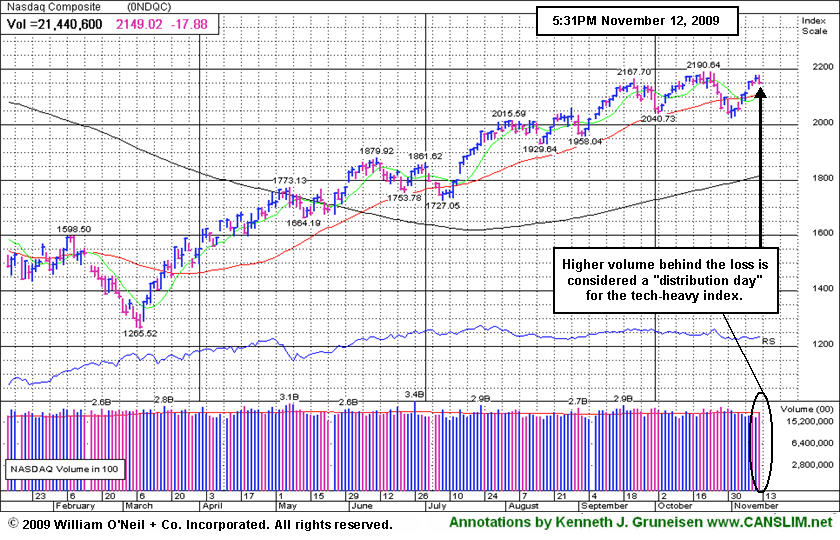
Technically, the S&P 500 Index, which enjoyed a 13-month high yesterday, failed to stay above the 1,100 level for a second straight day. Since late October, 1,100 has served as important resistance for this index. That said, the fact that the S&P 500 remains perched below that level after having rallied +61% from its 12-year low in March and recovering nearly half of its steep decline from its all-time high in October 2007 is a very impressive feat. The S&P 500 currently sports a price-to-earnings (p/e) ratio of 21.81 which is the highest level since 2002. So far, over 80% of S&P 500 companies that reported Q3 results have topped estimates which has helped the market hold up rather well considering that profits were negative for a record ninth consecutive quarter.
What does all this mean for growth investors? Be patient and continue to watch for leading stocks to breakout of sound bases. Do not force a trade and let the market come to you; i.e. do not chase. It is also important to remain cognizant of what is working in this environment: mainly buying very liquid large cap leaders as they bounce off their 50-day moving average line or breakout of sound bases. Some of those leaders include: Apple Computer (AAPL +0.62%), Amazon (AMZN +0.48%), Priceline.com (PCLN +0.18%), Google (GOOG -0.47%), and Baidu Inc. (BIDU -0.78%). The action in these names have served as a great proxy for the overall rally which began in March 2009. Jesse Livermore's timeless advice is true once gain, "Follow The Leaders."
PICTURED: The Nasdaq Composite Index's loss on higher volume indicated distributional pressure is being encountered near recent chart highs.
|
|
|
 |
Commodity-linked and Financial Indexes Drag Market Lower
Kenneth J. Gruneisen - Passed the CAN SLIM® Master's Exam
Commodity-linked areas were some of Thursday's worst decliners as the Gold & Silver Index ($XAU -2.67%), Oil Services Index ($OSX -2.97%), and Integrated Oil Index ($XOI -1.90%) slumped. The Retail Index ($RLX -0.81%) and financial shares were also a negative influence as the Bank Index ($BKX -2.08%) and Broker/Dealer Index ($XBD -1.52%) backpedaled. The Healthcare Index ($HMO -1.71%) and Biotechnology Index ($BTK -1.17%) each lost more than -1%, meanwhile there were smaller losses for the Internet Index ($IIX -0.87%) and Semiconductor Index ($SOX -0.56%).
Charts courtesy www.stockcharts.com
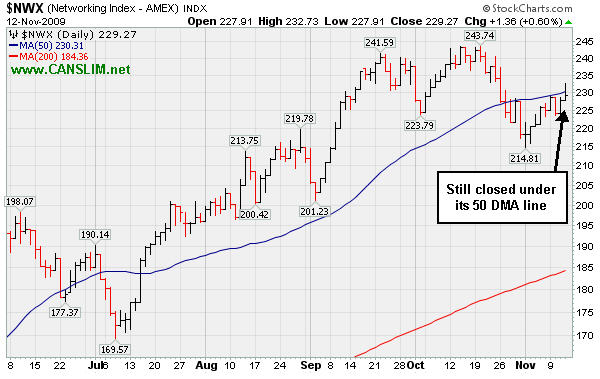
PICTURED: The Networking Index ($NWX +0.60%) was Thursday's only positive index among those regularly followed in this IGW section. Intra-day it traded above its 50-day moving average line but it closed below that important short-term average.
| Oil Services |
$OSX |
196.01 |
-6.00 |
-2.97% |
+61.47% |
| Healthcare |
$HMO |
1,299.20 |
-22.65 |
-1.71% |
+35.31% |
| Integrated Oil |
$XOI |
1,076.45 |
-20.81 |
-1.90% |
+9.88% |
| Semiconductor |
$SOX |
314.00 |
-1.76 |
-0.56% |
+47.99% |
| Networking |
$NWX |
229.27 |
+1.36 |
+0.60% |
+59.34% |
| Internet |
$IIX |
223.41 |
-1.97 |
-0.87% |
+67.01% |
| Broker/Dealer |
$XBD |
117.24 |
-1.81 |
-1.52% |
+51.34% |
| Retail |
$RLX |
400.58 |
-3.28 |
-0.81% |
+43.44% |
| Gold & Silver |
$XAU |
177.35 |
-4.86 |
-2.67% |
+43.20% |
| Bank |
$BKX |
43.30 |
-0.92 |
-2.08% |
-2.30% |
| Biotech |
$BTK |
892.95 |
-10.54 |
-1.17% |
+37.98% |
|
|
|
 |
Pullback After Getting Extended From Last Sound Base
Kenneth J. Gruneisen - Passed the CAN SLIM® Master's Exam
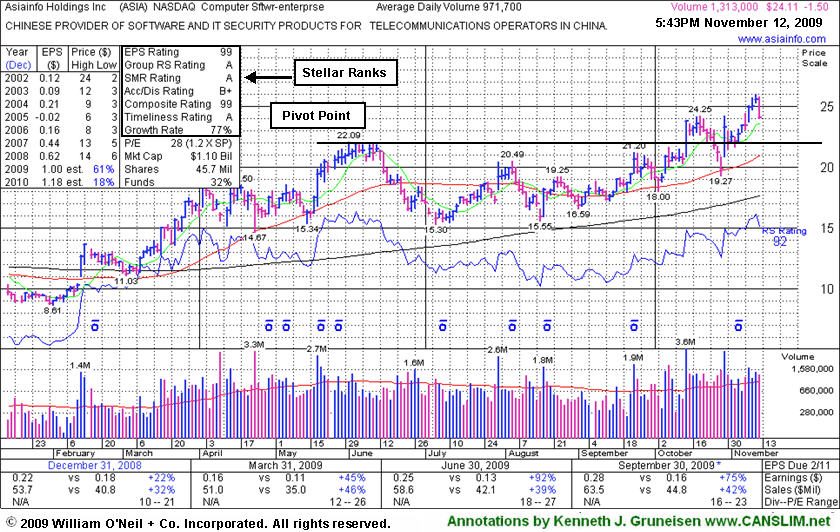
AsiaInfo Holdings, Inc. (ASIA -$1.50 or -5.86% to $24.11) suffered a considerable loss today with above average volume, yet it is still extended from its latest sound base. Gains with above average volume helped it rally to new 2009 highs following a 10/29/09 gap up for a big gain after reporting solid earnings for the period ended Sept 30, 2009 that beat expectations as it also raised guidance. It found prompt support near its 50-day moving average (DMA) line, a textbook chart support level, after a 7 session losing streak with losses on high volume triggered technical sell signals and briefly negated its latest breakout.
Featured 10/14/09 in the mid-day report (read here) as it gapped up for a new 52-week high with 5 times average volume, triggering a technical buy signal by blasting above its pivot point. Disciplined entries and exits are critical to investors' success with the investment system. ASIA was first featured in the August 2009 CANSLIM.net News (read here).
|
|
|
Color Codes Explained :
Y - Better candidates highlighted by our
staff of experts.
G - Previously featured
in past reports as yellow but may no longer be buyable under the
guidelines.
***Last / Change / Volume quote data in this table corresponds with the timestamp on the note***
Symbol/Exchange
Company Name
Industry Group |
Last |
Chg. |
Vol
% DAV |
Date Featured |
Price Featured |
Latest Pivot Point
Featured |
Status |
| Latest Max Buy Price |
ARST
-
|
$25.77
|
-0.22
|
185,317
27% DAV
695,100
|
9/1/2009
(Date
Featured) |
$19.91
(Price
Featured) |
PP = $20.90 |
G |
| MB = $21.95 |
Most Recent Note - 11/12/2009 4:48:39 PM
G - Small loss today on very light volume. Color code remains green while dismissing its 10/15/09 high as a new pivot point, with concern over its "late stage" action without a recent base of substantial length. ARST was first featured in yellow at $19.91 in the 9/01/09 mid-day report with an annotated daily graph (read here).
>>> The latest Featured Stock Update with an annotated graph appeared on 11/6/2009. click here.
|
|
C
A
S
I |
News |
Chart |
SEC
View all notes Alert
me of new notes
Company
Profile
|
ASIA
-
|
$24.11
|
-1.50
|
1,315,724
138% DAV
953,500
|
10/14/2009
(Date
Featured) |
$23.05
(Price
Featured) |
PP = $22.19 |
G |
| MB = $23.30 |
Most Recent Note - 11/12/2009 4:50:29 PM
G - Considerable loss today with above average volume, yet still extended from its latest sound base. Featured 10/14/09 in the mid-day report (read here) as it gapped up for a new 52-week high with 5 times average volume, triggering a technical buy signal by blasting above its pivot point. First featured in the August 2009 CANSLIM.net News (read here).
>>> The latest Featured Stock Update with an annotated graph appeared on 11/12/2009. click here.
|
|
C
A
S
I |
News |
Chart |
SEC
View all notes Alert
me of new notes
Company
Profile
|
BIDU
- NASDAQ
Baidu Inc Ads
INTERNET - Internet Information Providers
|
$427.15
|
-3.36
|
1,608,533
70% DAV
2,312,300
|
9/8/2009
(Date
Featured) |
$351.80
(Price
Featured) |
PP = $368.59 |
G |
| MB = $387.02 |
Most Recent Note - 11/12/2009 4:52:03 PM
G - Paused today with a light volume loss after 7 consecutive gains on light or near average volume, closing -3% from all-time highs. Proved resilient near its 50 DMA line after its 10/27/09 gap down. As recently noted, "Choppy action has not allowed it to form a sound base in recent weeks." BIDU traded up as much as +23% from its price when featured in yellow in the 9/08/09 Mid-Day BreakOuts Report (read here).
>>> The latest Featured Stock Update with an annotated graph appeared on 11/10/2009. click here.
|
|
C
A
S
I |
News |
Chart |
SEC
View all notes Alert
me of new notes
Company
Profile
|
CACC
- NASDAQ
Credit Acceptance Corp
FINANCIAL SERVICES - Credit Services
|
$34.06
|
-0.43
|
45,519
118% DAV
38,500
|
9/29/2009
(Date
Featured) |
$33.48
(Price
Featured) |
PP = $32.60 |
G |
| MB = $34.23 |
Most Recent Note - 11/12/2009 4:53:03 PM
G - Small loss today on slightly higher volume. Consolidating in an orderly fashion above prior chart highs and its 50 DMA line in the $32 area, coinciding as an important support level to watch on pullbacks. The Finance - Consumer/Commercial Loans firm has maintained a great track record of annual and quarterly sales revenues and earnings increases. It was featured on 9/29/09 in yellow in the mid-day report (read here).
>>> The latest Featured Stock Update with an annotated graph appeared on 11/5/2009. click here.
|
|
C
A
S
I |
News |
Chart |
SEC
View all notes Alert
me of new notes
Company
Profile
|
CRM
- NYSE
Salesforce.com Inc
INTERNET - Internet Software & Services
|
$62.90
|
-0.63
|
1,385,805
83% DAV
1,672,100
|
8/16/2009
(Date
Featured) |
$47.12
(Price
Featured) |
PP = $45.59 |
G |
| MB = $47.87 |
Most Recent Note - 11/12/2009 4:53:52 PM
G - Quietly holding its ground near 2009 highs. Found support and rallied up from its 50 DMA line last week after noted technical deterioration raised some concerns. Recent chart lows in the $56 area are important support now, and any violation would raise more serious concerns and trigger more worrisome technical sell signals.
>>> The latest Featured Stock Update with an annotated graph appeared on 11/9/2009. click here.
|
|
C
A
S
I |
News |
Chart |
SEC
View all notes Alert
me of new notes
Company
Profile
|
GMCR
- NASDAQ
Green Mtn Coffee Roastrs
FOOD & BEVERAGE - Processed & Packaged Goods
|
$68.35
|
-7.56
|
7,589,985
680% DAV
1,115,800
|
10/5/2009
(Date
Featured) |
$71.11
(Price
Featured) |
PP = $75.89 |
G |
| MB = $79.68 |
Most Recent Note - 11/12/2009 4:57:29 PM
G - Gapped down after reporting strong quarterly results for the period ended Sept 30, 2009, suffering a considerable loss today on heavy volume, closing below its 50 DMA line. As recently noted, "Its choppy action in recent weeks has not allowed for a sound new base to form." Deterioration under its recent lows near $65 would raise more serious concerns and trigger a worrisome technical sell signal.
>>> The latest Featured Stock Update with an annotated graph appeared on 11/11/2009. click here.
|
|
C
A
S
I |
News |
Chart |
SEC
View all notes Alert
me of new notes
Company
Profile
|
|
|
|
THESE ARE NOT BUY RECOMMENDATIONS!
Comments contained in the body of this report are technical
opinions only. The material herein has been obtained
from sources believed to be reliable and accurate, however,
its accuracy and completeness cannot be guaranteed.
This site is not an investment advisor, hence it does
not endorse or recommend any securities or other investments.
Any recommendation contained in this report may not
be suitable for all investors and it is not to be deemed
an offer or solicitation on our part with respect to
the purchase or sale of any securities. All trademarks,
service marks and trade names appearing in this report
are the property of their respective owners, and are
likewise used for identification purposes only.
This report is a service available
only to active Paid Premium Members.
You may opt-out of receiving report notifications
at any time. Questions or comments may be submitted
by writing to Premium Membership Services 665 S.E. 10 Street, Suite 201 Deerfield Beach, FL 33441-5634 or by calling 1-800-965-8307
or 954-785-1121.
|
|
|


