***Last / Change / Volume data in this table is the closing quote data***
Symbol/Exchange
Company Name
Industry Group |
PRICE |
CHANGE
(%Change) |
Day High |
Volume
(% DAV)
(% 50 day avg vol) |
52 Wk Hi
% From Hi |
Featured
Date |
Price
Featured |
Pivot Featured |
|
Max Buy |
ABV
-
NYSE
Comp De Bebidas Adr
FOOD and BEVERAGE - Beverages - Brewers
|
$138.19
|
-0.45
-0.32% |
$140.16
|
458,597
69.95% of 50 DAV
50 DAV is 655,600
|
$145.36
-4.93%
|
11/4/2010
|
$142.35
|
PP = $143.63
|
|
MB = $150.81
|
Most Recent Note - 11/9/2010 5:28:51 PM
Y - Down today with above average volume. Its recent low ($133.38 on 10/27/10) defines initial chart support above its 50 DMA line ($127). Color code was changed to yellow after an advanced "3-weeks tight" type pattern, with new pivot point based on its 10/25/10 high plus ten cents. Disciplined investors may consider a powerful technical breakout and close above its pivot point with heavy volume to be a new (or add-on) buy signal.
>>> The latest Featured Stock Update with an annotated graph appeared on 10/11/2010. Click here.
View all notes |
Alert me of new notes |
CANSLIM.net Company Profile |
SEC |
Zacks Reports |
StockTalk |
News |
Chart |
Request a new note
C
A N
S L
I M


|
ARUN
-
NASDAQ
Aruba Networks Inc
COMPUTER HARDWARE - Networking andamp; Communication Dev
|
$23.13
|
-0.49
-2.07% |
$23.49
|
2,915,516
119.18% of 50 DAV
50 DAV is 2,446,300
|
$23.85
-3.02%
|
8/30/2010
|
$18.12
|
PP = $18.51
|
|
MB = $19.44
|
 Most Recent Note - 11/11/2010 11:36:14 AM
G - Pulling back today while many issues in the Internet - Network Solutions group are enduring pressure after a disappointing report for Computer - Networking giant, Cisco Systems (CSCO -14.78%). ARUN stubbornly held its ground after recent volume driven gains, however it has not formed a sound new base pattern. Earnings news is due on Wednesday, November 17, 2010 for its latest quarter ended October 31, 2010.
>>> The latest Featured Stock Update with an annotated graph appeared on 10/26/2010. Click here.
View all notes |
Alert me of new notes |
CANSLIM.net Company Profile |
SEC |
Zacks Reports |
StockTalk |
News |
Chart |
Request a new note
C
A N
S L
I M
|
BIDU
-
NASDAQ
Baidu Inc Ads
INTERNET - Internet Information Providers
|
$114.10
|
+2.41
2.16% |
$115.04
|
15,464,925
134.04% of 50 DAV
50 DAV is 11,537,300
|
$113.78
0.28%
|
9/17/2010
|
$85.73
|
PP = $88.42
|
|
MB = $92.84
|
Most Recent Note - 11/11/2010 3:55:03 PM
G - Inching to another new high today with volume above average. It may produce more climactic gains, however it is extended from a sound base pattern now and a riskier "late stage" candidate. BIDU is up 11-fold from when it was first featured in yellow on October 30, 2006 (read here). Following a deep correction and Bear Market, it has been a fixture on the Featured Stocks page and rallied +212% in the 14 months since returning to prominence September 8, 2009 (read here).
>>> The latest Featured Stock Update with an annotated graph appeared on 10/7/2010. Click here.
View all notes |
Alert me of new notes |
CANSLIM.net Company Profile |
SEC |
Zacks Reports |
StockTalk |
News |
Chart |
Request a new note
C
A N
S L
I M
|
CACC
-
NASDAQ
Credit Acceptance Corp
FINANCIAL SERVICES - Credit Services
|
$59.57
|
-0.43
-0.72% |
$60.00
|
24,401
93.85% of 50 DAV
50 DAV is 26,000
|
$63.45
-6.11%
|
11/3/2010
|
$59.86
|
PP = $63.55
|
|
MB = $66.73
|
Most Recent Note - 11/10/2010 6:07:48 PM
Y - Small gain today with above average volume, finding support above its 50 DMA line. Perched -5% off its 52-week high, any subsequent breakout above its pivot point on heavy volume could trigger a new (or add-on) buy signal, meanwhile its $55.07 low (on 10/04/10) defines the nearest chart support level to watch above its long ago chart highs ($53.97).
>>> The latest Featured Stock Update with an annotated graph appeared on 10/29/2010. Click here.
View all notes |
Alert me of new notes |
CANSLIM.net Company Profile |
SEC |
Zacks Reports |
StockTalk |
News |
Chart |
Request a new note
C
A N
S L
I M
|
CMG
-
NYSE
Chipotle Mexican Grill
LEISURE - Restaurants
|
$237.76
|
+1.21
0.51% |
$240.73
|
1,132,310
141.31% of 50 DAV
50 DAV is 801,300
|
$236.55
0.51%
|
9/1/2010
|
$158.31
|
PP = $155.52
|
|
MB = $163.30
|
Most Recent Note - 11/10/2010 4:52:37 PM
G - Considerable gain today with above average volume for yet another new all-time high. It may produce more climactic gains, however it is very extended from any sound base pattern. Its 50 DMA line (now $185) defines the nearest chart support level.
>>> The latest Featured Stock Update with an annotated graph appeared on 10/28/2010. Click here.
View all notes |
Alert me of new notes |
CANSLIM.net Company Profile |
SEC |
Zacks Reports |
StockTalk |
News |
Chart |
Request a new note
C
A N
S L
I M
|
Symbol/Exchange
Company Name
Industry Group |
PRICE |
CHANGE
(%Change) |
Day High |
Volume
(% DAV)
(% 50 day avg vol) |
52 Wk Hi
% From Hi |
Featured
Date |
Price
Featured |
Pivot Featured |
|
Max Buy |
CTRP
-
NASDAQ
Ctrip.Com Intl Ltd Adr
LEISURE - Resorts and Casinos
|
$48.53
|
+1.87
4.01% |
$48.90
|
2,563,036
132.59% of 50 DAV
50 DAV is 1,933,000
|
$53.16
-8.71%
|
9/24/2010
|
$46.75
|
PP = $47.11
|
|
MB = $49.47
|
Most Recent Note - 11/11/2010 11:29:53 AM
G - Rallying today after 6 consecutive losses with above average volume, finding support near prior highs in the $47 area and its 50 DMA line.
>>> The latest Featured Stock Update with an annotated graph appeared on 9/28/2010. Click here.
View all notes |
Alert me of new notes |
CANSLIM.net Company Profile |
SEC |
Zacks Reports |
StockTalk |
News |
Chart |
Request a new note
C
A N
S L
I M
|
DECK
-
NASDAQ
Deckers Outdoor Corp
CONSUMER NON-DURABLES - Textile - Apparel Footwear
|
$62.04
|
+0.35
0.57% |
$62.54
|
950,214
88.59% of 50 DAV
50 DAV is 1,072,600
|
$63.55
-2.38%
|
10/27/2010
|
$54.16
|
PP = $54.86
|
|
MB = $57.60
|
Most Recent Note - 11/10/2010 2:47:33 PM
G - Pulling back today after 6 consecutive gains with near average volume for new 52-week highs. It is extended from its latest sound base. Prior highs in the $54-56 area define important chart support to watch.
>>> The latest Featured Stock Update with an annotated graph appeared on 10/27/2010. Click here.
View all notes |
Alert me of new notes |
CANSLIM.net Company Profile |
SEC |
Zacks Reports |
StockTalk |
News |
Chart |
Request a new note
C
A N
S L
I M
|
EBIX
-
NASDAQ
Ebix Inc
COMPUTER SOFTWARE and SERVICES - Business Software and Services
|
$23.74
|
-0.80
-3.26% |
$24.19
|
739,437
105.29% of 50 DAV
50 DAV is 702,300
|
$28.21
-15.85%
|
9/23/2010
|
$21.78
|
PP = $22.74
|
|
MB = $23.88
|
Most Recent Note - 11/11/2010 11:26:06 AM
G - Gapped down today following 2 prior losses with above average volume Subsequent deterioration below its 50 DMA line and prior chart lows in the $22-23 area would raise more serious concerns, technically. Fundamentally, its quarterly comparisons have shown impressive earnings acceleration. The company was mentioned in a "Ken's Mailbag" article on 11/08/10 (read here).
>>> The latest Featured Stock Update with an annotated graph appeared on 9/24/2010. Click here.
View all notes |
Alert me of new notes |
CANSLIM.net Company Profile |
SEC |
Zacks Reports |
StockTalk |
News |
Chart |
Request a new note
C
A N
S L
I M
|
EZPW
-
NASDAQ
Ezcorp Inc Cl A
SPECIALTY RETAIL - Specialty Retail, Other
|
$25.51
|
+0.20
0.79% |
$25.55
|
307,072
102.29% of 50 DAV
50 DAV is 300,200
|
$25.65
-0.55%
|
11/5/2010
|
$24.02
|
PP = $23.85
|
|
MB = $25.04
|
Most Recent Note - 11/9/2010 5:58:43 PM
G - Paused at its all-time high near its "max buy" level today after a streak of consecutive gains with above average volume. Technically, it broke out from a 6-month cup shaped base without a proper handle last week.
>>> The latest Featured Stock Update with an annotated graph appeared on 11/6/2010. Click here.
View all notes |
Alert me of new notes |
CANSLIM.net Company Profile |
SEC |
Zacks Reports |
StockTalk |
News |
Chart |
Request a new note
C
A N
S L
I M
|
FFIV
-
NASDAQ
F 5 Networks Inc
INTERNET - Internet Software and Services
|
$123.70
|
+0.81
0.66% |
$123.98
|
2,701,878
104.22% of 50 DAV
50 DAV is 2,592,500
|
$125.39
-1.35%
|
6/16/2010
|
$74.50
|
PP = $74.10
|
|
MB = $77.81
|
Most Recent Note - 11/9/2010 5:51:32 PM
G - It is extended from any sound base, holding its ground stubbornly near all-time highs with volume totals cooling. Prior highs in the $112 area define chart initial support.
>>> The latest Featured Stock Update with an annotated graph appeared on 9/13/2010. Click here.
View all notes |
Alert me of new notes |
CANSLIM.net Company Profile |
SEC |
Zacks Reports |
StockTalk |
News |
Chart |
Request a new note
C
A N
S L
I M
|
Symbol/Exchange
Company Name
Industry Group |
PRICE |
CHANGE
(%Change) |
Day High |
Volume
(% DAV)
(% 50 day avg vol) |
52 Wk Hi
% From Hi |
Featured
Date |
Price
Featured |
Pivot Featured |
|
Max Buy |
FOSL
-
NASDAQ
Fossil Inc
CONSUMER DURABLES - Recreational Goods, Other
|
$68.91
|
-0.79
-1.13% |
$69.34
|
1,025,250
132.50% of 50 DAV
50 DAV is 773,800
|
$70.07
-1.66%
|
10/20/2010
|
$54.12
|
PP = $55.61
|
|
MB = $58.39
|
Most Recent Note - 11/10/2010 12:46:23 PM
G - Up today following a considerable gap up for a new all-time high on the prior session. It is very extended from any sound base, and disciplined investors avoid chasing extended stocks. This high-ranked leader from the Retail/Wholesale Jewelry group reported very strong sales revenues and earnings increases for the quarter ended September 30, 2010 versus the year ago period, and its sales revenues increases have shown impressive acceleration in sequential quarterly comparisons.
>>> The latest Featured Stock Update with an annotated graph appeared on 10/5/2010. Click here.
View all notes |
Alert me of new notes |
CANSLIM.net Company Profile |
SEC |
Zacks Reports |
StockTalk |
News |
Chart |
Request a new note
C
A N
S L
I M
|
HMSY
-
NASDAQ
H M S Holdings Corp
COMPUTER SOFTWARE and SERVICES - Healthcare Information Service
|
$61.21
|
-0.39
-0.63% |
$61.31
|
162,303
75.84% of 50 DAV
50 DAV is 214,000
|
$62.91
-2.70%
|
9/27/2010
|
$57.97
|
PP = $58.36
|
|
MB = $61.28
|
Most Recent Note - 11/10/2010 6:23:08 PM
Y - Finished just 51 cents off its best ever close with a gain today on near average volume. Its Relative Strength rank has slumped to 76, below the 80+ guideline. Prompt support showed up near its 50 DMA line following its latest earnings report.
>>> The latest Featured Stock Update with an annotated graph appeared on 9/27/2010. Click here.
View all notes |
Alert me of new notes |
CANSLIM.net Company Profile |
SEC |
Zacks Reports |
StockTalk |
News |
Chart |
Request a new note
C
A N
S L
I M
|
HS
-
NYSE
Healthspring Inc
HEALTH SERVICES - Health Care Plans
|
$28.00
|
+0.03
0.11% |
$28.18
|
540,185
71.96% of 50 DAV
50 DAV is 750,700
|
$29.80
-6.04%
|
8/27/2010
|
$19.91
|
PP = $19.75
|
|
MB = $20.74
|
Most Recent Note - 11/10/2010 6:25:19 PM
G - Finished -6.1% off its 52-week high and closed at the session high after a positive reversal today. Near its 50 DMA line it recently found prompt support.
>>> The latest Featured Stock Update with an annotated graph appeared on 10/22/2010. Click here.
View all notes |
Alert me of new notes |
CANSLIM.net Company Profile |
SEC |
Zacks Reports |
StockTalk |
News |
Chart |
Request a new note
C
A N
S L
I M
|
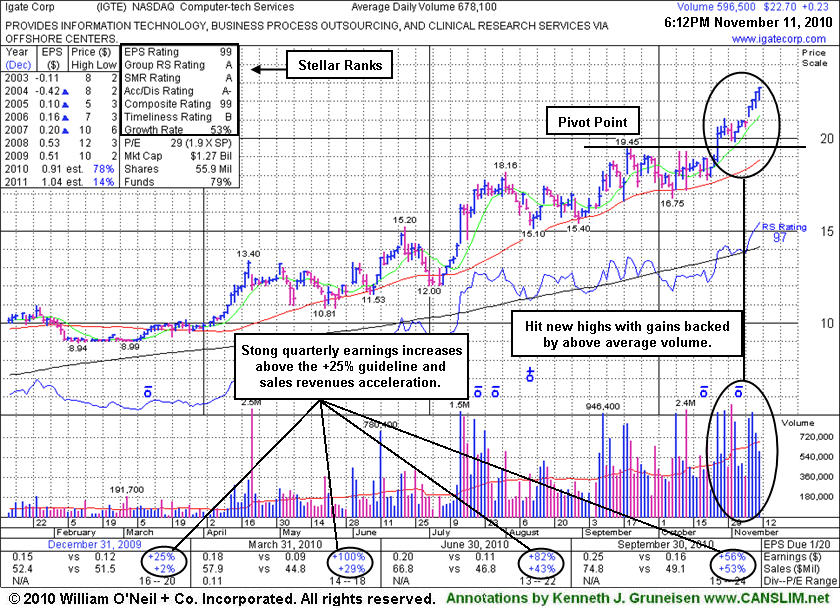
IGTE
-
NASDAQ
Igate Corp
COMPUTER SOFTWARE and SERVICES - Information Technology Service
|
$22.70
|
+0.23
1.02% |
$22.71
|
596,539
89.34% of 50 DAV
50 DAV is 667,700
|
$22.47
1.02%
|
10/26/2010
|
$17.29
|
PP = $19.55
|
|
MB = $20.53
|
Most Recent Note - 11/9/2010 5:54:13 PM
G - Gain today for another new high with above average volume, getting more extended from its latest base. Prior chart highs in the $19 area define initial chart support above its 50 DMA line.
>>> The latest Featured Stock Update with an annotated graph appeared on 11/11/2010. Click here.
View all notes |
Alert me of new notes |
CANSLIM.net Company Profile |
SEC |
Zacks Reports |
StockTalk |
News |
Chart |
Request a new note
C
A N
S L
I M
|
JOBS
-
NASDAQ
Fifty One Job Inc Ads
DIVERSIFIED SERVICES - Staffing and; Outsourcing Service
|
$49.75
|
-1.11
-2.18% |
$50.30
|
296,273
151.01% of 50 DAV
50 DAV is 196,200
|
$51.75
-3.86%
|
10/13/2010
|
$42.07
|
PP = $40.60
|
|
MB = $42.63
|
Most Recent Note - 11/11/2010 12:36:18 PM
G - It may produce more climactic gains, however it is extended from a sound base. Initial support is defined buy an upward trendline connecting its September-November lows.
>>> The latest Featured Stock Update with an annotated graph appeared on 9/16/2010. Click here.
View all notes |
Alert me of new notes |
CANSLIM.net Company Profile |
SEC |
Zacks Reports |
StockTalk |
News |
Chart |
Request a new note
C
A N
S L
I M
|
Symbol/Exchange
Company Name
Industry Group |
PRICE |
CHANGE
(%Change) |
Day High |
Volume
(% DAV)
(% 50 day avg vol) |
52 Wk Hi
% From Hi |
Featured
Date |
Price
Featured |
Pivot Featured |
|
Max Buy |
LFT
-
NYSE
Longtop Financl Tech Ads
COMPUTER SOFTWARE and SERVICES - Business Software and Services
|
$41.47
|
-1.26
-2.95% |
$42.86
|
235,619
45.94% of 50 DAV
50 DAV is 512,900
|
$42.86
-3.24%
|
11/5/2010
|
$41.83
|
PP = $40.96
|
|
MB = $43.01
|
Most Recent Note - 11/11/2010 11:53:26 AM
Y - Gapped down today for a small loss, pulling back from an all-time high hit on the prior session. Prior highs in the $40-41 area define support above its 50 DMA line
>>> The latest Featured Stock Update with an annotated graph appeared on 10/14/2010. Click here.
View all notes |
Alert me of new notes |
CANSLIM.net Company Profile |
SEC |
Zacks Reports |
StockTalk |
News |
Chart |
Request a new note
C
A N
S L
I M
|
LULU
-
NASDAQ
Lululemon Athletica
MANUFACTURING - Textile Manufacturing
|
$48.31
|
-0.07
-0.14% |
$48.63
|
530,824
43.66% of 50 DAV
50 DAV is 1,215,800
|
$49.75
-2.89%
|
10/8/2010
|
$47.66
|
PP = $46.67
|
|
MB = $49.00
|
Most Recent Note - 11/9/2010 5:33:48 PM
Y - Down today on light volume, consolidating in a healthy fashion just under its "max buy" level, so its color code is changed to yellow again. Considerable gains with above average volume recently provided a confirming signs of institutional accumulation. Recent lows in the $42 area define support to watch now coinciding near its 50 DMA line.
>>> The latest Featured Stock Update with an annotated graph appeared on 10/8/2010. Click here.
View all notes |
Alert me of new notes |
CANSLIM.net Company Profile |
SEC |
Zacks Reports |
StockTalk |
News |
Chart |
Request a new note
C
A N
S L
I M
|
MWIV
-
NASDAQ
M W I Veterinary Supply
HEALTH SERVICES - Medical Instruments and; Supplies
|
$59.20
|
-0.91
-1.51% |
$59.68
|
19,620
34.06% of 50 DAV
50 DAV is 57,600
|
$63.94
-7.41%
|
11/4/2010
|
$61.79
|
PP = $59.60
|
|
MB = $62.58
|
Most Recent Note - 11/10/2010 5:25:57 PM
Y - Gain today with near average volume for its second best close ever following a pullback below its pivot point. Healthy stocks rarely slump more than -7% below their pivot points in a bullish market environment. For MWIV to sink that far it would first violate its 50 DMA line ($56.74 now) repeatedly noted as a very important support level.
>>> The latest Featured Stock Update with an annotated graph appeared on 11/2/2010. Click here.
View all notes |
Alert me of new notes |
CANSLIM.net Company Profile |
SEC |
Zacks Reports |
StockTalk |
News |
Chart |
Request a new note
C
A N
S L
I M
|
NEM
-
NYSE
Newmont Mining Corp
METALS and MINING - Gold
|
$63.02
|
+0.71
1.14% |
$63.30
|
5,437,804
79.23% of 50 DAV
50 DAV is 6,863,300
|
$65.50
-3.79%
|
8/31/2010
|
$61.32
|
PP = $63.48
|
|
MB = $66.65
|
Most Recent Note - 11/9/2010 5:25:54 PM
G - Gapped up today and then reversed for damaging loss with nearly twice average volume, closing below its 50 DMA line. The distributional action raises concerns, meanwhile its Relative Strength rank has also slumped to 70, below the 80+ guideline. Recent lows in the $57 area define near-term support above its 200 DMA line.
>>> The latest Featured Stock Update with an annotated graph appeared on 11/10/2010. Click here.
View all notes |
Alert me of new notes |
CANSLIM.net Company Profile |
SEC |
Zacks Reports |
StockTalk |
News |
Chart |
Request a new note
C
A N
S L
I M
|
NEOG
-
NASDAQ
Neogen Corp
DRUGS - Diagnostic Substances
|
$36.48
|
-0.42
-1.14% |
$36.89
|
35,646
34.21% of 50 DAV
50 DAV is 104,200
|
$36.90
-1.14%
|
9/1/2010
|
$30.79
|
PP = $30.49
|
|
MB = $32.01
|
Most Recent Note - 11/10/2010 5:16:29 PM
G - Closed at its session high and all-time high today with a gain on light volume, and its color code is changed to green. Investors had recent opportunity to accumulate shares per the investment system guidelines for a "secondary buy point" noted since 11/02/10.
>>> The latest Featured Stock Update with an annotated graph appeared on 10/13/2010. Click here.
View all notes |
Alert me of new notes |
CANSLIM.net Company Profile |
SEC |
Zacks Reports |
StockTalk |
News |
Chart |
Request a new note
C
A N
S L
I M
|
Symbol/Exchange
Company Name
Industry Group |
PRICE |
CHANGE
(%Change) |
Day High |
Volume
(% DAV)
(% 50 day avg vol) |
52 Wk Hi
% From Hi |
Featured
Date |
Price
Featured |
Pivot Featured |
|
Max Buy |
NFLX
-
NASDAQ
Netflix Inc
SPECIALTY RETAIL - Music and Video Stores
|
$175.14
|
-1.73
-0.98% |
$178.68
|
4,201,669
74.12% of 50 DAV
50 DAV is 5,668,500
|
$184.74
-5.20%
|
11/9/2010
|
$173.10
|
PP = $184.84
|
|
MB = $194.08
|
Most Recent Note - 11/10/2010 5:08:32 PM
Y - Finished the session near its high and less than $2 off its best ever close with its 4th consecutive gain without great volume conviction. It has formed an advanced "ascending base" type pattern marked by 3 pullbacks in the 10-20% range since its earlier technical breakout (on 8/10/10) from a double bottom base. Color code was changed to yellow with new pivot point cited based on its 52-week high plus ten cents. A subsequent breakout with heavy volume would signal a new (or add-on) technical buy signal, however it is a riskier "late stage" set-up.
>>> The latest Featured Stock Update with an annotated graph appeared on 10/1/2010. Click here.
View all notes |
Alert me of new notes |
CANSLIM.net Company Profile |
SEC |
Zacks Reports |
StockTalk |
News |
Chart |
Request a new note
C
A N
S L
I M
|
NTAP
-
NASDAQ
Netapp Inc
COMPUTER HARDWARE - Data Storage Devices
|
$55.44
|
-1.46
-2.57% |
$55.88
|
8,440,079
118.51% of 50 DAV
50 DAV is 7,121,600
|
$57.96
-4.35%
|
9/8/2010
|
$46.98
|
PP = $44.99
|
|
MB = $47.24
|
Most Recent Note - 11/11/2010 11:23:05 AM
G - Gapped down today from its 52 week high today after wedging higher for 8 consecutive gain without great volume conviction. Extended from any sound base, its 50 DMA line defines important chart support to watch.
>>> The latest Featured Stock Update with an annotated graph appeared on 11/3/2010. Click here.
View all notes |
Alert me of new notes |
CANSLIM.net Company Profile |
SEC |
Zacks Reports |
StockTalk |
News |
Chart |
Request a new note
C
A N
S L
I M
|
ORCL
-
NASDAQ
Oracle Corp
COMPUTER SOFTWARE and SERVICES - Application Software
|
$28.57
|
-0.12
-0.41% |
$28.58
|
37,194,288
90.24% of 50 DAV
50 DAV is 41,217,800
|
$29.82
-4.18%
|
9/20/2010
|
$27.32
|
PP = $26.73
|
|
MB = $28.07
|
Most Recent Note - 11/9/2010 6:04:59 PM
G - Remains perched less than -4% off its 52-week highs, and volume totals have been cooling in recent weeks. Prior highs and its 50 DMA line define chart support in the $27 area. It was barely changed on recent news it agreed to buy Art Technology Group (ARTG) for $1 billion.
>>> The latest Featured Stock Update with an annotated graph appeared on 9/20/2010. Click here.
View all notes |
Alert me of new notes |
CANSLIM.net Company Profile |
SEC |
Zacks Reports |
StockTalk |
News |
Chart |
Request a new note
C
A N
S L
I M
|
PAY
-
NYSE
Verifone Systems Inc
COMPUTER HARDWARE - Transaction Automation Systems
|
$33.59
|
-1.01
-2.92% |
$34.06
|
1,102,171
81.22% of 50 DAV
50 DAV is 1,357,000
|
$35.94
-6.54%
|
8/25/2010
|
$24.30
|
PP = $23.74
|
|
MB = $24.93
|
Most Recent Note - 11/11/2010 11:20:02 AM
G - Gapped down today. It is extended from any sound base pattern. A prior high ($31.40) defines initial chart support above its 50 DMA line.
>>> The latest Featured Stock Update with an annotated graph appeared on 10/25/2010. Click here.
View all notes |
Alert me of new notes |
CANSLIM.net Company Profile |
SEC |
Zacks Reports |
StockTalk |
News |
Chart |
Request a new note
C
A N
S L
I M
|
RAX
-
NYSE
Rackspace Hosting Inc
INTERNET - Internet Software and; Services
|
$28.65
|
-0.24
-0.83% |
$28.85
|
3,541,363
135.53% of 50 DAV
50 DAV is 2,612,900
|
$29.35
-2.39%
|
9/21/2010
|
$22.84
|
PP = $23.61
|
|
MB = $24.79
|
Most Recent Note - 11/11/2010 11:39:30 AM
G - This high-ranked Internet - Network Solutions firm gapped down today amid widespread declines in the group. It faces no resistance due to overhead supply. Prior highs near $26 define initial chart support above its 50 DMA line.
>>> The latest Featured Stock Update with an annotated graph appeared on 9/21/2010. Click here.
View all notes |
Alert me of new notes |
CANSLIM.net Company Profile |
SEC |
Zacks Reports |
StockTalk |
News |
Chart |
Request a new note
C
A N
S L
I M
|
Symbol/Exchange
Company Name
Industry Group |
PRICE |
CHANGE
(%Change) |
Day High |
Volume
(% DAV)
(% 50 day avg vol) |
52 Wk Hi
% From Hi |
Featured
Date |
Price
Featured |
Pivot Featured |
|
Max Buy |
ROVI
-
NASDAQ
Rovi Corp
COMPUTER SOFTWARE andamp; SERVICES - Security Software andamp; Services
|
$52.89
|
-0.24
-0.45% |
$52.96
|
731,864
45.19% of 50 DAV
50 DAV is 1,619,600
|
$53.61
-1.34%
|
10/29/2010
|
$49.99
|
PP = $53.10
|
|
MB = $55.76
|
Most Recent Note - 11/11/2010 4:32:14 PM
Y - Hovering near its 52 week high with volume totals recently drying up, a sign that only a few small investors are exiting. Disciplined investors will watch for subsequent gains above its pivot point with volume conviction that would trigger a new (or add-on) technical buy signal, and always limit losses if a stock falls more than -7% from the purchase price, per the system guidelines. Initial support to watch is defined by its 50 DMA line, then its prior chart low, where violations would trigger technical sell signals.
>>> The latest Featured Stock Update with an annotated graph appeared on 10/20/2010. Click here.
View all notes |
Alert me of new notes |
CANSLIM.net Company Profile |
SEC |
Zacks Reports |
StockTalk |
News |
Chart |
Request a new note
C
A N
S L
I M
|
SHOO
-
NASDAQ
Steven Madden Limited
CONSUMER NON-DURABLES - Textile - Apparel Footwear
|
$41.38
|
-0.36
-0.86% |
$41.84
|
220,379
63.45% of 50 DAV
50 DAV is 347,300
|
$44.85
-7.74%
|
9/15/2010
|
$38.94
|
PP = $40.27
|
|
MB = $42.28
|
Most Recent Note - 11/11/2010 4:25:00 PM
G - Recently finding support above its 50 DMA line and prior chart highs in the $40 area. More damaging losses leading to a close below its short-term average would raise concerns and trigger technical sell signals.
>>> The latest Featured Stock Update with an annotated graph appeared on 9/29/2010. Click here.
View all notes |
Alert me of new notes |
CANSLIM.net Company Profile |
SEC |
Zacks Reports |
StockTalk |
News |
Chart |
Request a new note
C
A N
S L
I M
|
SLW
-
NYSE
Silver Wheaton Corp
METALS and; MINING - Silver
|
$35.39
|
+0.61
1.75% |
$35.49
|
13,495,403
168.94% of 50 DAV
50 DAV is 7,988,200
|
$37.20
-4.87%
|
8/25/2010
|
$21.40
|
PP = $21.99
|
|
MB = $23.09
|
Most Recent Note - 11/11/2010 3:57:29 PM
G - Poised for a new high close today with another gain on above average volume. It could produce more climactic gains, however it is very extended from any sound base and it flashed a worrisome "negative reversal" on 11/09/10. This high-ranked leader has been recently noted as - "One of the strongest names in the Mining - Gold/Silver/Gems group currently included on the Featured Stocks list."
>>> The latest Featured Stock Update with an annotated graph appeared on 10/18/2010. Click here.
View all notes |
Alert me of new notes |
CANSLIM.net Company Profile |
SEC |
Zacks Reports |
StockTalk |
News |
Chart |
Request a new note
C
A N
S L
I M
|
STRI
-
NYSE
S T R Holdings Inc
ELECTRONICS - Semiconductor - Specialized
|
$24.52
|
-0.41
-1.64% |
$24.85
|
478,487
86.43% of 50 DAV
50 DAV is 553,600
|
$28.16
-12.93%
|
11/8/2010
|
$26.52
|
PP = $26.43
|
|
MB = $27.75
|
Most Recent Note - 11/11/2010 4:40:07 PM
G - Down again today with below average volume after a "negative reversal" and a two-session dose of heavy distributional pressure promptly negated its technical breakout, raising concerns. Earnings news for the latest quarter ended September 30, 2010 is due on Friday. Volume and volatility often increase near earnings news.
>>> The latest Featured Stock Update with an annotated graph appeared on 11/8/2010. Click here.
View all notes |
Alert me of new notes |
CANSLIM.net Company Profile |
SEC |
Zacks Reports |
StockTalk |
News |
Chart |
Request a new note
C
A N
S L
I M
|
UA
-
NYSE
Under Armour Inc Cl A
CONSUMER NON-DURABLES - Textile - Apparel Clothing
|
$51.97
|
+0.12
0.23% |
$51.88
|
492,667
62.78% of 50 DAV
50 DAV is 784,700
|
$51.99
-0.04%
|
9/9/2010
|
$39.99
|
PP = $40.10
|
|
MB = $42.11
|
Most Recent Note - 11/11/2010 4:16:29 PM
G - Inched higher on light volume today for a new high close, getting more extended from any sound base and support at its 50 DMA line. It has not encountered any distributional pressure and could produce more climactic gains. Some fundamental flaws with respect to the fact-based investment system have been recently noted as concerns. See the latest FSU analysis for more important details and an annotated graph.
>>> The latest Featured Stock Update with an annotated graph appeared on 11/4/2010. Click here.
View all notes |
Alert me of new notes |
CANSLIM.net Company Profile |
SEC |
Zacks Reports |
StockTalk |
News |
Chart |
Request a new note
C
A N
S L
I M
|
Symbol/Exchange
Company Name
Industry Group |
PRICE |
CHANGE
(%Change) |
Day High |
Volume
(% DAV)
(% 50 day avg vol) |
52 Wk Hi
% From Hi |
Featured
Date |
Price
Featured |
Pivot Featured |
|
Max Buy |
ULTA
-
NASDAQ
Ulta Salon Cosm & Frag
SPECIALTY RETAIL - Specialty Retail, Other
|
$32.75
|
-0.25
-0.76% |
$33.00
|
188,136
29.06% of 50 DAV
50 DAV is 647,500
|
$33.50
-2.24%
|
9/3/2010
|
$26.36
|
PP = $25.89
|
|
MB = $27.18
|
Most Recent Note - 11/11/2010 4:23:29 PM
G - It could produce more climactic gains, however it is currently extended from any sound base. Volume totals have been drying up since its big gain on 10/12/10. It is within close striking distance of its all-time high of $35.63 in Nov '07. Its 50 DMA line defines initial support to watch above prior chart highs in the $26 area.
>>> The latest Featured Stock Update with an annotated graph appeared on 11/1/2010. Click here.
View all notes |
Alert me of new notes |
CANSLIM.net Company Profile |
SEC |
Zacks Reports |
StockTalk |
News |
Chart |
Request a new note
C
A N
S L
I M
|
VIT
-
NYSE
Vanceinfo Tech Inc Ads
COMPUTER SOFTWARE and SERVICES - Business Software and Services
|
$36.47
|
-0.68
-1.83% |
$37.38
|
753,096
126.66% of 50 DAV
50 DAV is 594,600
|
$38.43
-5.10%
|
7/8/2010
|
$25.20
|
PP = $26.58
|
|
MB = $27.91
|
Most Recent Note - 11/11/2010 11:55:57 AM
G - Small gap down today following a positive reversal on the prior session for a gain with above aver sage volume. It is extended from any sound base pattern. Meanwhile, its 50 DMA line defines important chart support to watch.
>>> The latest Featured Stock Update with an annotated graph appeared on 10/21/2010. Click here.
View all notes |
Alert me of new notes |
CANSLIM.net Company Profile |
SEC |
Zacks Reports |
StockTalk |
News |
Chart |
Request a new note
C
A N
S L
I M
|