***Last / Change / Volume data in this table is the closing quote data***
Symbol/Exchange
Company Name
Industry Group |
PRICE |
CHANGE
(%Change) |
Day High |
Volume
(% DAV)
(% 50 day avg vol) |
52 Wk Hi
% From Hi |
Featured
Date |
Price
Featured |
Pivot Featured |
|
Max Buy |
AAPL
-
NASDAQ
Apple Inc
COMPUTER HARDWARE - Personal Computers
|
$395.28
|
-10.95
-2.70% |
$400.89
|
19,952,990
98.58% of 50 DAV
50 DAV is 20,240,500
|
$426.70
-7.36%
|
9/16/2011
|
$399.14
|
PP = $404.60
|
|
MB = $424.83
|
 Most Recent Note - 11/9/2011 7:09:23 PM
G - Loss today on higher (near average) volume led to a test of its 50 DMA line and recent lows defining an important chart support level.
>>> The latest Featured Stock Update with an annotated graph appeared on 10/20/2011. Click here.
View all notes |
Alert me of new notes |
CANSLIM.net Company Profile |
SEC |
Zacks Reports |
StockTalk |
News |
Chart |
Request a new note
C
A N
S L
I M


|
ADS
-
NYSE
Alliance Data Sys Corp
COMPUTER SOFTWARE and SERVICES - Information and Delivery Service
|
$100.49
|
-2.81
-2.72% |
$101.83
|
940,861
99.08% of 50 DAV
50 DAV is 949,600
|
$107.18
-6.24%
|
10/21/2011
|
$97.94
|
PP = $101.15
|
|
MB = $106.21
|
Most Recent Note - 11/9/2011 9:44:40 PM
Y - Down today on higher (near average) volume, closing just under its pivot point and raising some concerns. Prior chart highs in the $101 define initial support to watch well above its 50 DMA line.
>>> The latest Featured Stock Update with an annotated graph appeared on 10/21/2011. Click here.
View all notes |
Alert me of new notes |
CANSLIM.net Company Profile |
SEC |
Zacks Reports |
StockTalk |
News |
Chart |
Request a new note
C
A N
S L
I M
|
ALXN
-
NASDAQ
Alexion Pharmaceuticals
DRUGS - Drug Manufacturers - Other
|
$64.07
|
-0.77
-1.19% |
$65.22
|
1,383,982
91.62% of 50 DAV
50 DAV is 1,510,500
|
$70.42
-9.02%
|
9/15/2011
|
$63.20
|
PP = $60.81
|
|
MB = $63.85
|
Most Recent Note - 11/9/2011 9:50:09 PM
G - Inched lower to a close below its 50 DMA line today raising concerns. It has been weeks since volume has indicated any great decisiveness in direction.
>>> The latest Featured Stock Update with an annotated graph appeared on 10/18/2011. Click here.
View all notes |
Alert me of new notes |
CANSLIM.net Company Profile |
SEC |
Zacks Reports |
StockTalk |
News |
Chart |
Request a new note
C
A N
S L
I M
|
CATM
-
NASDAQ
Cardtronics Inc
DIVERSIFIED SERVICES - Business/Management Services
|
$26.22
|
-1.03
-3.78% |
$27.05
|
472,589
117.71% of 50 DAV
50 DAV is 401,500
|
$28.46
-7.87%
|
11/8/2011
|
$25.99
|
PP = $25.95
|
|
MB = $27.25
|
Most Recent Note - 11/9/2011 9:53:23 PM
Y - Pulled back today on average volume following its heavier volume breakout on 11/08/11. Prior highs in the $26 area define initial chart support to watch. See the latest FSU analysis for more details and an annotated graph.
>>> The latest Featured Stock Update with an annotated graph appeared on 11/8/2011. Click here.
View all notes |
Alert me of new notes |
CANSLIM.net Company Profile |
SEC |
Zacks Reports |
StockTalk |
News |
Chart |
Request a new note
C
A N
S L
I M
|
CELG
-
NASDAQ
Celgene Corp
DRUGS - Drug Manufacturers - Major
|
$64.31
|
-0.87
-1.33% |
$65.14
|
3,616,987
94.22% of 50 DAV
50 DAV is 3,838,700
|
$68.25
-5.77%
|
9/16/2011
|
$61.21
|
PP = $62.59
|
|
MB = $65.72
|
Most Recent Note - 11/9/2011 9:55:21 PM
Y -Slight pickup in volume (near average) behind today's loss while consolidating just above its 50 DMA line defining important near-term chart support. A violation would raise concerns and trigger a technical sell signal.
>>> The latest Featured Stock Update with an annotated graph appeared on 11/7/2011. Click here.
View all notes |
Alert me of new notes |
CANSLIM.net Company Profile |
SEC |
Zacks Reports |
StockTalk |
News |
Chart |
Request a new note
C
A N
S L
I M
|
Symbol/Exchange
Company Name
Industry Group |
PRICE |
CHANGE
(%Change) |
Day High |
Volume
(% DAV)
(% 50 day avg vol) |
52 Wk Hi
% From Hi |
Featured
Date |
Price
Featured |
Pivot Featured |
|
Max Buy |
CEVA
-
NASDAQ
Ceva Inc
ELECTRONICS - Semiconductor - Specialized
|
$29.77
|
-1.93
-6.09% |
$30.95
|
224,099
94.04% of 50 DAV
50 DAV is 238,300
|
$35.60
-16.38%
|
10/28/2011
|
$34.38
|
PP = $35.70
|
|
MB = $37.49
|
Most Recent Note - 11/9/2011 9:56:32 PM
Y - Gapped down for a loss on near average volume today. Still consolidating above prior highs since its gap up on 10/27/11 helped it break out of a "double bottom" base pattern. In the 10/28/11 mid-day report (read here) it was featured again in yellow with pivot point based on its 52-week high plus 10 cents while rallying from a larger cup shaped base. It has encountered distributional pressure since, while volume-driven gains above its pivot point are needed to trigger a new (or add-on) technical buy signal.
>>> The latest Featured Stock Update with an annotated graph appeared on 11/2/2011. Click here.
View all notes |
Alert me of new notes |
CANSLIM.net Company Profile |
SEC |
Zacks Reports |
StockTalk |
News |
Chart |
Request a new note
C
A N
S L
I M
|
FEIC
-
NASDAQ
F E I Co
ELECTRONICS - Diversified Electronics
|
$39.42
|
-2.03
-4.90% |
$40.22
|
501,812
115.57% of 50 DAV
50 DAV is 434,200
|
$42.25
-6.70%
|
10/28/2011
|
$40.31
|
PP = $40.88
|
|
MB = $42.92
|
Most Recent Note - 11/9/2011 9:59:18 PM
Y - Gapped down today for a loss with volume slightly above average, closing below its pivot point and raising concerns. Disciplined investors limit losses if a stock falls more than -7% from their purchase price.
>>> The latest Featured Stock Update with an annotated graph appeared on 10/28/2011. Click here.
View all notes |
Alert me of new notes |
CANSLIM.net Company Profile |
SEC |
Zacks Reports |
StockTalk |
News |
Chart |
Request a new note
C
A N
S L
I M
|
GNC
-
NYSE
G N C Holdings Inc
RETAIL - Drug Stores
|
$25.65
|
-0.20
-0.77% |
$26.06
|
849,409
66.87% of 50 DAV
50 DAV is 1,270,300
|
$27.13
-5.46%
|
10/26/2011
|
$24.60
|
PP = $24.80
|
|
MB = $26.04
|
Most Recent Note - 11/9/2011 10:03:03 PM
Y - Consolidating above its pivot point and below its "max buy" level with cooling volume totals indicative that few are rushing for the exits following the recent Secondary Offering completed on 10/15/11. Recent chart lows (near $23.80) define near term support to watch above its 50 DMA line.
>>> The latest Featured Stock Update with an annotated graph appeared on 10/26/2011. Click here.
View all notes |
Alert me of new notes |
CANSLIM.net Company Profile |
SEC |
Zacks Reports |
StockTalk |
News |
Chart |
Request a new note
C
A N
S L
I M
|
HMSY
-
NASDAQ
H M S Holdings Corp
COMPUTER SOFTWARE and SERVICES - Healthcare Information Service
|
$29.53
|
-0.98
-3.21% |
$30.13
|
1,201,456
187.49% of 50 DAV
50 DAV is 640,800
|
$30.82
-4.19%
|
10/27/2011
|
$26.44
|
PP = $28.37
|
|
MB = $29.79
|
Most Recent Note - 11/9/2011 12:42:21 PM
G - Pulling back today after a sharp volume-driven rally beyond its "max buy" level. Prior highs in the $27-28 area define support to watch on pullbacks.
>>> The latest Featured Stock Update with an annotated graph appeared on 11/4/2011. Click here.
View all notes |
Alert me of new notes |
CANSLIM.net Company Profile |
SEC |
Zacks Reports |
StockTalk |
News |
Chart |
Request a new note
C
A N
S L
I M
|
ISRG
-
NASDAQ
Intuitive Surgical Inc
HEALTH SERVICES - Medical Appliances and Equipment
|
$429.28
|
-11.91
-2.70% |
$437.27
|
291,500
68.24% of 50 DAV
50 DAV is 427,200
|
$443.00
-3.10%
|
10/19/2011
|
$424.69
|
PP = $415.29
|
|
MB = $436.05
|
Most Recent Note - 11/8/2011 7:13:29 PM
G - Up today on light volume for its best ever close. Finished above its "max buy" level, and its color code is changed to green again. Prior highs define important support to watch on pullbacks.
>>> The latest Featured Stock Update with an annotated graph appeared on 10/19/2011. Click here.
View all notes |
Alert me of new notes |
CANSLIM.net Company Profile |
SEC |
Zacks Reports |
StockTalk |
News |
Chart |
Request a new note
C
A N
S L
I M
|
Symbol/Exchange
Company Name
Industry Group |
PRICE |
CHANGE
(%Change) |
Day High |
Volume
(% DAV)
(% 50 day avg vol) |
52 Wk Hi
% From Hi |
Featured
Date |
Price
Featured |
Pivot Featured |
|
Max Buy |
MG
-
NYSE
Mistras Group Inc
DIVERSIFIED SERVICES - Bulding and Faci;ity Management Services
|
$21.50
|
-1.31
-5.74% |
$22.45
|
97,760
46.60% of 50 DAV
50 DAV is 209,800
|
$23.51
-8.55%
|
10/28/2011
|
$22.49
|
PP = $23.61
|
|
MB = $24.79
|
Most Recent Note - 11/9/2011 10:06:20 PM
Y - Prior highs in the $20-21 area define initial chart support to watch above its 50 DMA line. It recently stalled and did not break out of a late stage "3 weeks tight" base pattern.
>>> The latest Featured Stock Update with an annotated graph appeared on 10/12/2011. Click here.
View all notes |
Alert me of new notes |
CANSLIM.net Company Profile |
SEC |
Zacks Reports |
StockTalk |
News |
Chart |
Request a new note
C
A N
S L
I M
|
MKTX
-
NASDAQ
Marketaxess Holdings Inc
FINANCIAL SERVICES - Investment Brokerage - Nationa
|
$27.84
|
-1.87
-6.29% |
$29.44
|
146,679
60.04% of 50 DAV
50 DAV is 244,300
|
$31.45
-11.48%
|
10/28/2011
|
$29.79
|
PP = $31.05
|
|
MB = $32.60
|
Most Recent Note - 11/9/2011 10:09:01 PM
Y - Lack of progress has been followed by a slump today to its 50 DMA line. Its Relative Strength line did not lead the way as it hit recent new highs, it recently has slumped.
>>> The latest Featured Stock Update with an annotated graph appeared on 10/31/2011. Click here.
View all notes |
Alert me of new notes |
CANSLIM.net Company Profile |
SEC |
Zacks Reports |
StockTalk |
News |
Chart |
Request a new note
C
A N
S L
I M
|
OPNT
-
NASDAQ
Opnet Technologies
INTERNET - Internet Software and Services
|
$45.36
|
-2.38
-4.99% |
$47.14
|
425,095
185.15% of 50 DAV
50 DAV is 229,600
|
$47.97
-5.44%
|
10/11/2011
|
$38.45
|
PP = $42.02
|
|
MB = $44.12
|
Most Recent Note - 11/9/2011 12:55:23 PM
G - Small gap down today after churning above average volume in the past week while making limited progress. Previous highs in the $41 area define near-term chart support to watch on pullbacks. Due to report earnings today for the quarter ended September 30, 2011.
>>> The latest Featured Stock Update with an annotated graph appeared on 10/25/2011. Click here.
View all notes |
Alert me of new notes |
CANSLIM.net Company Profile |
SEC |
Zacks Reports |
StockTalk |
News |
Chart |
Request a new note
C
A N
S L
I M
|
OSIS
-
NASDAQ
O S I Systems Inc
ELECTRONICS - Semiconductor Equipment and Mate
|
$44.39
|
-2.48
-5.29% |
$45.95
|
129,217
86.96% of 50 DAV
50 DAV is 148,600
|
$47.39
-6.33%
|
11/1/2011
|
$42.07
|
PP = $45.57
|
|
MB = $47.85
|
Most Recent Note - 11/9/2011 10:12:20 PM
Y - Gapped down today amid a widely negative market after quietly touching new 52-week highs (N criteria) this week with gains lacking great volume. Previously noted - "Lighter than average behind last week's gains, not indicative of great institutional (I criteria) buying demand. Volume-driven gains above its pivot point may trigger a technical buy signal."
>>> The latest Featured Stock Update with an annotated graph appeared on 11/1/2011. Click here.
View all notes |
Alert me of new notes |
CANSLIM.net Company Profile |
SEC |
Zacks Reports |
StockTalk |
News |
Chart |
Request a new note
C
A N
S L
I M
|
RAX
-
NYSE
Rackspace Hosting Inc
INTERNET - Internet Software and; Services
|
$42.38
|
-2.50
-5.57% |
$44.00
|
2,327,332
153.30% of 50 DAV
50 DAV is 1,518,200
|
$46.50
-8.85%
|
11/8/2011
|
$44.28
|
PP = $46.27
|
|
MB = $48.58
|
Most Recent Note - 11/9/2011 10:14:17 PM
Y - Gapped down today and suffered its 2nd loss on above average volume in the span of 3 sessions. Previously noted - "Volume-driven gains into new high ground may trigger a new technical buy signal. After dropped from the Featured Stocks list on 6/16/11 it rebounded near its 52-week high then slumped well below its 200 DMA line during a much deeper consolidation before rebounding again. It is now working on the right side of a 19-week cup shaped base with little overhead supply remaining to act as resistance."
>>> The latest Featured Stock Update with an annotated graph appeared on 6/14/2011. Click here.
View all notes |
Alert me of new notes |
CANSLIM.net Company Profile |
SEC |
Zacks Reports |
StockTalk |
News |
Chart |
Request a new note
C
A N
S L
I M
|
Symbol/Exchange
Company Name
Industry Group |
PRICE |
CHANGE
(%Change) |
Day High |
Volume
(% DAV)
(% 50 day avg vol) |
52 Wk Hi
% From Hi |
Featured
Date |
Price
Featured |
Pivot Featured |
|
Max Buy |
SWI
-
NYSE
Solarwinds Inc
COMPUTER SOFTWARE and SERVICES - Application Software
|
$29.61
|
+0.12
0.41% |
$30.40
|
2,296,385
200.14% of 50 DAV
50 DAV is 1,147,400
|
$29.75
-0.47%
|
10/27/2011
|
$27.78
|
PP = $25.62
|
|
MB = $26.90
|
Most Recent Note - 11/9/2011 1:17:13 PM
G - On track today for a 6th consecutive small gain into new high territory. It is extended from its previous base pattern. Prior highs in the $25-26 area define initial chart support to watch on pullbacks.
>>> The latest Featured Stock Update with an annotated graph appeared on 10/27/2011. Click here.
View all notes |
Alert me of new notes |
CANSLIM.net Company Profile |
SEC |
Zacks Reports |
StockTalk |
News |
Chart |
Request a new note
C
A N
S L
I M
|
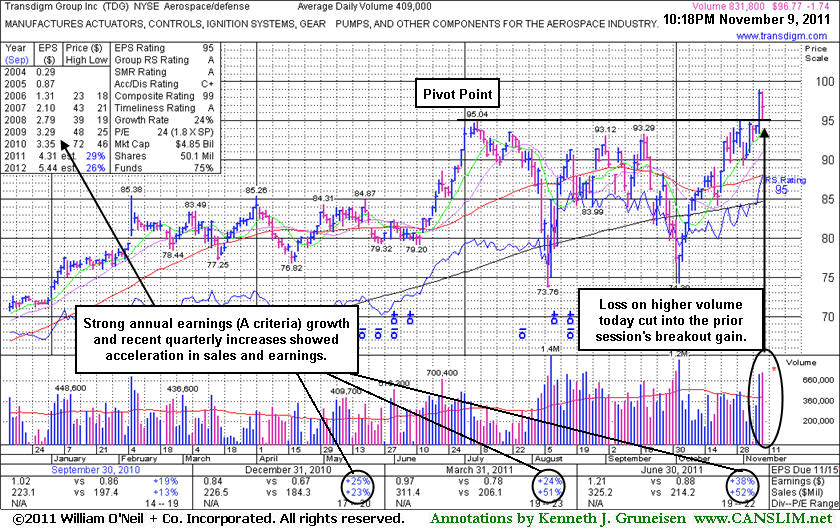
TDG
-
NYSE
Transdigm Group Inc
AEROSPACE/DEFENSE - Aerospace/Defense Products and; Services
|
$96.77
|
-1.74
-1.77% |
$98.69
|
832,014
206.25% of 50 DAV
50 DAV is 403,400
|
$98.93
-2.18%
|
11/9/2011
|
$98.45
|
PP = $95.14
|
|
MB = $99.90
|
Most Recent Note - 11/9/2011 10:38:31 PM
Y - Hit a new 52-week high on the prior session with a volume-driven gain helping it break out from a 19-week base. While consolidating today above prior highs it was featured in yellow (read here) with pivot point based on its 7/07/11 high plus 10 cents. Reported earnings +38% on +52% sales revenues for the quarter ended June 30, 2011 versus the year ago period. Prior earnings comparisons were right at the +25% guideline and it has maintained a strong annual earnings history (A criteria). Due to report earnings for the September period soon. See the latest FSU analysis for more details and a new annotated graph.
>>> The latest Featured Stock Update with an annotated graph appeared on 11/9/2011. Click here.
View all notes |
Alert me of new notes |
CANSLIM.net Company Profile |
SEC |
Zacks Reports |
StockTalk |
News |
Chart |
Request a new note
C
A N
S L
I M
|
UA
-
NYSE
Under Armour Inc Cl A
CONSUMER NON-DURABLES - Textile - Apparel Clothing
|
$80.89
|
-2.88
-3.44% |
$82.92
|
819,481
59.61% of 50 DAV
50 DAV is 1,374,700
|
$87.40
-7.45%
|
10/25/2011
|
$82.43
|
PP = $80.80
|
|
MB = $84.84
|
Most Recent Note - 11/8/2011 1:56:47 PM
Y - Small losses on light volume led to a pullback below its "max buy" level and its color code was changed to yellow again. No resistance remains due to overhead supply following its recent spurt of volume-driven gains. Prior highs near $80 define initial support above its 50 DMA line.
>>> The latest Featured Stock Update with an annotated graph appeared on 11/3/2011. Click here.
View all notes |
Alert me of new notes |
CANSLIM.net Company Profile |
SEC |
Zacks Reports |
StockTalk |
News |
Chart |
Request a new note
C
A N
S L
I M
|
V
-
NYSE
Visa Inc Cl A
DIVERSIFIED SERVICES - Business/Management Services
|
$93.13
|
-1.41
-1.49% |
$94.10
|
4,899,207
92.70% of 50 DAV
50 DAV is 5,285,000
|
$95.87
-2.86%
|
10/24/2011
|
$94.21
|
PP = $94.85
|
|
MB = $99.59
|
Most Recent Note - 11/8/2011 7:28:35 PM
Y - Today's gain on near average volume led to its second best close ever. Still perched within close striking distance of its 52-week high, it did not trigger a proper new technical buy signal since recently highlighted in yellow as an ideal looking set-up. Its 50 DMA line defines near-term chart support to watch.
>>> The latest Featured Stock Update with an annotated graph appeared on 10/24/2011. Click here.
View all notes |
Alert me of new notes |
CANSLIM.net Company Profile |
SEC |
Zacks Reports |
StockTalk |
News |
Chart |
Request a new note
C
A N
S L
I M
|