***Last / Change / Volume data in this table is the closing quote data***
Symbol/Exchange
Company Name
Industry Group |
PRICE |
CHANGE
(%Change) |
Day High |
Volume
(% DAV)
(% 50 day avg vol) |
52 Wk Hi
% From Hi |
Featured
Date |
Price
Featured |
Pivot Featured |
|
Max Buy |
ABV
-
NYSE
Comp De Bebidas Adr
FOOD and BEVERAGE - Beverages - Brewers
|
$139.59
|
-4.73
-3.28% |
$145.36
|
788,701
122.24% of 50 DAV
50 DAV is 645,200
|
$145.36
-3.97%
|
11/4/2010
|
$142.35
|
PP = $143.63
|
|
MB = $150.81
|
 Most Recent Note - 11/9/2010 5:28:51 PM
Y - Down today with above average volume. Its recent low ($133.38 on 10/27/10) defines initial chart support above its 50 DMA line ($127). Color code was changed to yellow after an advanced "3-weeks tight" type pattern, with new pivot point based on its 10/25/10 high plus ten cents. Disciplined investors may consider a powerful technical breakout and close above its pivot point with heavy volume to be a new (or add-on) buy signal.
>>> The latest Featured Stock Update with an annotated graph appeared on 10/11/2010. Click here.
View all notes |
Alert me of new notes |
CANSLIM.net Company Profile |
SEC |
Zacks Reports |
StockTalk |
News |
Chart |
Request a new note
C
A N
S L
I M


|
ARUN
-
NASDAQ
Aruba Networks Inc
COMPUTER HARDWARE - Networking andamp; Communication Dev
|
$22.70
|
-0.45
-1.94% |
$23.47
|
1,192,862
45.50% of 50 DAV
50 DAV is 2,621,600
|
$23.85
-4.82%
|
8/30/2010
|
$18.12
|
PP = $18.51
|
|
MB = $19.44
|
Most Recent Note - 11/8/2010 4:57:51 PM
G - Hovering near its 52-week and all-time highs today with volume totals cooling while it stubbornly holds its ground. Found great support near its 50 DMA line during its choppy 5-week consolidation near its 2007 all-time highs.
>>> The latest Featured Stock Update with an annotated graph appeared on 10/26/2010. Click here.
View all notes |
Alert me of new notes |
CANSLIM.net Company Profile |
SEC |
Zacks Reports |
StockTalk |
News |
Chart |
Request a new note
C
A N
S L
I M
|
BIDU
-
NASDAQ
Baidu Inc Ads
INTERNET - Internet Information Providers
|
$109.19
|
-1.21
-1.10% |
$111.00
|
6,969,738
60.41% of 50 DAV
50 DAV is 11,536,900
|
$113.78
-4.03%
|
9/17/2010
|
$85.73
|
PP = $88.42
|
|
MB = $92.84
|
Most Recent Note - 11/8/2010 5:00:03 PM
G - Volume totals have been cooling while hovering near all-time highs, stubbornly holding its ground. Extended from a sound base pattern now, its 50 DMA line defines important support to watch.
>>> The latest Featured Stock Update with an annotated graph appeared on 10/7/2010. Click here.
View all notes |
Alert me of new notes |
CANSLIM.net Company Profile |
SEC |
Zacks Reports |
StockTalk |
News |
Chart |
Request a new note
C
A N
S L
I M
|
CACC
-
NASDAQ
Credit Acceptance Corp
FINANCIAL SERVICES - Credit Services
|
$60.01
|
-0.54
-0.89% |
$60.52
|
15,984
60.09% of 50 DAV
50 DAV is 26,600
|
$63.45
-5.42%
|
11/3/2010
|
$59.86
|
PP = $63.55
|
|
MB = $66.73
|
Most Recent Note - 11/4/2010 4:39:43 PM
Y - Solid gain today with above average volume after rising above its 50 DMA line on the prior session. A subsequent breakout above its pivot point on heavy volume could trigger a new (or add-on) buy signal, meanwhile it is ideal for investors' watchlists. It reported earnings +26% on +11% sales revenues for the quarter ended September 30, 2010. Its $55.07 low (on 10/04/10) defines the nearest chart support level to watch above its long ago chart highs ($53.97).
>>> The latest Featured Stock Update with an annotated graph appeared on 10/29/2010. Click here.
View all notes |
Alert me of new notes |
CANSLIM.net Company Profile |
SEC |
Zacks Reports |
StockTalk |
News |
Chart |
Request a new note
C
A N
S L
I M
|
CMG
-
NYSE
Chipotle Mexican Grill
LEISURE - Restaurants
|
$227.34
|
-2.56
-1.11% |
$232.00
|
874,592
110.44% of 50 DAV
50 DAV is 791,900
|
$232.33
-2.15%
|
9/1/2010
|
$158.31
|
PP = $155.52
|
|
MB = $163.30
|
Most Recent Note - 11/5/2010 11:20:24 PM
G - Considerable gain today with above average volume for a new all-time high. It is extended from a sound base. Its 50 DMA line defines chart support to watch.
>>> The latest Featured Stock Update with an annotated graph appeared on 10/28/2010. Click here.
View all notes |
Alert me of new notes |
CANSLIM.net Company Profile |
SEC |
Zacks Reports |
StockTalk |
News |
Chart |
Request a new note
C
A N
S L
I M
|
Symbol/Exchange
Company Name
Industry Group |
PRICE |
CHANGE
(%Change) |
Day High |
Volume
(% DAV)
(% 50 day avg vol) |
52 Wk Hi
% From Hi |
Featured
Date |
Price
Featured |
Pivot Featured |
|
Max Buy |
CTRP
-
NASDAQ
Ctrip.Com Intl Ltd Adr
LEISURE - Resorts and Casinos
|
$47.08
|
-0.31
-0.65% |
$48.25
|
2,584,437
136.22% of 50 DAV
50 DAV is 1,897,300
|
$53.16
-11.44%
|
9/24/2010
|
$46.75
|
PP = $47.11
|
|
MB = $49.47
|
Most Recent Note - 11/9/2010 6:07:55 PM
G - A 5th consecutive loss today with above average volume has it testing the previously noted prior highs in the $47 area and its 50 DMA line that define important chart support to watch.
>>> The latest Featured Stock Update with an annotated graph appeared on 9/28/2010. Click here.
View all notes |
Alert me of new notes |
CANSLIM.net Company Profile |
SEC |
Zacks Reports |
StockTalk |
News |
Chart |
Request a new note
C
A N
S L
I M
|
DECK
-
NASDAQ
Deckers Outdoor Corp
CONSUMER NON-DURABLES - Textile - Apparel Footwear
|
$62.85
|
+0.20
0.31% |
$63.50
|
1,279,271
119.30% of 50 DAV
50 DAV is 1,072,300
|
$63.25
-0.63%
|
10/27/2010
|
$54.16
|
PP = $54.86
|
|
MB = $57.60
|
Most Recent Note - 11/5/2010 10:33:19 AM
G - Gapped up today, hitting another new 52-week high and getting more extended from its latest sound base. Prior highs in the $54-56 area define important chart support to watch.
>>> The latest Featured Stock Update with an annotated graph appeared on 10/27/2010. Click here.
View all notes |
Alert me of new notes |
CANSLIM.net Company Profile |
SEC |
Zacks Reports |
StockTalk |
News |
Chart |
Request a new note
C
A N
S L
I M
|
EBIX
-
NASDAQ
Ebix Inc
COMPUTER SOFTWARE and SERVICES - Business Software and Services
|
$25.17
|
-1.11
-4.22% |
$28.21
|
2,788,208
434.57% of 50 DAV
50 DAV is 641,600
|
$26.36
-4.51%
|
9/23/2010
|
$21.78
|
PP = $22.74
|
|
MB = $23.88
|
Most Recent Note - 11/9/2010 5:10:47 PM
G - After gapping up and rallying to new all-time highs on news it reported earnings +72% on +43% sales revenues for the quarter ended September 30, 2010 versus the year ago period, its ugly "negative reversal" for a loss today on more than 4 times average volume raises concerns. Quarterly comparisons have shown impressive earnings acceleration. It was mentioned in a "Ken's Mailbag" article on 11/08/10 (read here). Recent low ($22.12 on 10/26/10) and its 50 DMA line define support, while losses leading to violations would raise concerns and trigger technical sell signals.
>>> The latest Featured Stock Update with an annotated graph appeared on 9/24/2010. Click here.
View all notes |
Alert me of new notes |
CANSLIM.net Company Profile |
SEC |
Zacks Reports |
StockTalk |
News |
Chart |
Request a new note
C
A N
S L
I M
|
EZPW
-
NASDAQ
Ezcorp Inc Cl A
SPECIALTY RETAIL - Specialty Retail, Other
|
$24.96
|
-0.06
-0.24% |
$25.19
|
557,713
193.52% of 50 DAV
50 DAV is 288,200
|
$25.28
-1.27%
|
11/5/2010
|
$24.02
|
PP = $23.85
|
|
MB = $25.04
|
Most Recent Note - 11/9/2010 5:58:43 PM
G - Paused at its all-time high near its "max buy" level today after a streak of consecutive gains with above average volume. Technically, it broke out from a 6-month cup shaped base without a proper handle last week.
>>> The latest Featured Stock Update with an annotated graph appeared on 11/6/2010. Click here.
View all notes |
Alert me of new notes |
CANSLIM.net Company Profile |
SEC |
Zacks Reports |
StockTalk |
News |
Chart |
Request a new note
C
A N
S L
I M
|
FFIV
-
NASDAQ
F 5 Networks Inc
INTERNET - Internet Software and Services
|
$120.42
|
-2.40
-1.95% |
$123.71
|
1,183,500
45.67% of 50 DAV
50 DAV is 2,591,400
|
$125.39
-3.96%
|
6/16/2010
|
$74.50
|
PP = $74.10
|
|
MB = $77.81
|
Most Recent Note - 11/9/2010 5:51:32 PM
G - It is extended from any sound base, holding its ground stubbornly near all-time highs with volume totals cooling. Prior highs in the $112 area define chart initial support.
>>> The latest Featured Stock Update with an annotated graph appeared on 9/13/2010. Click here.
View all notes |
Alert me of new notes |
CANSLIM.net Company Profile |
SEC |
Zacks Reports |
StockTalk |
News |
Chart |
Request a new note
C
A N
S L
I M
|
Symbol/Exchange
Company Name
Industry Group |
PRICE |
CHANGE
(%Change) |
Day High |
Volume
(% DAV)
(% 50 day avg vol) |
52 Wk Hi
% From Hi |
Featured
Date |
Price
Featured |
Pivot Featured |
|
Max Buy |
FOSL
-
NASDAQ
Fossil Inc
CONSUMER DURABLES - Recreational Goods, Other
|
$67.85
|
+3.88
6.07% |
$69.70
|
2,215,647
291.61% of 50 DAV
50 DAV is 759,800
|
$64.00
6.02%
|
10/20/2010
|
$54.12
|
PP = $55.61
|
|
MB = $58.39
|
Most Recent Note - 11/9/2010 12:34:23 PM
G - This high-ranked leader from the Retail/Wholesale Jewelry group reported very strong sales revenues and earnings increases for the quarter ended September 30, 2010 versus the year ago period, and its sales revenues increases have shown impressive acceleration in sequential quarterly comparisons. Gapped up today for a new all-time high, getting very extended from any sound base.
>>> The latest Featured Stock Update with an annotated graph appeared on 10/5/2010. Click here.
View all notes |
Alert me of new notes |
CANSLIM.net Company Profile |
SEC |
Zacks Reports |
StockTalk |
News |
Chart |
Request a new note
C
A N
S L
I M
|
HMSY
-
NASDAQ
H M S Holdings Corp
COMPUTER SOFTWARE and SERVICES - Healthcare Information Service
|
$60.87
|
-0.06
-0.10% |
$61.64
|
159,756
74.76% of 50 DAV
50 DAV is 213,700
|
$62.91
-3.24%
|
9/27/2010
|
$57.97
|
PP = $58.36
|
|
MB = $61.28
|
Most Recent Note - 11/5/2010 11:24:02 PM
Y - Solid gain today with above average volume. Prompt support showed up near its 50 DMA line following its latest earnings report.
>>> The latest Featured Stock Update with an annotated graph appeared on 9/27/2010. Click here.
View all notes |
Alert me of new notes |
CANSLIM.net Company Profile |
SEC |
Zacks Reports |
StockTalk |
News |
Chart |
Request a new note
C
A N
S L
I M
|
HS
-
NYSE
Healthspring Inc
HEALTH SERVICES - Health Care Plans
|
$27.57
|
-0.38
-1.36% |
$28.14
|
461,280
58.61% of 50 DAV
50 DAV is 787,100
|
$29.80
-7.48%
|
8/27/2010
|
$19.91
|
PP = $19.75
|
|
MB = $20.74
|
Most Recent Note - 11/5/2010 11:33:06 PM
G - Finished the week -6.6% off its 52-week high, extended from any sound base. After recently dipping near its 50 DMA line it found prompt support.
>>> The latest Featured Stock Update with an annotated graph appeared on 10/22/2010. Click here.
View all notes |
Alert me of new notes |
CANSLIM.net Company Profile |
SEC |
Zacks Reports |
StockTalk |
News |
Chart |
Request a new note
C
A N
S L
I M
|
IGTE
-
NASDAQ
Igate Corp
COMPUTER SOFTWARE and SERVICES - Information Technology Service
|
$22.05
|
+0.37
1.71% |
$22.13
|
1,273,657
200.67% of 50 DAV
50 DAV is 634,700
|
$21.75
1.38%
|
10/26/2010
|
$17.29
|
PP = $19.55
|
|
MB = $20.53
|
Most Recent Note - 11/9/2010 5:54:13 PM
G - Gain today for another new high with above average volume, getting more extended from its latest base. Prior chart highs in the $19 area define initial chart support above its 50 DMA line.
>>> The latest Featured Stock Update with an annotated graph appeared on 9/10/2010. Click here.
View all notes |
Alert me of new notes |
CANSLIM.net Company Profile |
SEC |
Zacks Reports |
StockTalk |
News |
Chart |
Request a new note
C
A N
S L
I M
|
JOBS
-
NASDAQ
Fifty One Job Inc Ads
DIVERSIFIED SERVICES - Staffing and; Outsourcing Service
|
$48.20
|
-1.13
-2.29% |
$51.00
|
408,458
223.81% of 50 DAV
50 DAV is 182,500
|
$49.50
-2.63%
|
10/13/2010
|
$42.07
|
PP = $40.60
|
|
MB = $42.63
|
Most Recent Note - 11/9/2010 5:40:40 PM
G - Reported earnings +73% on +26% sales revenues for the quarter ended September 30, 2010 versus the year ago period after today's close. It negatively reversed on above average volume. Recently noted - "It is extended +100% above its 200 DMA line, prompting some caution. After 6 consecutive monthly gains it is also near its 2004-2005 all-time highs in the $53-55 area. Its small supply of only 27.6 million shares (S criteria) could make for volatile action in the event of institutional buying or selling."
>>> The latest Featured Stock Update with an annotated graph appeared on 9/16/2010. Click here.
View all notes |
Alert me of new notes |
CANSLIM.net Company Profile |
SEC |
Zacks Reports |
StockTalk |
News |
Chart |
Request a new note
C
A N
S L
I M
|
Symbol/Exchange
Company Name
Industry Group |
PRICE |
CHANGE
(%Change) |
Day High |
Volume
(% DAV)
(% 50 day avg vol) |
52 Wk Hi
% From Hi |
Featured
Date |
Price
Featured |
Pivot Featured |
|
Max Buy |
LFT
-
NYSE
Longtop Financl Tech Ads
COMPUTER SOFTWARE and SERVICES - Business Software and Services
|
$41.99
|
+0.01
0.02% |
$42.19
|
366,565
72.32% of 50 DAV
50 DAV is 506,900
|
$42.59
-1.41%
|
11/5/2010
|
$41.83
|
PP = $40.96
|
|
MB = $43.01
|
Most Recent Note - 11/9/2010 6:19:50 PM
Y - Inching higher on light volume this week. Big gains last week including a strong close on 11/05/10 with heavy volume confirmed a technical buy signal. Color code was changed to yellow with its new pivot point cited based on its 10/14/10 high plus 10 cents.
>>> The latest Featured Stock Update with an annotated graph appeared on 10/14/2010. Click here.
View all notes |
Alert me of new notes |
CANSLIM.net Company Profile |
SEC |
Zacks Reports |
StockTalk |
News |
Chart |
Request a new note
C
A N
S L
I M
|
LULU
-
NASDAQ
Lululemon Athletica
MANUFACTURING - Textile Manufacturing
|
$48.18
|
-1.37
-2.76% |
$49.75
|
1,178,336
92.38% of 50 DAV
50 DAV is 1,275,500
|
$49.74
-3.14%
|
10/8/2010
|
$47.66
|
PP = $46.67
|
|
MB = $49.00
|
Most Recent Note - 11/9/2010 5:33:48 PM
Y - Down today on light volume, consolidating in a healthy fashion just under its "max buy" level, so its color code is changed to yellow again. Considerable gains with above average volume recently provided a confirming signs of institutional accumulation. Recent lows in the $42 area define support to watch now coinciding near its 50 DMA line.
>>> The latest Featured Stock Update with an annotated graph appeared on 10/8/2010. Click here.
View all notes |
Alert me of new notes |
CANSLIM.net Company Profile |
SEC |
Zacks Reports |
StockTalk |
News |
Chart |
Request a new note
C
A N
S L
I M
|
MWIV
-
NASDAQ
M W I Veterinary Supply
HEALTH SERVICES - Medical Instruments and; Supplies
|
$58.44
|
+0.03
0.05% |
$59.17
|
28,162
48.98% of 50 DAV
50 DAV is 57,500
|
$63.94
-8.60%
|
11/4/2010
|
$61.79
|
PP = $59.60
|
|
MB = $62.58
|
Most Recent Note - 11/9/2010 6:13:10 PM
Y - Volume totals have cooled recently after its pullback under its pivot point raised concerns. It has slumped since a new pivot point was recently cited based on its 52-week high plus 10 cents. Its 50 DMA line defines a very important support level.
>>> The latest Featured Stock Update with an annotated graph appeared on 11/2/2010. Click here.
View all notes |
Alert me of new notes |
CANSLIM.net Company Profile |
SEC |
Zacks Reports |
StockTalk |
News |
Chart |
Request a new note
C
A N
S L
I M
|
NEM
-
NYSE
Newmont Mining Corp
METALS and MINING - Gold
|
$60.51
|
-2.12
-3.38% |
$63.77
|
12,380,797
185.21% of 50 DAV
50 DAV is 6,684,800
|
$65.50
-7.62%
|
8/31/2010
|
$61.32
|
PP = $63.48
|
|
MB = $66.65
|
Most Recent Note - 11/9/2010 5:25:54 PM
G - Gapped up today and then reversed for damaging loss with nearly twice average volume, closing below its 50 DMA line. The distributional action raises concerns, meanwhile its Relative Strength rank has also slumped to 70, below the 80+ guideline. Recent lows in the $57 area define near-term support above its 200 DMA line.
>>> The latest Featured Stock Update with an annotated graph appeared on 9/14/2010. Click here.
View all notes |
Alert me of new notes |
CANSLIM.net Company Profile |
SEC |
Zacks Reports |
StockTalk |
News |
Chart |
Request a new note
C
A N
S L
I M
|
NEOG
-
NASDAQ
Neogen Corp
DRUGS - Diagnostic Substances
|
$35.80
|
-0.61
-1.68% |
$36.42
|
77,762
73.99% of 50 DAV
50 DAV is 105,100
|
$36.70
-2.45%
|
9/1/2010
|
$30.79
|
PP = $30.49
|
|
MB = $32.01
|
Most Recent Note - 11/4/2010 4:49:19 PM
Y - Considerable gain today with above average volume for a new 52-week high. Rallying up from its 10 week moving average, it may be considered buyable up to +5% above its recent high ($36.37 plus 5%) as a secondary buy point following its earlier technical breakout, however a new pivot point has not been cited because it did not form a sound new base pattern.
>>> The latest Featured Stock Update with an annotated graph appeared on 10/13/2010. Click here.
View all notes |
Alert me of new notes |
CANSLIM.net Company Profile |
SEC |
Zacks Reports |
StockTalk |
News |
Chart |
Request a new note
C
A N
S L
I M
|
Symbol/Exchange
Company Name
Industry Group |
PRICE |
CHANGE
(%Change) |
Day High |
Volume
(% DAV)
(% 50 day avg vol) |
52 Wk Hi
% From Hi |
Featured
Date |
Price
Featured |
Pivot Featured |
|
Max Buy |
NFLX
-
NASDAQ
Netflix Inc
SPECIALTY RETAIL - Music and Video Stores
|
$170.46
|
+1.33
0.79% |
$174.82
|
5,751,245
102.98% of 50 DAV
50 DAV is 5,584,700
|
$184.74
-7.73%
|
11/9/2010
|
$173.10
|
PP = $184.84
|
|
MB = $194.08
|
Most Recent Note - 11/9/2010 10:27:50 AM
Y - Consolidating -6% off its 52-week high with volume totals cooling in recent weeks after volume-driven gains. It has formed an advanced "ascending base" type pattern marked by 3 pullbacks in the 10-20% range since its earlier technical breakout (on 8/10/10) from a double bottom base. Color code is changed to yellow with new pivot point cited based on its 52-week high plus ten cents. A subsequent breakout with heavy volume would signal a new (or add-on) technical buy signal, however it is a riskier "late stage" set-up.
>>> The latest Featured Stock Update with an annotated graph appeared on 10/1/2010. Click here.
View all notes |
Alert me of new notes |
CANSLIM.net Company Profile |
SEC |
Zacks Reports |
StockTalk |
News |
Chart |
Request a new note
C
A N
S L
I M
|
NTAP
-
NASDAQ
Netapp Inc
COMPUTER HARDWARE - Data Storage Devices
|
$56.63
|
+0.66
1.18% |
$57.16
|
6,169,855
84.97% of 50 DAV
50 DAV is 7,260,900
|
$56.00
1.13%
|
9/8/2010
|
$46.98
|
PP = $44.99
|
|
MB = $47.24
|
Most Recent Note - 11/9/2010 10:35:39 AM
G - Hitting new highs today while wedging higher for its 8th consecutive gain with light volume, extended from any sound base. Its 50 DMA line defines important chart support to watch.
>>> The latest Featured Stock Update with an annotated graph appeared on 11/3/2010. Click here.
View all notes |
Alert me of new notes |
CANSLIM.net Company Profile |
SEC |
Zacks Reports |
StockTalk |
News |
Chart |
Request a new note
C
A N
S L
I M
|
ORCL
-
NASDAQ
Oracle Corp
COMPUTER SOFTWARE and SERVICES - Application Software
|
$28.74
|
-0.30
-1.03% |
$29.25
|
34,611,493
84.68% of 50 DAV
50 DAV is 40,875,600
|
$29.82
-3.62%
|
9/20/2010
|
$27.32
|
PP = $26.73
|
|
MB = $28.07
|
Most Recent Note - 11/9/2010 6:04:59 PM
G - Remains perched less than -4% off its 52-week highs, and volume totals have been cooling in recent weeks. Prior highs and its 50 DMA line define chart support in the $27 area. It was barely changed on recent news it agreed to buy Art Technology Group (ARTG) for $1 billion.
>>> The latest Featured Stock Update with an annotated graph appeared on 9/20/2010. Click here.
View all notes |
Alert me of new notes |
CANSLIM.net Company Profile |
SEC |
Zacks Reports |
StockTalk |
News |
Chart |
Request a new note
C
A N
S L
I M
|
PAY
-
NYSE
Verifone Systems Inc
COMPUTER HARDWARE - Transaction Automation Systems
|
$34.53
|
-0.38
-1.09% |
$35.35
|
593,622
42.76% of 50 DAV
50 DAV is 1,388,400
|
$35.94
-3.92%
|
8/25/2010
|
$24.30
|
PP = $23.74
|
|
MB = $24.93
|
Most Recent Note - 11/4/2010 4:45:03 PM
G - Small gap up gain today, hitting another new all-time high. Extended from a sound base pattern. A prior high ($31.40) defines initial chart support above its 50 DMA line.
>>> The latest Featured Stock Update with an annotated graph appeared on 10/25/2010. Click here.
View all notes |
Alert me of new notes |
CANSLIM.net Company Profile |
SEC |
Zacks Reports |
StockTalk |
News |
Chart |
Request a new note
C
A N
S L
I M
|
PRGO
-
NASDAQ
Perrigo Co
DRUGS - Drug Related Products
|
$59.74
|
-4.29
-6.70% |
$64.24
|
4,406,209
536.04% of 50 DAV
50 DAV is 822,000
|
$68.38
-12.64%
|
9/15/2010
|
$63.73
|
PP = $64.76
|
|
MB = $68.00
|
Most Recent Note - 11/9/2010 5:05:49 PM
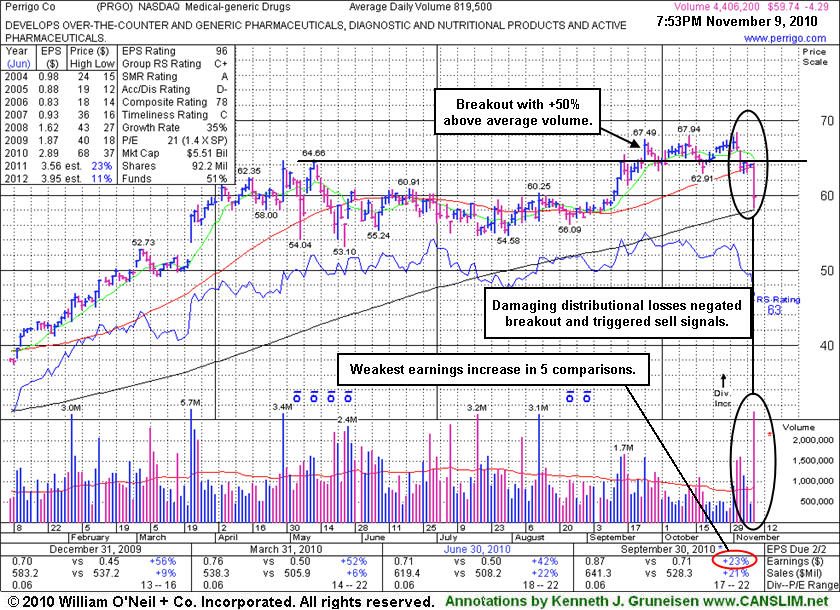
G - Down considerably today with more than 5 times average volume, violating its 50 DMA line and prior lows triggering technical sell signals. While it may find support near its 200 DMA line, only a prompt rebound above its short-term average would help its outlook. Based on deterioration it will be dropped from the Featured Stocks list tonight. Reported its smallest percentage earnings increase in 5 quarters, after +73%, +56%, +52%, +42%, in the Sept '09, Dec '09, Mar '10, and Jun '10 quarters respectively versus the year ago periods, its earnings were up just +23% for the latest quarter ended September 30, 2010.
>>> The latest Featured Stock Update with an annotated graph appeared on 11/9/2010. Click here.
View all notes |
Alert me of new notes |
CANSLIM.net Company Profile |
SEC |
Zacks Reports |
StockTalk |
News |
Chart |
Request a new note
C
A N
S L
I M
|
Symbol/Exchange
Company Name
Industry Group |
PRICE |
CHANGE
(%Change) |
Day High |
Volume
(% DAV)
(% 50 day avg vol) |
52 Wk Hi
% From Hi |
Featured
Date |
Price
Featured |
Pivot Featured |
|
Max Buy |
RAX
-
NYSE
Rackspace Hosting Inc
INTERNET - Internet Software and; Services
|
$27.06
|
+0.77
2.93% |
$27.98
|
4,602,993
181.14% of 50 DAV
50 DAV is 2,541,100
|
$27.94
-3.15%
|
9/21/2010
|
$22.84
|
PP = $23.61
|
|
MB = $24.79
|
Most Recent Note - 11/9/2010 1:48:35 PM
G - This high-ranked Internet - Network Solutions firm gapped up today and touched a new all-time high. Reported earnings +50% on +23% sales revenues for the quarter ended September 30, 2010 versus the year ago period.
>>> The latest Featured Stock Update with an annotated graph appeared on 9/21/2010. Click here.
View all notes |
Alert me of new notes |
CANSLIM.net Company Profile |
SEC |
Zacks Reports |
StockTalk |
News |
Chart |
Request a new note
C
A N
S L
I M
|
ROVI
-
NASDAQ
Rovi Corp
COMPUTER SOFTWARE andamp; SERVICES - Security Software andamp; Services
|
$52.73
|
+1.11
2.15% |
$52.04
|
1,447,601
90.57% of 50 DAV
50 DAV is 1,598,300
|
$53.26
-1.00%
|
10/29/2010
|
$49.99
|
PP = $53.10
|
|
MB = $55.76
|
Most Recent Note - 11/9/2010 11:24:11 AM
Y - Hit a new 52 week high today after a small gap up. A convincing breakout above its pivot point with volume conviction would trigger a new (or add-on) technical buy signal. Meanwhile, support to watch is defined by its 50 DMA line.
>>> The latest Featured Stock Update with an annotated graph appeared on 10/20/2010. Click here.
View all notes |
Alert me of new notes |
CANSLIM.net Company Profile |
SEC |
Zacks Reports |
StockTalk |
News |
Chart |
Request a new note
C
A N
S L
I M
|
SHOO
-
NASDAQ
Steven Madden Limited
CONSUMER NON-DURABLES - Textile - Apparel Footwear
|
$41.32
|
+0.12
0.29% |
$41.49
|
275,480
78.89% of 50 DAV
50 DAV is 349,200
|
$44.85
-7.87%
|
9/15/2010
|
$38.94
|
PP = $40.27
|
|
MB = $42.28
|
Most Recent Note - 11/8/2010 5:02:33 PM
G - Recently finding support near its 50 DMA line and prior chart highs in the $40 area. More damaging losses leading to a close below its short-term average would raise concerns and trigger technical sell signals.
>>> The latest Featured Stock Update with an annotated graph appeared on 9/29/2010. Click here.
View all notes |
Alert me of new notes |
CANSLIM.net Company Profile |
SEC |
Zacks Reports |
StockTalk |
News |
Chart |
Request a new note
C
A N
S L
I M
|
SLW
-
NYSE
Silver Wheaton Corp
METALS and; MINING - Silver
|
$32.31
|
-2.76
-7.87% |
$35.12
|
34,896,053
483.15% of 50 DAV
50 DAV is 7,222,600
|
$35.12
-8.00%
|
8/25/2010
|
$21.40
|
PP = $21.99
|
|
MB = $23.09
|
Most Recent Note - 11/9/2010 4:41:21 PM
G - Today's largest point loss on the heaviest volume ever may be considered a technical sell signal after climactic gains for new all-time highs. Very extended from any sound base, this high-ranked leader has been recently noted as - "One of the strongest names in the Mining - Gold/Silver/Gems group currently included on the Featured Stocks list."
>>> The latest Featured Stock Update with an annotated graph appeared on 10/18/2010. Click here.
View all notes |
Alert me of new notes |
CANSLIM.net Company Profile |
SEC |
Zacks Reports |
StockTalk |
News |
Chart |
Request a new note
C
A N
S L
I M
|
STRI
-
NYSE
S T R Holdings Inc
ELECTRONICS - Semiconductor - Specialized
|
$26.55
|
-1.13
-4.08% |
$27.78
|
846,916
166.16% of 50 DAV
50 DAV is 509,700
|
$27.78
-4.43%
|
11/8/2010
|
$26.52
|
PP = $26.43
|
|
MB = $27.75
|
Most Recent Note - 11/9/2010 5:16:41 PM
Y - Reversed for a loss with above average volume today after a small gap up and new 52-week high, yet it remains above its pivot point. STRI technically broke out on the prior session with much heavier volume. Study the latest FSU section analysis for additional details with an annotated graph.
>>> The latest Featured Stock Update with an annotated graph appeared on 11/8/2010. Click here.
View all notes |
Alert me of new notes |
CANSLIM.net Company Profile |
SEC |
Zacks Reports |
StockTalk |
News |
Chart |
Request a new note
C
A N
S L
I M
|
Symbol/Exchange
Company Name
Industry Group |
PRICE |
CHANGE
(%Change) |
Day High |
Volume
(% DAV)
(% 50 day avg vol) |
52 Wk Hi
% From Hi |
Featured
Date |
Price
Featured |
Pivot Featured |
|
Max Buy |
UA
-
NYSE
Under Armour Inc Cl A
CONSUMER NON-DURABLES - Textile - Apparel Clothing
|
$51.26
|
-0.50
-0.97% |
$51.99
|
637,313
81.20% of 50 DAV
50 DAV is 784,900
|
$51.99
-1.40%
|
9/9/2010
|
$39.99
|
PP = $40.10
|
|
MB = $42.11
|
Most Recent Note - 11/8/2010 4:47:44 PM
G - Considerable gain today for yet another new high, getting more extended from any sound base. Quarterly and annual earnings track record has some fundamental flaws with respect to the fact-based investment system. See the latest FSU analysis for more important details.
>>> The latest Featured Stock Update with an annotated graph appeared on 11/4/2010. Click here.
View all notes |
Alert me of new notes |
CANSLIM.net Company Profile |
SEC |
Zacks Reports |
StockTalk |
News |
Chart |
Request a new note
C
A N
S L
I M
|
ULTA
-
NASDAQ
Ulta Salon Cosm & Frag
SPECIALTY RETAIL - Specialty Retail, Other
|
$32.61
|
-0.42
-1.27% |
$33.50
|
241,181
36.86% of 50 DAV
50 DAV is 654,300
|
$33.50
-2.66%
|
9/3/2010
|
$26.36
|
PP = $25.89
|
|
MB = $27.18
|
Most Recent Note - 11/8/2010 4:51:09 PM
G - Wedged up to a new 52-week high with a 5th consecutive gain today on light volume. Its 50 DMA line defines support to watch above prior chart highs in the $26 area, meanwhile it is extended from a sound base pattern.
>>> The latest Featured Stock Update with an annotated graph appeared on 11/1/2010. Click here.
View all notes |
Alert me of new notes |
CANSLIM.net Company Profile |
SEC |
Zacks Reports |
StockTalk |
News |
Chart |
Request a new note
C
A N
S L
I M
|
VIT
-
NYSE
Vanceinfo Tech Inc Ads
COMPUTER SOFTWARE and SERVICES - Business Software and Services
|
$36.59
|
-1.41
-3.71% |
$38.10
|
384,821
63.54% of 50 DAV
50 DAV is 605,600
|
$38.43
-4.79%
|
7/8/2010
|
$25.20
|
PP = $26.58
|
|
MB = $27.91
|
Most Recent Note - 11/9/2010 5:18:54 PM
G - Negatively reversed near all-time highs today, finishing with a loss on light volume. It is extended from any sound base pattern. Meanwhile, its 50 DMA line defines important chart support to watch.
>>> The latest Featured Stock Update with an annotated graph appeared on 10/21/2010. Click here.
View all notes |
Alert me of new notes |
CANSLIM.net Company Profile |
SEC |
Zacks Reports |
StockTalk |
News |
Chart |
Request a new note
C
A N
S L
I M
|
WCRX
-
NASDAQ
Warner Chilcott Plc
DRUGS - Drug Manufacturers - Other
|
$20.89
|
+0.74
3.67% |
$22.50
|
8,908,552
333.80% of 50 DAV
50 DAV is 2,668,800
|
$25.32
-17.50%
|
8/23/2010
|
$21.04
|
PP = $20.84
|
|
MB = $21.88
|
Most Recent Note - 11/9/2010 5:45:06 PM
G - Up today with above average volume, rallying up from support at prior chart resistance in the $20 area and its 200 DMA line that now define important support levels to watch. Based on its technical breakdown this week it will be dropped from the Featured Stocks list tonight.
>>> The latest Featured Stock Update with an annotated graph appeared on 10/15/2010. Click here.
View all notes |
Alert me of new notes |
CANSLIM.net Company Profile |
SEC |
Zacks Reports |
StockTalk |
News |
Chart |
Request a new note
C
A N
S L
I M
|