You are not logged in.
This means you
CAN ONLY VIEW reports that were published prior to Monday, April 14, 2025.
You
MUST UPGRADE YOUR MEMBERSHIP if you want to see any current reports.
AFTER MARKET UPDATE - MONDAY, NOVEMBER 9TH, 2009
Previous After Market Report Next After Market Report >>>
|
|
|
|
DOW |
+203.52 |
10,226.94 |
+2.03% |
|
Volume |
1,235,986,580 |
+16% |
|
Volume |
2,080,708,910 |
+12% |
|
NASDAQ |
+41.62 |
2,154.06 |
+1.97% |
|
Advancers |
2,545 |
82% |
|
Advancers |
1,897 |
67% |
|
S&P 500 |
+23.78 |
1,093.08 |
+2.22% |
|
Decliners |
494 |
16% |
|
Decliners |
833 |
29% |
|
Russell 2000 |
+11.96 |
592.31 |
+2.06% |
|
52 Wk Highs |
220 |
|
|
52 Wk Highs |
99 |
|
|
S&P 600 |
+6.68 |
313.76 |
+2.18% |
|
52 Wk Lows |
2 |
|
|
52 Wk Lows |
20 |
|
|
 |
Follow-Through Gains And Expansion in Leadership Confirm New Rally
Adam Sarhan, Contributing Writer,
The major averages scored a follow-through day (FTD) after the Group of 20 largest industrial nations agreed to maintain their economic stimulus package as the global economy continues to recover. This sent the US dollar tumbling and a slew of stocks and commodities higher. Volume, a critical component of institutional demand, was higher than Friday's levels as the major averages rallied. Advancers trumped decliners by over a 5-to-1 ratio on the NYSE and by over a 2-to-1 ratio on the Nasdaq exchange. There were 52 high-ranked companies from the CANSLIM.net Leaders List making a new 52-week high and appearing on the CANSLIM.net BreakOuts Page, higher than the 30 issue that appeared on the prior session. In terms of new leadership, it was encouraging to see new 52-week highs outnumber new 52-week lows on the NYSE and Nasdaq exchange.
Make no mistake about it, this market is strong. On every rally since the initial lows in March 2009, each pullback has been less than -8% and the bulls have promptly showed up to quell the bearish pressure. The latest correction began on October 28, 2009 and ended on (today) November 9, 2009 when this rally-attempt was confirmed. To avoid any confusion, the official status of the market changed from "rally attempt" to "confirmed rally." Now that the market is back in a confirmed rally, growth investors have a green light for buying stocks when they trigger fresh technical buy signals and break out of sound bases.
The falling dollar sent gold to a fresh record high above $1,100 an ounce and sent the Dow Jones Industrial Average to a fresh 2009 high and a 13-month high. A slew of gold stocks surged as gold rallied to fresh highs and the dollar fell. The stock market remains strong as long as the US dollar continues to fall and the global economic stimulus package continues. Bloomberg.com reported that U.K. Chancellor of the Exchequer Alistair Darling, hosted the meeting where finance ministers from the 20 largest industrialized nations met to discuss keeping interest rates low as the global economy continues to recover.
PICTURED: The Dow Jones Industrial Average surged to a fresh 2009 high and scored a FTD which confirmed its latest rally attempt.
|
|
|
 |
Financial Group Showing Encouraging Resilience Again
Kenneth J. Gruneisen - Passed the CAN SLIM® Master's Exam
The Broker/Dealer Index ($XBD +2.68%) and Bank Index ($BKX +3.55%) posted gains and helped underpin the market rally on Monday, yet there were widespread gains lifting virtually all groups. The Gold & Silver Index ($XAU +4.03%) and Oil Services Index ($OSX +3.34%) were among the standout gainers while the Integrated Oil Index ($XOI +1.41%) followed with a smaller gain. The Semiconductor Index ($SOX +3.15%) led the tech sector and outpaced the Internet Index ($IIX +1.48%) and Networking Index ($NWX +1.66%), meanwhile the Biotechnology Index ($BTK +0.64%) posted a smaller gain. The Retail Index ($RLX +1.96%) and Healthcare Index ($HMO +2.02%) rounded out a unanimously higher session.
Charts courtesy www.stockcharts.com
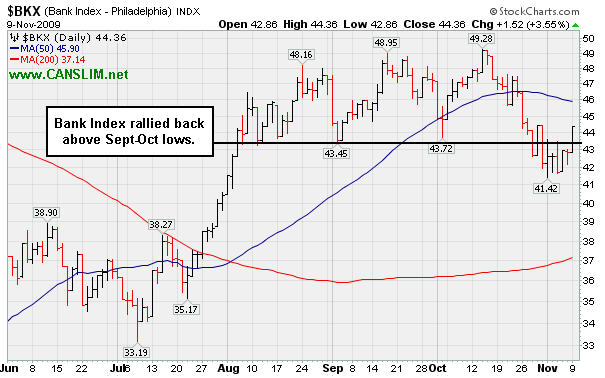
PICTURED 1: The Bank Index ($BKX +3.55%) rallied back above its September-October lows, which is an encouraging sign that bank stocks are showing resilience. The gain today also put it in positive territory for 2009.
Charts courtesy www.stockcharts.com

PICTURED 2: The Broker/Dealer Index ($XBD +2.68%) rallied to a close back above its 50-day moving average line, an impressive sign of strength after recent deterioration below that important short-term average had raised concerns.
| Oil Services |
$OSX |
201.00 |
+6.50 |
+3.34% |
+65.58% |
| Healthcare |
$HMO |
1,301.26 |
+25.73 |
+2.02% |
+35.52% |
| Integrated Oil |
$XOI |
1,098.16 |
+15.24 |
+1.41% |
+12.09% |
| Semiconductor |
$SOX |
311.26 |
+9.50 |
+3.15% |
+46.70% |
| Networking |
$NWX |
228.63 |
+3.74 |
+1.66% |
+58.89% |
| Internet |
$IIX |
222.79 |
+3.25 |
+1.48% |
+66.55% |
| Broker/Dealer |
$XBD |
117.83 |
+3.07 |
+2.68% |
+52.10% |
| Retail |
$RLX |
403.08 |
+7.74 |
+1.96% |
+44.34% |
| Gold & Silver |
$XAU |
180.85 |
+7.01 |
+4.03% |
+46.02% |
| Bank |
$BKX |
44.36 |
+1.52 |
+3.55% |
+0.09% |
| Biotech |
$BTK |
896.25 |
+5.70 |
+0.64% |
+38.49% |
|
|
|
 |
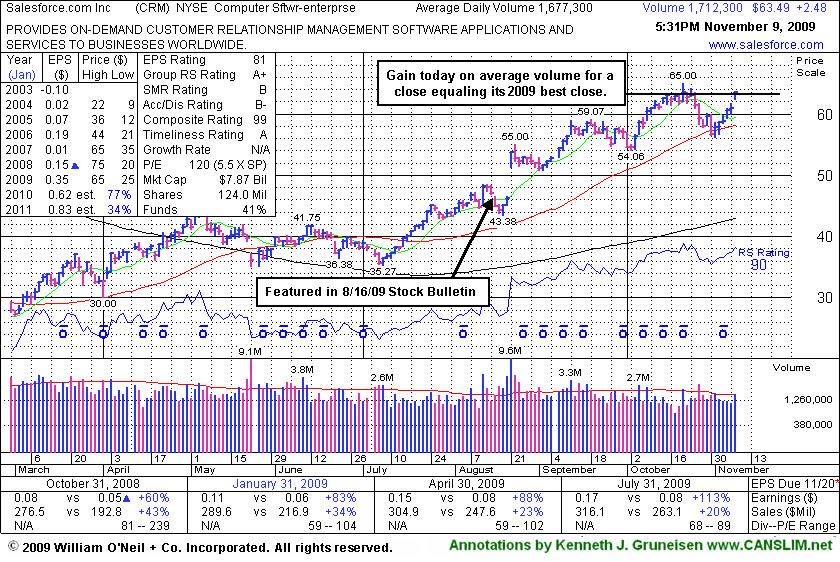
Gain Today Equals Best 2009 Close
Kenneth J. Gruneisen - Passed the CAN SLIM® Master's Exam
Salesforce.com, Inc. (CRM +$2.48 or +4.06% to $63.49) posted a gain today and equaled its best 2009 high close as it posted a 6th consecutive gain on near average volume. Gains last week on quiet volume helped it find support and rally up from its 50-day moving average (DMA) line. Volume was not extremely heavy behind any of the recent losses, however deterioration had nonetheless led to technical sell signals as it briefly violated its 50 DMA line, prior chart highs in the $59 area, and an upward trendline. Now, any violation of its recent chart lows in the $56 area would raise more serious concerns and trigger more worrisome technical sell signals. The number of top-rated funds owning its shares rose from 269 in Sept '08 to 297 in Jun '09, which is reassuring news concerning the I criteria.
In its last FSU section appearance on 10/27/09 under the headline, "Profit Taking Pressures Mount As Distribution Troubles Market" it was said that - "The weak action in the stock coupled with the broader market deterioration (M criteria) suggests that it might be appropriate for investors to lock in profits under the investment system guidelines, especially if more worrisome losses lead to violations at the above mentioned levels." The resilience shown by the stock, coupled with the market's latest follow-through- day (today), bodes well for investors who may still be holding any existing positions even after the recent pullback raised concerns. It has not formed a sound new base, but patience may allow for additional disciplined entry points to show up eventually.
|
|
|
Color Codes Explained :
Y - Better candidates highlighted by our
staff of experts.
G - Previously featured
in past reports as yellow but may no longer be buyable under the
guidelines.
***Last / Change / Volume quote data in this table corresponds with the timestamp on the note***
Symbol/Exchange
Company Name
Industry Group |
Last |
Chg. |
Vol
% DAV |
Date Featured |
Price Featured |
Latest Pivot Point
Featured |
Status |
| Latest Max Buy Price |
ARST
-
|
$26.25
|
+0.02
|
685,270
102% DAV
670,900
|
9/1/2009
(Date
Featured) |
$19.91
(Price
Featured) |
PP = $20.90 |
G |
| MB = $21.95 |
Most Recent Note - 11/9/2009 6:24:52 PM
G - Rallied today for another new all-time high but closed near the session low almost unchnaged. Color code remains green while dismissing its 10/15/09 high as a new pivot point, with concern over its "late stage" action without a recent base of substantial length. ARST was first featured in yellow at $19.91 in the 9/01/09 mid-day report with an annotated daily graph (read here).
>>> The latest Featured Stock Update with an annotated graph appeared on 11/6/2009. click here.
|
|
C
A
S
I |
News |
Chart |
SEC
View all notes Alert
me of new notes
Company
Profile
|
ASIA
-
|
$24.95
|
+1.52
|
1,716,989
213% DAV
805,700
|
10/14/2009
(Date
Featured) |
$23.05
(Price
Featured) |
PP = $22.19 |
G |
| MB = $23.30 |
Most Recent Note - 11/9/2009 6:27:18 PM
G - Gapped up today for a gain with above average volume, rising well above its previously noted "max buy" level so its color code is changed to green. Featured 10/14/09 in the mid-day report (read here) as it gapped up for a new 52-week high with 5 times average volume, triggering a technical buy signal by blasting above its pivot point. First featured in the August 2009 CANSLIM.net News (read here).
>>> The latest Featured Stock Update with an annotated graph appeared on 10/30/2009. click here.
|
|
C
A
S
I |
News |
Chart |
SEC
View all notes Alert
me of new notes
Company
Profile
|
BIDU
- NASDAQ
Baidu Inc Ads
INTERNET - Internet Information Providers
|
$425.87
|
+16.13
|
2,606,044
135% DAV
1,932,400
|
9/8/2009
(Date
Featured) |
$351.80
(Price
Featured) |
PP = $368.59 |
G |
| MB = $387.02 |
Most Recent Note - 11/9/2009 6:30:20 PM
G - Gapped up today for a 5th consecutive gain on near average volume. Proved resilient near its 50 DMA line after its 10/27/09 gap down. As recently noted, "Choppy action has not allowed it to form a sound base in recent weeks." BIDU traded up as much as +23% from its price when featured in yellow in the 9/08/09 Mid-Day BreakOuts Report (read here).
>>> The latest Featured Stock Update with an annotated graph appeared on 10/28/2009. click here.
|
|
C
A
S
I |
News |
Chart |
SEC
View all notes Alert
me of new notes
Company
Profile
|
CACC
- NASDAQ
Credit Acceptance Corp
FINANCIAL SERVICES - Credit Services
|
$34.39
|
+0.26
|
38,624
101% DAV
38,200
|
9/29/2009
(Date
Featured) |
$33.48
(Price
Featured) |
PP = $32.60 |
G |
| MB = $34.23 |
Most Recent Note - 11/9/2009 6:31:28 PM
G - Gain today on average volume. Consolidating in an orderly fashion above prior chart highs and its 50 DMA line in the $32 area, an important level to watch on pullbacks. The Finance - Consumer/Commercial Loans firm has maintained a great track record of annual and quarterly sales revenues and earnings increases. It was featured on 9/29/09 in yellow in the mid-day report (read here).
>>> The latest Featured Stock Update with an annotated graph appeared on 11/5/2009. click here.
|
|
C
A
S
I |
News |
Chart |
SEC
View all notes Alert
me of new notes
Company
Profile
|
CRM
- NYSE
Salesforce.com Inc
INTERNET - Internet Software & Services
|
$63.49
|
+2.48
|
1,714,997
85% DAV
2,012,800
|
8/16/2009
(Date
Featured) |
$47.12
(Price
Featured) |
PP = $45.59 |
G |
| MB = $47.87 |
Most Recent Note - 11/9/2009 6:35:08 PM
G - Gap up gain today on average volume. Found support and rallied up from its 50 DMA line last week after noted technical deterioration raised some concerns. Recent chart lows in the $56 area are important support now, and any violation would raise more serious concerns and trigger more worrisome technical sell signals.
>>> The latest Featured Stock Update with an annotated graph appeared on 11/9/2009. click here.
|
|
C
A
S
I |
News |
Chart |
SEC
View all notes Alert
me of new notes
Company
Profile
|
GMCR
- NASDAQ
Green Mtn Coffee Roastrs
FOOD & BEVERAGE - Processed & Packaged Goods
|
$70.67
|
+3.06
|
1,090,448
90% DAV
1,213,500
|
10/5/2009
(Date
Featured) |
$71.11
(Price
Featured) |
PP = $75.89 |
G |
| MB = $79.68 |
Most Recent Note - 11/9/2009 6:37:02 PM
G - Gain today on average volume, rising up from its 50 DMA line ($68.33). Further deterioration under recent lows near $65 would raise more serious concerns.
>>> The latest Featured Stock Update with an annotated graph appeared on 10/29/2009. click here.
|
|
C
A
S
I |
News |
Chart |
SEC
View all notes Alert
me of new notes
Company
Profile
|
|
|
|
THESE ARE NOT BUY RECOMMENDATIONS!
Comments contained in the body of this report are technical
opinions only. The material herein has been obtained
from sources believed to be reliable and accurate, however,
its accuracy and completeness cannot be guaranteed.
This site is not an investment advisor, hence it does
not endorse or recommend any securities or other investments.
Any recommendation contained in this report may not
be suitable for all investors and it is not to be deemed
an offer or solicitation on our part with respect to
the purchase or sale of any securities. All trademarks,
service marks and trade names appearing in this report
are the property of their respective owners, and are
likewise used for identification purposes only.
This report is a service available
only to active Paid Premium Members.
You may opt-out of receiving report notifications
at any time. Questions or comments may be submitted
by writing to Premium Membership Services 665 S.E. 10 Street, Suite 201 Deerfield Beach, FL 33441-5634 or by calling 1-800-965-8307
or 954-785-1121.
|
|
|


