You are not logged in.
This means you
CAN ONLY VIEW reports that were published prior to Monday, April 14, 2025.
You
MUST UPGRADE YOUR MEMBERSHIP if you want to see any current reports.
AFTER MARKET UPDATE - TUESDAY, NOVEMBER 8TH, 2011
Previous After Market Report Next After Market Report >>>
|
|
|
|
DOW |
+102.02 |
12,170.41 |
+0.85% |
|
Volume |
879,636,070 |
+12% |
|
Volume |
1,808,394,160 |
+8% |
|
NASDAQ |
+32.24 |
2,727.49 |
+1.20% |
|
Advancers |
2,197 |
71% |
|
Advancers |
1,832 |
69% |
|
S&P 500 |
+14.81 |
1,275.93 |
+1.17% |
|
Decliners |
801 |
26% |
|
Decliners |
729 |
27% |
|
Russell 2000 |
+10.16 |
755.27 |
+1.36% |
|
52 Wk Highs |
75 |
|
|
52 Wk Highs |
50 |
|
|
S&P 600 |
+5.59 |
416.35 |
+1.36% |
|
52 Wk Lows |
15 |
|
|
52 Wk Lows |
51 |
|
|
 |
Indices Rise on Better But Still Below Average Volume Totals
Kenneth J. Gruneisen - Passed the CAN SLIM® Master's Exam
The major averages rose on Tuesday and the trading volume totals were still below average yet higher on the NYSE and on the Nasdaq exchange versus Monday's totals, a sign of increasing institutional accumulation. Advancers beat decliners by almost 3-1 on the NYSE and 5-2 on the Nasdaq exchange. New highs easily outnumbered new lows on the NYSE while the number of new 52-week lows matched new 52-week highs on the Nasdaq exchange There were 49 high-ranked companies from the CANSLIM.net Leaders List that made new 52-week highs and appeared on the CANSLIM.net BreakOuts Page, up from the prior session total of 29 stocks. There were gains for 16 of the 19 high-ranked companies currently included on the Featured Stocks Page.
Stocks advanced for a second straight session after Italian Prime Minister Silvio Berlusconi said he would resign. Berlusconi's announcement to step down reversed a mid-session sell-off prompted by passage of the budget without the Prime Minister obtaining an absolute majority.
Financials including JP Morgan Chase & Co (JPM +2.28%) and Citigroup Inc (C +2.85%) led the turnaround. Stocks tied to the economy rallied with 3M Co (MMM +2.69%) and Wal-Mart Stores Inc (WMT +2.38%) leading the Dow's advance. Housing stocks advanced on Toll Brothers Inc's (TOL +7.35%) better-than-expected results on a +6.0% increase in revenues. Positive profit tallies lifted priceline.com Inc (PCLN +8.61%) and Rockwell Automation (ROK +6.47%). An earnings miss by International Flavors & Fragrances Inc. (IFF -10.47%) sent its shares down.
Crude oil gained $1.46 to a three-month high of $96.98 a barrel.
Our monthly newsletter CANSLIM.net News will be published soon with an informative review of current market conditions, leading groups, and best buy candidates. Via the Premium Member Homepage links to all prior reports and webcasts are always available.
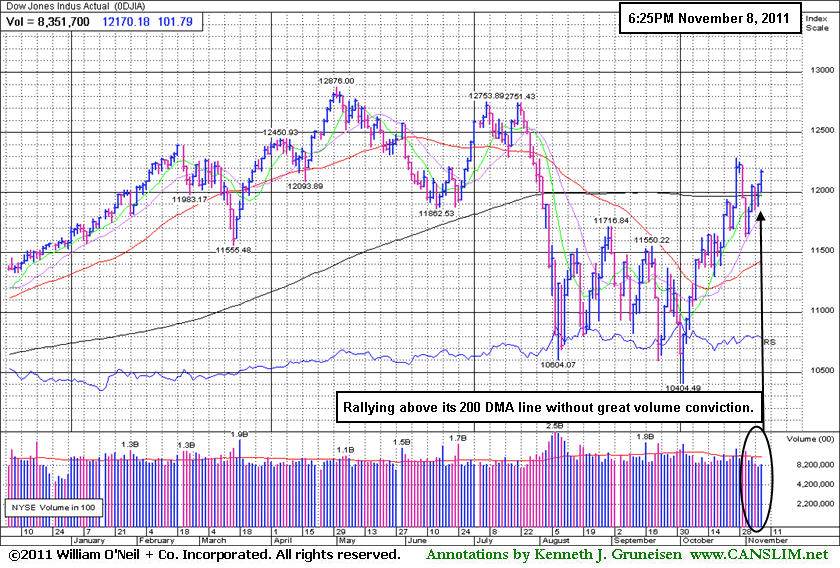
PICTURED: The Dow Jones Industrial Average has been rallying back above its 200-day moving average (DMA) line without great volume conviction. Tuesday's gains were backed by higher but still below average volume.
|
 Kenneth J. Gruneisen started out as a licensed stockbroker in August 1987, a couple of months prior to the historic stock market crash that took the Dow Jones Industrial Average down -22.6% in a single day. He has published daily fact-based fundamental and technical analysis on high-ranked stocks online for two decades. Through FACTBASEDINVESTING.COM, Kenneth provides educational articles, news, market commentary, and other information regarding proven investment systems that work in good times and bad.
Comments contained in the body of this report are technical opinions only and are not necessarily those of Gruneisen Growth Corp. The material herein has been obtained from sources believed to be reliable and accurate, however, its accuracy and completeness cannot be guaranteed. Our firm, employees, and customers may effect transactions, including transactions contrary to any recommendation herein, or have positions in the securities mentioned herein or options with respect thereto. Any recommendation contained in this report may not be suitable for all investors and it is not to be deemed an offer or solicitation on our part with respect to the purchase or sale of any securities. |
|
 |
Financial, Retail, Energy, and Tech Groups Posted Gains
Kenneth J. Gruneisen - Passed the CAN SLIM® Master's Exam
The Networking Index ($NWX +2.28%) outpaced the Internet Index ($IIX +1.31%), and the Biotechnology Index ($BTK +0.51%) and Semiconductor Index ($SOX +0.60%) followed with smaller gains. Influential gains from the Bank Index ($BKX +2.43%) and the Broker/Dealer Index ($XBD +0.91%) along with the Retail Index ($RLX +1.19%) helped underpin the major averages' gains. Energy-related shares also traded up as the Integrated Oil Index ($XOI +1.61%) and Oil Services Index ($OSX +2.17%) rallied, and the Healthcare Index ($HMO +0.98%) also posted a gain. Meanwhile, the Gold & Silver Index ($XAU -0.78%) backpedaled.
Charts courtesy www.stockcharts.com
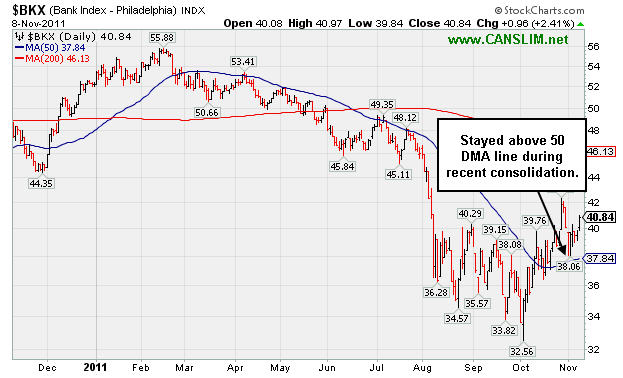
PICTURED: The Bank Index ($BKX +2.43%) stayed above its 50-day moving average (DMA) line during its recent consolidation. Continued progress above this "leading indicator" group's 50 DMA line bodes well for the broader market's outlook, meanwhile, any subsequent slump below its 50 DMA could prove to be an ominous sign for the broader market.
| Oil Services |
$OSX |
239.65 |
+5.08 |
+2.17% |
-2.23% |
| Healthcare |
$HMO |
2,253.28 |
+21.80 |
+0.98% |
+33.17% |
| Integrated Oil |
$XOI |
1,272.17 |
+20.10 |
+1.61% |
+4.86% |
| Semiconductor |
$SOX |
393.22 |
+2.35 |
+0.60% |
-4.52% |
| Networking |
$NWX |
244.27 |
+5.45 |
+2.28% |
-12.93% |
| Internet |
$IIX |
302.61 |
+3.91 |
+1.31% |
-1.66% |
| Broker/Dealer |
$XBD |
90.03 |
+0.81 |
+0.91% |
-25.91% |
| Retail |
$RLX |
549.66 |
+6.49 |
+1.19% |
+8.12% |
| Gold & Silver |
$XAU |
213.63 |
-1.67 |
-0.78% |
-5.72% |
| Bank |
$BKX |
40.85 |
+0.97 |
+2.43% |
-21.76% |
| Biotech |
$BTK |
1,102.06 |
+5.59 |
+0.51% |
-15.07% |
|
|
|
 |
Sales Revenues Increases Show Accelerating Growth
Kenneth J. Gruneisen - Passed the CAN SLIM® Master's Exam
Often, when a leading stock is setting up to breakout of a solid base it is highlighted in CANSLIM.net's Mid-Day Breakouts Report. The most relevant factors are noted in the report which allows prudent CANSLIM oriented investors to place the issue in their watch list. After doing any necessary backup research, the investor is prepared to act if and when the stock triggers a technical buy signal (breaks above its pivot point on more than +50% average turnover). In the event the stock fails to trigger a technical buy signal and its price declines then it will simply be removed from the watch list. In other cases, stocks may be featured in CANSLIM.net's Mid-Day Breakouts Report.after recent action already triggered technical buy signal. Disciplined investors know to buy as near as possible to the pivot point and avoid chasing stocks after they have rallied more than +5% above their pivot point. It is crucial to always limit losses whenever any stock heads the wrong direction, and disciplined investors sell if a struggling stock ever falls more than -7% from their purchase price.
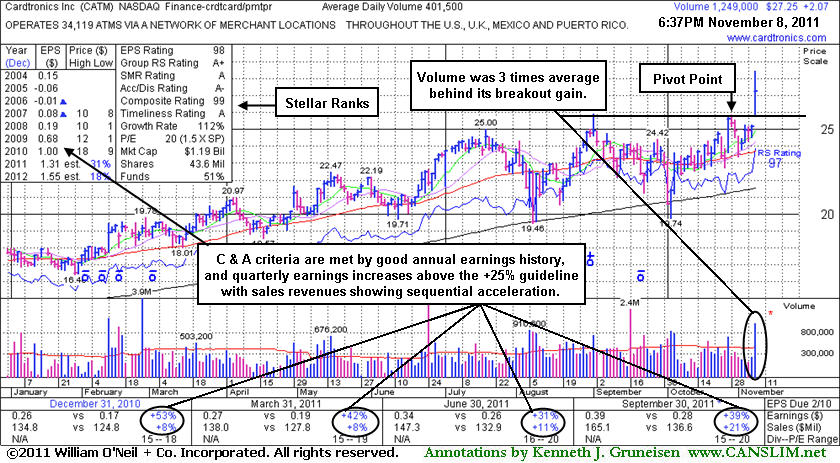
Cardtronics Inc (CATM +$2.07 or +8.22% to $27.25) was featured in yellow in the mid-day report (read here) after a gap up today. It finished the session with 3 times average volume while hitting new highs (N criteria) and breaking out of an orderly base pattern after reporting earnings +39% on +21% sales revenues for the quarter ended September 30, 2011 versus the year ago period. Strong earnings increases above the +25% guideline in quarterly comparisons and strong annual earnings satisfy the C and A criteria. Sales revenues increases in recent comparisons (Mar, Jun, Sep '11) show encouraging sequential acceleration from +8%, +11%, to +21% in the latest report.
Recently it found prompt support at its 200-day moving average (DMA) line. The number of top-rated funds owning its shares rose from 245 in Dec '10 to 342 in Sep '11, a reassuring sign concerning the I criteria. The Finance - Credit card/Payment Processing group has a 98 Group RS Rating and leadership in other stocks in the industry group satisfies the L criteria. Prior chart highs define important initial support to watch on pullbacks, and any slump back into its prior base would not bode well.
|
|
|
Color Codes Explained :
Y - Better candidates highlighted by our
staff of experts.
G - Previously featured
in past reports as yellow but may no longer be buyable under the
guidelines.
***Last / Change / Volume data in this table is the closing quote data***
Symbol/Exchange
Company Name
Industry Group |
PRICE |
CHANGE
(%Change) |
Day High |
Volume
(% DAV)
(% 50 day avg vol) |
52 Wk Hi
% From Hi |
Featured
Date |
Price
Featured |
Pivot Featured |
|
Max Buy |
AAPL
-
NASDAQ
Apple Inc
COMPUTER HARDWARE - Personal Computers
|
$406.23
|
+6.50
1.63% |
$407.12
|
14,176,008
70.04% of 50 DAV
50 DAV is 20,240,500
|
$426.70
-4.80%
|
9/16/2011
|
$399.14
|
PP = $404.60
|
|
MB = $424.83
|
Most Recent Note - 11/4/2011 6:25:07 PM
G - It has not formed a sound base pattern and ownership by top-rated funds has fallen some, as previously noted. Volume totals have recently been cooling while consolidating just above its 50 DMA line, and it is perched just -6.2% off its all-time high.
>>> The latest Featured Stock Update with an annotated graph appeared on 10/20/2011. Click here.
View all notes |
Alert me of new notes |
CANSLIM.net Company Profile |
SEC |
Zacks Reports |
StockTalk |
News |
Chart |
Request a new note
C
A N
S L
I M


|
ADS
-
NYSE
Alliance Data Sys Corp
COMPUTER SOFTWARE and SERVICES - Information and Delivery Service
|
$103.30
|
+0.73
0.71% |
$103.54
|
581,936
61.28% of 50 DAV
50 DAV is 949,600
|
$107.18
-3.62%
|
10/21/2011
|
$97.94
|
PP = $101.15
|
|
MB = $106.21
|
 Most Recent Note - 11/8/2011 7:22:27 PM
Y - Small gain today on light volume for its second best close ever. Prior chart highs in the $101 define initial support to watch well above its 50 DMA line.
>>> The latest Featured Stock Update with an annotated graph appeared on 10/21/2011. Click here.
View all notes |
Alert me of new notes |
CANSLIM.net Company Profile |
SEC |
Zacks Reports |
StockTalk |
News |
Chart |
Request a new note
C
A N
S L
I M
|
ALXN
-
NASDAQ
Alexion Pharmaceuticals
DRUGS - Drug Manufacturers - Other
|
$64.84
|
-0.80
-1.22% |
$66.18
|
1,330,445
88.08% of 50 DAV
50 DAV is 1,510,500
|
$70.42
-7.92%
|
9/15/2011
|
$63.20
|
PP = $60.81
|
|
MB = $63.85
|
Most Recent Note - 11/8/2011 7:25:42 PM
G - Slumped very near its 50 DMA line today with another loss on slightly higher volume hinting at mild distributional pressure. A violation of that important short-term average line could raise concerns and trigger a technical sell signal.
>>> The latest Featured Stock Update with an annotated graph appeared on 10/18/2011. Click here.
View all notes |
Alert me of new notes |
CANSLIM.net Company Profile |
SEC |
Zacks Reports |
StockTalk |
News |
Chart |
Request a new note
C
A N
S L
I M
|
CATM
-
NASDAQ
Cardtronics Inc
DIVERSIFIED SERVICES - Business/Management Services
|
$27.25
|
+2.07
8.22% |
$28.46
|
1,244,388
309.93% of 50 DAV
50 DAV is 401,500
|
$25.92
5.13%
|
11/8/2011
|
$25.99
|
PP = $25.95
|
|
MB = $27.25
|
Most Recent Note - 11/8/2011 7:00:47 PM
Y - There was 3 times average volume behind today's gap up gain for a new high. It broke out of an orderly base pattern after reporting earnings +39% on +21% sales revenues for the quarter ended September 30, 2011 versus the year ago period. Strong earnings increases above the +25% guideline in quarterly comparisons and strong annual earnings satisfy the C and A criteria. Sales revenues increases in recent comparisons (Mar, Jun, Sep '11) show encouraging sequential acceleration from +8%, +11%, to +21% in the latest report. See the latest FSU analysis for more details and an annotated graph.
>>> The latest Featured Stock Update with an annotated graph appeared on 11/8/2011. Click here.
View all notes |
Alert me of new notes |
CANSLIM.net Company Profile |
SEC |
Zacks Reports |
StockTalk |
News |
Chart |
Request a new note
C
A N
S L
I M
|
CELG
-
NASDAQ
Celgene Corp
DRUGS - Drug Manufacturers - Major
|
$65.18
|
+0.89
1.38% |
$65.32
|
2,661,570
69.34% of 50 DAV
50 DAV is 3,838,700
|
$68.25
-4.50%
|
9/16/2011
|
$61.21
|
PP = $62.59
|
|
MB = $65.72
|
Most Recent Note - 11/8/2011 7:03:14 PM
Y - Posted a gain today on light volume while consolidating just above its 50 DMA line which defines important near-term chart support to watch. A violation would raise concerns and trigger a technical sell signal.
>>> The latest Featured Stock Update with an annotated graph appeared on 11/7/2011. Click here.
View all notes |
Alert me of new notes |
CANSLIM.net Company Profile |
SEC |
Zacks Reports |
StockTalk |
News |
Chart |
Request a new note
C
A N
S L
I M
|
Symbol/Exchange
Company Name
Industry Group |
PRICE |
CHANGE
(%Change) |
Day High |
Volume
(% DAV)
(% 50 day avg vol) |
52 Wk Hi
% From Hi |
Featured
Date |
Price
Featured |
Pivot Featured |
|
Max Buy |
CEVA
-
NASDAQ
Ceva Inc
ELECTRONICS - Semiconductor - Specialized
|
$31.70
|
+0.05
0.16% |
$31.92
|
153,969
64.61% of 50 DAV
50 DAV is 238,300
|
$35.60
-10.96%
|
10/28/2011
|
$34.38
|
PP = $35.70
|
|
MB = $37.49
|
Most Recent Note - 11/8/2011 7:06:01 PM
Y - Still consolidating above prior highs since its gap up on 10/27/11 helped it break out of a "double bottom" base pattern. In the 10/28/11 mid-day report (read here) it was featured again in yellow with pivot point based on its 52-week high plus 10 cents while rallying from a larger cup shaped base. It has encountered distributional pressure since, while volume-driven gains above its pivot point are needed to trigger a new (or add-on) technical buy signal.
>>> The latest Featured Stock Update with an annotated graph appeared on 11/2/2011. Click here.
View all notes |
Alert me of new notes |
CANSLIM.net Company Profile |
SEC |
Zacks Reports |
StockTalk |
News |
Chart |
Request a new note
C
A N
S L
I M
|
FEIC
-
NASDAQ
F E I Co
ELECTRONICS - Diversified Electronics
|
$41.45
|
+0.69
1.69% |
$41.54
|
243,450
56.07% of 50 DAV
50 DAV is 434,200
|
$42.25
-1.89%
|
10/28/2011
|
$40.31
|
PP = $40.88
|
|
MB = $42.92
|
Most Recent Note - 11/8/2011 7:08:47 PM
Y - Holding its ground above its pivot point and under its "max buy" level with volume totals cooling. Consolidating near its 52-week high, today's gain on light volume led to its second best close ever.
>>> The latest Featured Stock Update with an annotated graph appeared on 10/28/2011. Click here.
View all notes |
Alert me of new notes |
CANSLIM.net Company Profile |
SEC |
Zacks Reports |
StockTalk |
News |
Chart |
Request a new note
C
A N
S L
I M
|
GNC
-
NYSE
G N C Holdings Inc
RETAIL - Drug Stores
|
$25.85
|
-0.66
-2.49% |
$26.85
|
673,259
53.00% of 50 DAV
50 DAV is 1,270,300
|
$27.13
-4.72%
|
10/26/2011
|
$24.60
|
PP = $24.80
|
|
MB = $26.04
|
Most Recent Note - 11/8/2011 7:10:36 PM
Y - Color code is changed to yellow after today's loss on light volume led to a finish just below its "max buy" level. Recent chart lows (near $23.80) define near term support to watch above its 50 DMA line.
>>> The latest Featured Stock Update with an annotated graph appeared on 10/26/2011. Click here.
View all notes |
Alert me of new notes |
CANSLIM.net Company Profile |
SEC |
Zacks Reports |
StockTalk |
News |
Chart |
Request a new note
C
A N
S L
I M
|
HMSY
-
NASDAQ
H M S Holdings Corp
COMPUTER SOFTWARE and SERVICES - Healthcare Information Service
|
$30.51
|
+1.78
6.20% |
$30.82
|
2,027,164
316.35% of 50 DAV
50 DAV is 640,800
|
$29.82
2.31%
|
10/27/2011
|
$26.44
|
PP = $28.37
|
|
MB = $29.79
|
Most Recent Note - 11/8/2011 1:09:09 PM
G - Gapped up today and rallied beyond its "max buy" level so its color code was changed to green. Quickly rallied above its pivot point to new 52-week high territory with more than 4 times average volume on 11/07/11 triggering a technical buy signal after announcing plans to acquire privately held HealthDataInsights, Inc. for $400 million.
>>> The latest Featured Stock Update with an annotated graph appeared on 11/4/2011. Click here.
View all notes |
Alert me of new notes |
CANSLIM.net Company Profile |
SEC |
Zacks Reports |
StockTalk |
News |
Chart |
Request a new note
C
A N
S L
I M
|
ISRG
-
NASDAQ
Intuitive Surgical Inc
HEALTH SERVICES - Medical Appliances and Equipment
|
$441.19
|
+8.82
2.04% |
$442.00
|
211,453
49.50% of 50 DAV
50 DAV is 427,200
|
$443.00
-0.41%
|
10/19/2011
|
$424.69
|
PP = $415.29
|
|
MB = $436.05
|
Most Recent Note - 11/8/2011 7:13:29 PM
G - Up today on light volume for its best ever close. Finished above its "max buy" level, and its color code is changed to green again. Prior highs define important support to watch on pullbacks.
>>> The latest Featured Stock Update with an annotated graph appeared on 10/19/2011. Click here.
View all notes |
Alert me of new notes |
CANSLIM.net Company Profile |
SEC |
Zacks Reports |
StockTalk |
News |
Chart |
Request a new note
C
A N
S L
I M
|
Symbol/Exchange
Company Name
Industry Group |
PRICE |
CHANGE
(%Change) |
Day High |
Volume
(% DAV)
(% 50 day avg vol) |
52 Wk Hi
% From Hi |
Featured
Date |
Price
Featured |
Pivot Featured |
|
Max Buy |
LABL
-
NASDAQ
Multi Color Corp
CONSUMER NON-DURABLES - Packaging and Containers
|
$26.04
|
-0.28
-1.06% |
$26.41
|
60,038
123.53% of 50 DAV
50 DAV is 48,600
|
$28.00
-7.00%
|
10/17/2011
|
$27.81
|
PP = $28.10
|
|
MB = $29.51
|
Most Recent Note - 11/8/2011 2:14:31 PM
Reported earnings +2% on +13% sales revenues for the quarter ended September 30, 2011 versus the year ago period. The results were below the fact-based investment system's guidelines and marked its weakest increases in the span of at least 5 quarterly comparisons. It is now slumping near recent lows and its 50 DMA line defining support to watch where any violation would raise more serious concerns. Based on fundamental weakness, and no technical buy signal triggered in recent history, it will be dropped from the Featured Stocks list tonight.
>>> The latest Featured Stock Update with an annotated graph appeared on 10/17/2011. Click here.
View all notes |
Alert me of new notes |
CANSLIM.net Company Profile |
SEC |
Zacks Reports |
StockTalk |
News |
Chart |
Request a new note
C
A N
S L
I M
|
MG
-
NYSE
Mistras Group Inc
DIVERSIFIED SERVICES - Bulding and Faci;ity Management Services
|
$22.81
|
+0.42
1.88% |
$23.13
|
122,477
58.38% of 50 DAV
50 DAV is 209,800
|
$23.51
-2.98%
|
10/28/2011
|
$22.49
|
PP = $23.61
|
|
MB = $24.79
|
Most Recent Note - 11/8/2011 7:15:31 PM
Y - Perched -3% off its all-time high, stubbornly holding its ground. A subsequent breakout on heavy volume may trigger a new (or add-on) buy signal. Prior highs in the $20-21 area define initial chart support to watch above its 50 DMA line.
>>> The latest Featured Stock Update with an annotated graph appeared on 10/12/2011. Click here.
View all notes |
Alert me of new notes |
CANSLIM.net Company Profile |
SEC |
Zacks Reports |
StockTalk |
News |
Chart |
Request a new note
C
A N
S L
I M
|
MKTX
-
NASDAQ
Marketaxess Holdings Inc
FINANCIAL SERVICES - Investment Brokerage - Nationa
|
$29.71
|
+0.95
3.30% |
$29.79
|
169,494
69.38% of 50 DAV
50 DAV is 244,300
|
$31.45
-5.53%
|
10/28/2011
|
$29.79
|
PP = $31.05
|
|
MB = $32.60
|
Most Recent Note - 11/8/2011 7:18:52 PM
Y - Wedging higher following its damaging 11/04/11 gap down. The minimum guideline requires at least +40% above average volume behind a gain above a stock's pivot point to trigger a proper new (or add-on) technical buy signal. Disciplined investors may use a tactic called pyramiding to accumulate shares without chasing the stock outside of the ideal buy range.
>>> The latest Featured Stock Update with an annotated graph appeared on 10/31/2011. Click here.
View all notes |
Alert me of new notes |
CANSLIM.net Company Profile |
SEC |
Zacks Reports |
StockTalk |
News |
Chart |
Request a new note
C
A N
S L
I M
|
OPNT
-
NASDAQ
Opnet Technologies
INTERNET - Internet Software and Services
|
$47.74
|
+1.09
2.34% |
$47.90
|
308,605
134.41% of 50 DAV
50 DAV is 229,600
|
$47.97
-0.48%
|
10/11/2011
|
$38.45
|
PP = $42.02
|
|
MB = $44.12
|
Most Recent Note - 11/8/2011 1:18:04 PM
G - Churning above average volume in the past week, gradually inching up further from its prior base. Previous highs in the $41 area define near-term chart support to watch on pullbacks. Due to report earnings on Wednesday, November 9th.
>>> The latest Featured Stock Update with an annotated graph appeared on 10/25/2011. Click here.
View all notes |
Alert me of new notes |
CANSLIM.net Company Profile |
SEC |
Zacks Reports |
StockTalk |
News |
Chart |
Request a new note
C
A N
S L
I M
|
OSIS
-
NASDAQ
O S I Systems Inc
ELECTRONICS - Semiconductor Equipment and Mate
|
$46.87
|
+0.10
0.21% |
$47.39
|
128,252
86.31% of 50 DAV
50 DAV is 148,600
|
$46.97
-0.21%
|
11/1/2011
|
$42.07
|
PP = $45.57
|
|
MB = $47.85
|
Most Recent Note - 11/7/2011 12:51:14 PM
Y - Quietly touched another new 52-week high (N criteria) today then reversed into the red. Volume was lighter than average behind last week's gains, not indicative of great institutional (I criteria) buying demand. Volume-driven gains above its pivot point may trigger a technical buy signal.
>>> The latest Featured Stock Update with an annotated graph appeared on 11/1/2011. Click here.
View all notes |
Alert me of new notes |
CANSLIM.net Company Profile |
SEC |
Zacks Reports |
StockTalk |
News |
Chart |
Request a new note
C
A N
S L
I M
|
Symbol/Exchange
Company Name
Industry Group |
PRICE |
CHANGE
(%Change) |
Day High |
Volume
(% DAV)
(% 50 day avg vol) |
52 Wk Hi
% From Hi |
Featured
Date |
Price
Featured |
Pivot Featured |
|
Max Buy |
RAX
-
NYSE
Rackspace Hosting Inc
INTERNET - Internet Software and; Services
|
$44.88
|
+3.13
7.50% |
$45.46
|
4,728,137
311.43% of 50 DAV
50 DAV is 1,518,200
|
$46.50
-3.47%
|
11/8/2011
|
$44.28
|
PP = $46.27
|
|
MB = $48.58
|
Most Recent Note - 11/8/2011 1:33:05 PM
Y - Gapped up today after reporting earnings +56% on +32% sales revenues for the quarter ended September 30, 2011 versus the year ago period. Color code is changed to yellow with new pivot point cited based on its 7/07/11 high plus 10 cents. Volume-driven gains into new high ground may trigger a new technical buy signal. After dropped from the Featured Stocks list on 6/16/11 it rebounded near its 52-week high then slumped well below its 200 DMA line during a much deeper consolidation before rebounding again. It is now working on the right side of a 19-week cup shaped base with little overhead supply remaining to act as resistance.
>>> The latest Featured Stock Update with an annotated graph appeared on 6/14/2011. Click here.
View all notes |
Alert me of new notes |
CANSLIM.net Company Profile |
SEC |
Zacks Reports |
StockTalk |
News |
Chart |
Request a new note
C
A N
S L
I M
|
SWI
-
NYSE
Solarwinds Inc
COMPUTER SOFTWARE and SERVICES - Application Software
|
$29.49
|
+0.17
0.58% |
$29.75
|
815,913
71.11% of 50 DAV
50 DAV is 1,147,400
|
$29.65
-0.54%
|
10/27/2011
|
$27.78
|
PP = $25.62
|
|
MB = $26.90
|
Most Recent Note - 11/4/2011 6:41:16 PM
G - Small gain on light volume today helped it rise to its best close ever. It is extended from its previous base pattern. Prior highs in the $25-26 area define initial chart support to watch on pullbacks.
>>> The latest Featured Stock Update with an annotated graph appeared on 10/27/2011. Click here.
View all notes |
Alert me of new notes |
CANSLIM.net Company Profile |
SEC |
Zacks Reports |
StockTalk |
News |
Chart |
Request a new note
C
A N
S L
I M
|
UA
-
NYSE
Under Armour Inc Cl A
CONSUMER NON-DURABLES - Textile - Apparel Clothing
|
$83.77
|
+0.27
0.32% |
$84.80
|
909,137
66.13% of 50 DAV
50 DAV is 1,374,700
|
$87.40
-4.15%
|
10/25/2011
|
$82.43
|
PP = $80.80
|
|
MB = $84.84
|
Most Recent Note - 11/8/2011 1:56:47 PM
Y - Small losses on light volume led to a pullback below its "max buy" level and its color code was changed to yellow again. No resistance remains due to overhead supply following its recent spurt of volume-driven gains. Prior highs near $80 define initial support above its 50 DMA line.
>>> The latest Featured Stock Update with an annotated graph appeared on 11/3/2011. Click here.
View all notes |
Alert me of new notes |
CANSLIM.net Company Profile |
SEC |
Zacks Reports |
StockTalk |
News |
Chart |
Request a new note
C
A N
S L
I M
|
V
-
NYSE
Visa Inc Cl A
DIVERSIFIED SERVICES - Business/Management Services
|
$94.54
|
+1.58
1.70% |
$94.66
|
4,886,095
92.45% of 50 DAV
50 DAV is 5,285,000
|
$95.87
-1.39%
|
10/24/2011
|
$94.21
|
PP = $94.85
|
|
MB = $99.59
|
Most Recent Note - 11/8/2011 7:28:35 PM
Y - Today's gain on near average volume led to its second best close ever. Still perched within close striking distance of its 52-week high, it did not trigger a proper new technical buy signal since recently highlighted in yellow as an ideal looking set-up. Its 50 DMA line defines near-term chart support to watch.
>>> The latest Featured Stock Update with an annotated graph appeared on 10/24/2011. Click here.
View all notes |
Alert me of new notes |
CANSLIM.net Company Profile |
SEC |
Zacks Reports |
StockTalk |
News |
Chart |
Request a new note
C
A N
S L
I M
|
|
|
|
THESE ARE NOT BUY RECOMMENDATIONS!
Comments contained in the body of this report are technical
opinions only. The material herein has been obtained
from sources believed to be reliable and accurate, however,
its accuracy and completeness cannot be guaranteed.
This site is not an investment advisor, hence it does
not endorse or recommend any securities or other investments.
Any recommendation contained in this report may not
be suitable for all investors and it is not to be deemed
an offer or solicitation on our part with respect to
the purchase or sale of any securities. All trademarks,
service marks and trade names appearing in this report
are the property of their respective owners, and are
likewise used for identification purposes only.
This report is a service available
only to active Paid Premium Members.
You may opt-out of receiving report notifications
at any time. Questions or comments may be submitted
by writing to Premium Membership Services 665 S.E. 10 Street, Suite 201 Deerfield Beach, FL 33441-5634 or by calling 1-800-965-8307
or 954-785-1121.
|
|
|

