You are not logged in.
This means you
CAN ONLY VIEW reports that were published prior to Monday, April 14, 2025.
You
MUST UPGRADE YOUR MEMBERSHIP if you want to see any current reports.
AFTER MARKET UPDATE - MONDAY, NOVEMBER 7TH, 2011
Previous After Market Report Next After Market Report >>>
|
|
|
|
DOW |
+85.15 |
12,068.39 |
+0.71% |
|
Volume |
782,743,810 |
-9% |
|
Volume |
1,676,747,660 |
-11% |
|
NASDAQ |
+9.10 |
2,695.25 |
+0.34% |
|
Advancers |
1,636 |
53% |
|
Advancers |
1,093 |
41% |
|
S&P 500 |
+7.89 |
1,261.12 |
+0.63% |
|
Decliners |
1,331 |
43% |
|
Decliners |
1,437 |
54% |
|
Russell 2000 |
-1.22 |
745.27 |
-0.16% |
|
52 Wk Highs |
55 |
|
|
52 Wk Highs |
33 |
|
|
S&P 600 |
-0.43 |
410.76 |
-0.10% |
|
52 Wk Lows |
16 |
|
|
52 Wk Lows |
48 |
|
|
 |
Major Averages Rebounded From Intra-day Losses for Quiet Gains
Kenneth J. Gruneisen - Passed the CAN SLIM® Master's Exam
The major averages showed some resilience after slumping into the red at mid-day Monday, and the Dow Jones Industrial Average recovered from being down as much as 102 points to close up 85 points. Trading volume totals were reported lighter on the NYSE and on the Nasdaq exchange versus Friday's totals. Advancers led decliners by a 16-13 margin on the NYSE while decliners led advancers by a 7-5 margin on the Nasdaq exchange. New 52-week lows still outnumbered new 52-week highs on the Nasdaq exchange, however new highs easily outnumbered new lows on the NYSE. There were 29 high-ranked companies from the CANSLIM.net Leaders List that made new 52-week highs and appeared on the CANSLIM.net BreakOuts Page, up from the prior session total of 20 stocks. here were gains for 10 of the 17 high-ranked companies currently included on the Featured Stocks Page.
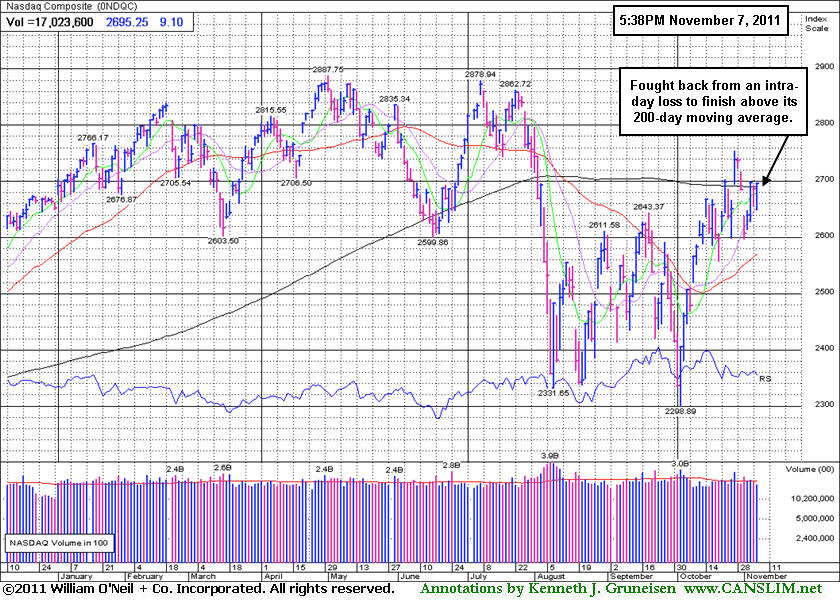
The major averages recovered from early losses to finish positive territory. Stocks rallied after being down most of Monday's session after European Central Bank's Juergen Stark said the region's debt crisis would be under control in two years. The market fell earlier amid reports Italian Prime Minister Silvio Berlusconi may be forced to step down if he failed to win a majority at tomorrow's budget vote in parliament. Italian borrowing costs have surged as the country struggles to deal with its debt burden.
Health care stocks helped lead Monday's comeback. Amgen Inc (AMGN +5.91%) rallied after announcing it would buy back as much as $5 billion shares. Dish Network Corp (DISH +5.03%) rose after the satellite TV provider said it will issue a special dividend of $2 a share.
Our monthly newsletter CANSLIM.net News will be published soon with an informative review of current market conditions, leading groups, and best buy candidates. Via the Premium Member Homepage links to all prior reports and webcasts are always available.
PICTURED: The Nasdaq Composite Index fought back from an intra-day loss to finish above its 200-day moving average (DMA) line.
|
 Kenneth J. Gruneisen started out as a licensed stockbroker in August 1987, a couple of months prior to the historic stock market crash that took the Dow Jones Industrial Average down -22.6% in a single day. He has published daily fact-based fundamental and technical analysis on high-ranked stocks online for two decades. Through FACTBASEDINVESTING.COM, Kenneth provides educational articles, news, market commentary, and other information regarding proven investment systems that work in good times and bad.
Comments contained in the body of this report are technical opinions only and are not necessarily those of Gruneisen Growth Corp. The material herein has been obtained from sources believed to be reliable and accurate, however, its accuracy and completeness cannot be guaranteed. Our firm, employees, and customers may effect transactions, including transactions contrary to any recommendation herein, or have positions in the securities mentioned herein or options with respect thereto. Any recommendation contained in this report may not be suitable for all investors and it is not to be deemed an offer or solicitation on our part with respect to the purchase or sale of any securities. |
|
 |
Gold Led Group Gainers; Tech Sector Had Negative Bias
Kenneth J. Gruneisen - Passed the CAN SLIM® Master's Exam
The Gold & Silver Index ($XAU +3.03%) was a standout gainer on Monday. The Retail Index ($RLX +0.79%) and financial shares had a positive bias as the Broker/Dealer Index ($XBD +0.45%) and Bank Index ($BKX +0.96%) helped underpin the major averages' gains. Energy-related shares rose as the Oil Services Index ($OSX +0.53%) and Integrated Oil Index ($XOI +0.79%) ratcheted higher. Networking Index ($NWX -0.97%) and Biotechnology Index ($BTK -0.82%) led declines in the mostly negative tech sector while the Semiconductor Index ($SOX -0.16%) and Internet Index ($IIX -0.02%) also inched lower. The Healthcare Index ($HMO +0.33%) finished with a modest gain.
Charts courtesy www.stockcharts.com
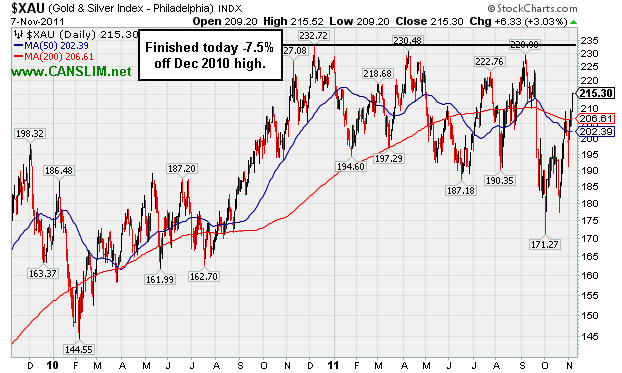
PICTURED: The Gold & Silver Index ($XAU +3.03%) finished -7.5% off its high hit in December 2010. It has quickly rallied +25.7% from its early-October low.
| Oil Services |
$OSX |
234.57 |
+1.23 |
+0.53% |
-4.30% |
| Healthcare |
$HMO |
2,231.48 |
+7.30 |
+0.33% |
+31.88% |
| Integrated Oil |
$XOI |
1,252.06 |
+9.77 |
+0.79% |
+3.21% |
| Semiconductor |
$SOX |
390.87 |
-0.61 |
-0.16% |
-5.09% |
| Networking |
$NWX |
238.83 |
-2.33 |
-0.97% |
-14.87% |
| Internet |
$IIX |
298.70 |
-0.07 |
-0.02% |
-2.94% |
| Broker/Dealer |
$XBD |
89.22 |
+0.40 |
+0.45% |
-26.57% |
| Retail |
$RLX |
543.17 |
+4.24 |
+0.79% |
+6.84% |
| Gold & Silver |
$XAU |
215.30 |
+6.33 |
+3.03% |
-4.98% |
| Bank |
$BKX |
39.88 |
+0.38 |
+0.96% |
-23.62% |
| Biotech |
$BTK |
1,096.47 |
-9.03 |
-0.82% |
-15.50% |
|
|
|
 |
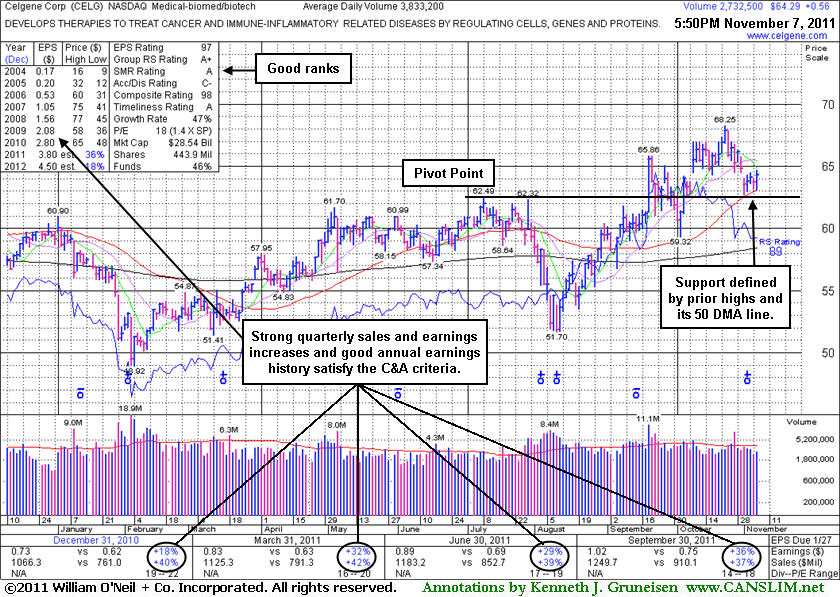
Consolidation May Be Considered a Secondary Buy Point
Kenneth J. Gruneisen - Passed the CAN SLIM® Master's Exam
Celgene Corp (CELG +$0.56 or +0.88% to $64.29) is quietly consolidating below its "max buy" level and just above its 50-day moving average (DMA) line and prior chart highs which define important near-term chart support to watch. Any subsequent violations would raise concerns and trigger technical sell signals. Following its last appearance in this FSU section on 10/14/11 with an annotated graph under the headline, "Leader is Slightly Extended Following Latest Gap Up - Friday, October 14, 2011 ", it wedged up to another new high without great volume conviction then encountered some distributional pressure.
New buying efforts may be justified under the fact-based system's guidelines while now consolidating near its 50 DMA line, on up to as much as +5% above the latest peak. However, historic studies have shown that investors' odds are most favorable when buying fresh breakouts while the stock is rising above its pivot point, rather than buying when a stock is pulling back into the ideal buying range. As always, disciplined investors limit losses if any stock ever falls more that -7% from their buy point.
A hearty bull market produces many high-ranked leaders that break out from sound bases, and there are many valid opportunities where disciplined buying efforts are justified within the guidelines of the fact-based system. Early leaders in a new leg up like this one can be kept on a watchlist of worthy buy candidates if they appear to be getting away, and they may possibly be noted again when new bases or secondary buy points present themselves.
|
|
|
Color Codes Explained :
Y - Better candidates highlighted by our
staff of experts.
G - Previously featured
in past reports as yellow but may no longer be buyable under the
guidelines.
***Last / Change / Volume data in this table is the closing quote data***
Symbol/Exchange
Company Name
Industry Group |
PRICE |
CHANGE
(%Change) |
Day High |
Volume
(% DAV)
(% 50 day avg vol) |
52 Wk Hi
% From Hi |
Featured
Date |
Price
Featured |
Pivot Featured |
|
Max Buy |
AAPL
-
NASDAQ
Apple Inc
COMPUTER HARDWARE - Personal Computers
|
$399.73
|
-0.51
-0.13% |
$400.00
|
9,639,089
47.01% of 50 DAV
50 DAV is 20,505,700
|
$426.70
-6.32%
|
9/16/2011
|
$399.14
|
PP = $404.60
|
|
MB = $424.83
|
Most Recent Note - 11/4/2011 6:25:07 PM
G - It has not formed a sound base pattern and ownership by top-rated funds has fallen some, as previously noted. Volume totals have recently been cooling while consolidating just above its 50 DMA line, and it is perched just -6.2% off its all-time high.
>>> The latest Featured Stock Update with an annotated graph appeared on 10/20/2011. Click here.
View all notes |
Alert me of new notes |
CANSLIM.net Company Profile |
SEC |
Zacks Reports |
StockTalk |
News |
Chart |
Request a new note
C
A N
S L
I M


|
ADS
-
NYSE
Alliance Data Sys Corp
COMPUTER SOFTWARE and SERVICES - Information and Delivery Service
|
$102.57
|
+0.00
0.00% |
$103.35
|
468,331
49.07% of 50 DAV
50 DAV is 954,500
|
$107.18
-4.30%
|
10/21/2011
|
$97.94
|
PP = $101.15
|
|
MB = $106.21
|
Most Recent Note - 11/3/2011 2:37:50 PM
Y - Hit a new high today and briefly traded above its "max buy" level after gapping up. Reported earnings +39% on +20% sales revenues for the quarter ended September 30, 2011 versus the year ago period. Prior chart highs in the $101 define initial support to watch well above its 50 DMA line.
>>> The latest Featured Stock Update with an annotated graph appeared on 10/21/2011. Click here.
View all notes |
Alert me of new notes |
CANSLIM.net Company Profile |
SEC |
Zacks Reports |
StockTalk |
News |
Chart |
Request a new note
C
A N
S L
I M
|
ALXN
-
NASDAQ
Alexion Pharmaceuticals
DRUGS - Drug Manufacturers - Other
|
$65.64
|
-0.40
-0.61% |
$66.60
|
823,268
54.29% of 50 DAV
50 DAV is 1,516,300
|
$70.42
-6.79%
|
9/15/2011
|
$63.20
|
PP = $60.81
|
|
MB = $63.85
|
Most Recent Note - 11/4/2011 6:27:08 PM
G - Small gain today, quietly consolidating above its 50 DMA line previously noted as chart support to watch on pullbacks. A violation of that important short-term average line would raise concerns and trigger a technical sell signal.
>>> The latest Featured Stock Update with an annotated graph appeared on 10/18/2011. Click here.
View all notes |
Alert me of new notes |
CANSLIM.net Company Profile |
SEC |
Zacks Reports |
StockTalk |
News |
Chart |
Request a new note
C
A N
S L
I M
|
CELG
-
NASDAQ
Celgene Corp
DRUGS - Drug Manufacturers - Major
|
$64.29
|
+0.56
0.88% |
$64.68
|
2,732,547
71.29% of 50 DAV
50 DAV is 3,833,200
|
$68.25
-5.80%
|
9/16/2011
|
$61.21
|
PP = $62.59
|
|
MB = $65.72
|
Most Recent Note - 11/4/2011 6:28:08 PM
Y - Quietly consolidating just above its 50 DMA line which defines important near-term chart support to watch, and a violation would raise concerns and trigger a technical sell signal.
>>> The latest Featured Stock Update with an annotated graph appeared on 11/7/2011. Click here.
View all notes |
Alert me of new notes |
CANSLIM.net Company Profile |
SEC |
Zacks Reports |
StockTalk |
News |
Chart |
Request a new note
C
A N
S L
I M
|
CEVA
-
NASDAQ
Ceva Inc
ELECTRONICS - Semiconductor - Specialized
|
$31.65
|
-0.13
-0.41% |
$32.00
|
154,632
64.94% of 50 DAV
50 DAV is 238,100
|
$35.60
-11.10%
|
10/28/2011
|
$34.38
|
PP = $35.70
|
|
MB = $37.49
|
Most Recent Note - 11/3/2011 2:09:26 PM
Y - Consolidating above prior highs since its gap up on 10/27/11 helped it break out of a "double bottom" base pattern after reporting earnings +86% on +39% sales revenues for the quarter ended September 30, 2011 versus the year ago period. It had slumped below its 200 DMA line during its consolidation since dropped from the Featured Stocks list on 6/17/11. In the 10/28/11 mid-day report (read here) it was featured again in yellow with pivot point based on its 52-week high plus 10 cents while rallying "straight up from the bottom" of a 22-week cup shaped base. It has encountered distributional pressure since, while volume-driven gains above its pivot point are needed to trigger a new (or add-on) technical buy signal. See the latest FSU analysis for more details and a new annotated graph.
>>> The latest Featured Stock Update with an annotated graph appeared on 11/2/2011. Click here.
View all notes |
Alert me of new notes |
CANSLIM.net Company Profile |
SEC |
Zacks Reports |
StockTalk |
News |
Chart |
Request a new note
C
A N
S L
I M
|
Symbol/Exchange
Company Name
Industry Group |
PRICE |
CHANGE
(%Change) |
Day High |
Volume
(% DAV)
(% 50 day avg vol) |
52 Wk Hi
% From Hi |
Featured
Date |
Price
Featured |
Pivot Featured |
|
Max Buy |
FEIC
-
NASDAQ
F E I Co
ELECTRONICS - Diversified Electronics
|
$40.76
|
+0.51
1.27% |
$40.98
|
308,388
71.07% of 50 DAV
50 DAV is 433,900
|
$42.25
-3.53%
|
10/28/2011
|
$40.31
|
PP = $40.88
|
|
MB = $42.92
|
Most Recent Note - 11/3/2011 2:23:40 PM
Y - Consolidating near its 52-week high since its considerable gain on 10/28/11 triggered a technical buy signal. Disciplined investors limit losses and always sell if a stock falls -7% from their purchase price. If strength returns a stock can always be bought back.
>>> The latest Featured Stock Update with an annotated graph appeared on 10/28/2011. Click here.
View all notes |
Alert me of new notes |
CANSLIM.net Company Profile |
SEC |
Zacks Reports |
StockTalk |
News |
Chart |
Request a new note
C
A N
S L
I M
|
GNC
-
NYSE
G N C Holdings Inc
RETAIL - Drug Stores
|
$26.51
|
+0.14
0.53% |
$26.75
|
447,395
35.24% of 50 DAV
50 DAV is 1,269,500
|
$27.13
-2.29%
|
10/26/2011
|
$24.60
|
PP = $24.80
|
|
MB = $26.04
|
Most Recent Note - 11/4/2011 6:29:37 PM
G - Hovering near its 52-week high, slightly extended from its prior base. Recent chart lows (near $23.80) define near term support to watch above its 50 DMA line.
>>> The latest Featured Stock Update with an annotated graph appeared on 10/26/2011. Click here.
View all notes |
Alert me of new notes |
CANSLIM.net Company Profile |
SEC |
Zacks Reports |
StockTalk |
News |
Chart |
Request a new note
C
A N
S L
I M
|
HMSY
-
NASDAQ
H M S Holdings Corp
COMPUTER SOFTWARE and SERVICES - Healthcare Information Service
|
$28.73
|
+3.60
14.33% |
$29.82
|
2,816,210
473.63% of 50 DAV
50 DAV is 594,600
|
$28.25
1.72%
|
10/27/2011
|
$26.44
|
PP = $28.37
|
|
MB = $29.79
|
 Most Recent Note - 11/7/2011 12:39:06 PM
Y - Gapped up today, rising above its 50 and 200 DMA lines and its color code was changed to yellow based on the technical strength Quickly rallied above its pivot point to new 52-week high territory after announcing plans to acquire privately held HealthDataInsights, Inc. for $400 million. See the latest FSU analysis for more details and a new annotated graph.
>>> The latest Featured Stock Update with an annotated graph appeared on 11/4/2011. Click here.
View all notes |
Alert me of new notes |
CANSLIM.net Company Profile |
SEC |
Zacks Reports |
StockTalk |
News |
Chart |
Request a new note
C
A N
S L
I M
|
ISRG
-
NASDAQ
Intuitive Surgical Inc
HEALTH SERVICES - Medical Appliances and Equipment
|
$432.37
|
+0.14
0.03% |
$434.99
|
270,192
62.49% of 50 DAV
50 DAV is 432,400
|
$443.00
-2.40%
|
10/19/2011
|
$424.69
|
PP = $415.29
|
|
MB = $436.05
|
Most Recent Note - 11/4/2011 6:32:32 PM
Y - Small loss today on light volume, edging below its "max buy" level, and its color code is changed to yellow again. Prior highs define important support to watch on pullbacks.
>>> The latest Featured Stock Update with an annotated graph appeared on 10/19/2011. Click here.
View all notes |
Alert me of new notes |
CANSLIM.net Company Profile |
SEC |
Zacks Reports |
StockTalk |
News |
Chart |
Request a new note
C
A N
S L
I M
|
LABL
-
NASDAQ
Multi Color Corp
CONSUMER NON-DURABLES - Packaging and Containers
|
$26.32
|
-0.70
-2.59% |
$27.11
|
48,733
99.25% of 50 DAV
50 DAV is 49,100
|
$28.00
-6.00%
|
10/17/2011
|
$27.81
|
PP = $28.10
|
|
MB = $29.51
|
Most Recent Note - 11/7/2011 10:59:57 AM
Y - Slumping near its 50 DMA line today with quiet volume, now -8.8% off its 52-week high. Subsequent volume-driven gains into new high ground may trigger a technical buy signal. Recent lows near its 50 DMA line define near-term support to watch where any violation would raise concerns. Due to report earnings on Tuesday, November 8th before the opening bell.
>>> The latest Featured Stock Update with an annotated graph appeared on 10/17/2011. Click here.
View all notes |
Alert me of new notes |
CANSLIM.net Company Profile |
SEC |
Zacks Reports |
StockTalk |
News |
Chart |
Request a new note
C
A N
S L
I M
|
Symbol/Exchange
Company Name
Industry Group |
PRICE |
CHANGE
(%Change) |
Day High |
Volume
(% DAV)
(% 50 day avg vol) |
52 Wk Hi
% From Hi |
Featured
Date |
Price
Featured |
Pivot Featured |
|
Max Buy |
MG
-
NYSE
Mistras Group Inc
DIVERSIFIED SERVICES - Bulding and Faci;ity Management Services
|
$22.39
|
+0.25
1.13% |
$22.59
|
62,854
29.83% of 50 DAV
50 DAV is 210,700
|
$23.51
-4.76%
|
10/28/2011
|
$22.49
|
PP = $23.61
|
|
MB = $24.79
|
Most Recent Note - 11/4/2011 6:34:29 PM
Y - Gapped down today, quietly finishing the week -5.8% off its all-time high. A subsequent breakout on heavy volume may trigger a new (or add-on) buy signal. Prior highs in the $20-21 area define initial chart support to watch above its 50 DMA line.
>>> The latest Featured Stock Update with an annotated graph appeared on 10/12/2011. Click here.
View all notes |
Alert me of new notes |
CANSLIM.net Company Profile |
SEC |
Zacks Reports |
StockTalk |
News |
Chart |
Request a new note
C
A N
S L
I M
|
MKTX
-
NASDAQ
Marketaxess Holdings Inc
FINANCIAL SERVICES - Investment Brokerage - Nationa
|
$28.85
|
+0.45
1.58% |
$28.94
|
143,836
58.85% of 50 DAV
50 DAV is 244,400
|
$31.45
-8.27%
|
10/28/2011
|
$29.79
|
PP = $31.05
|
|
MB = $32.60
|
Most Recent Note - 11/4/2011 9:50:10 AM
Y - Gapped down today for a considerable loss. On the prior session it touched a new 52-week high and traded above its pivot point, then closed below the mark while volume backing its gain was just +21% above average. The minimum guideline requires at least +40% above average volume behind a gain above a stock's pivot point to trigger a proper new (or add-on) technical buy signal. Disciplined investors may use a tactic called pyramiding to accumulate shares without chasing the stock outside of the ideal buy range.
>>> The latest Featured Stock Update with an annotated graph appeared on 10/31/2011. Click here.
View all notes |
Alert me of new notes |
CANSLIM.net Company Profile |
SEC |
Zacks Reports |
StockTalk |
News |
Chart |
Request a new note
C
A N
S L
I M
|
OPNT
-
NASDAQ
Opnet Technologies
INTERNET - Internet Software and Services
|
$46.65
|
-0.06
-0.13% |
$47.97
|
340,485
151.26% of 50 DAV
50 DAV is 225,100
|
$46.90
-0.53%
|
10/11/2011
|
$38.45
|
PP = $42.02
|
|
MB = $44.12
|
Most Recent Note - 11/7/2011 12:47:35 PM
G - Hit a new high today then reversed into the red following 3 consecutive gains with above average volume that lifted it further from its prior base. Previous highs in the $41 area define near-term chart support to watch on pullbacks. Due to report earnings on Wednesday, November 9th.
>>> The latest Featured Stock Update with an annotated graph appeared on 10/25/2011. Click here.
View all notes |
Alert me of new notes |
CANSLIM.net Company Profile |
SEC |
Zacks Reports |
StockTalk |
News |
Chart |
Request a new note
C
A N
S L
I M
|
OSIS
-
NASDAQ
O S I Systems Inc
ELECTRONICS - Semiconductor Equipment and Mate
|
$46.77
|
+1.19
2.61% |
$46.97
|
169,485
114.36% of 50 DAV
50 DAV is 148,200
|
$45.68
2.39%
|
11/1/2011
|
$42.07
|
PP = $45.57
|
|
MB = $47.85
|
Most Recent Note - 11/7/2011 12:51:14 PM
Y - Quietly touched another new 52-week high (N criteria) today then reversed into the red. Volume was lighter than average behind last week's gains, not indicative of great institutional (I criteria) buying demand. Volume-driven gains above its pivot point may trigger a technical buy signal.
>>> The latest Featured Stock Update with an annotated graph appeared on 11/1/2011. Click here.
View all notes |
Alert me of new notes |
CANSLIM.net Company Profile |
SEC |
Zacks Reports |
StockTalk |
News |
Chart |
Request a new note
C
A N
S L
I M
|
SWI
-
NYSE
Solarwinds Inc
COMPUTER SOFTWARE and SERVICES - Application Software
|
$29.32
|
+0.44
1.52% |
$29.65
|
886,067
77.66% of 50 DAV
50 DAV is 1,140,900
|
$29.50
-0.61%
|
10/27/2011
|
$27.78
|
PP = $25.62
|
|
MB = $26.90
|
Most Recent Note - 11/4/2011 6:41:16 PM
G - Small gain on light volume today helped it rise to its best close ever. It is extended from its previous base pattern. Prior highs in the $25-26 area define initial chart support to watch on pullbacks.
>>> The latest Featured Stock Update with an annotated graph appeared on 10/27/2011. Click here.
View all notes |
Alert me of new notes |
CANSLIM.net Company Profile |
SEC |
Zacks Reports |
StockTalk |
News |
Chart |
Request a new note
C
A N
S L
I M
|
Symbol/Exchange
Company Name
Industry Group |
PRICE |
CHANGE
(%Change) |
Day High |
Volume
(% DAV)
(% 50 day avg vol) |
52 Wk Hi
% From Hi |
Featured
Date |
Price
Featured |
Pivot Featured |
|
Max Buy |
UA
-
NYSE
Under Armour Inc Cl A
CONSUMER NON-DURABLES - Textile - Apparel Clothing
|
$83.50
|
-0.80
-0.95% |
$85.60
|
634,048
44.94% of 50 DAV
50 DAV is 1,410,900
|
$87.40
-4.46%
|
10/25/2011
|
$82.43
|
PP = $80.80
|
|
MB = $84.84
|
Most Recent Note - 11/4/2011 6:42:54 PM
Y - Small loss on light volume led to a close below its "max buy" level and its color code is changed to yellow again. No resistance remains due to overhead supply following its recent spurt of volume-driven gains. Prior highs near $80 define initial support above its 50 DMA line.
>>> The latest Featured Stock Update with an annotated graph appeared on 11/3/2011. Click here.
View all notes |
Alert me of new notes |
CANSLIM.net Company Profile |
SEC |
Zacks Reports |
StockTalk |
News |
Chart |
Request a new note
C
A N
S L
I M
|
V
-
NYSE
Visa Inc Cl A
DIVERSIFIED SERVICES - Business/Management Services
|
$92.96
|
+0.32
0.35% |
$93.33
|
2,411,766
45.13% of 50 DAV
50 DAV is 5,344,300
|
$95.87
-3.04%
|
10/24/2011
|
$94.21
|
PP = $94.85
|
|
MB = $99.59
|
Most Recent Note - 11/4/2011 6:44:31 PM
Y - Quietly hovering within close striking distance of its 52-week high. It did not trigger a proper new technical buy signal since recently highlighted in yellow as an ideal looking set-up. Its 50 DMA line defines near-term chart support to watch.
>>> The latest Featured Stock Update with an annotated graph appeared on 10/24/2011. Click here.
View all notes |
Alert me of new notes |
CANSLIM.net Company Profile |
SEC |
Zacks Reports |
StockTalk |
News |
Chart |
Request a new note
C
A N
S L
I M
|
|
|
|
THESE ARE NOT BUY RECOMMENDATIONS!
Comments contained in the body of this report are technical
opinions only. The material herein has been obtained
from sources believed to be reliable and accurate, however,
its accuracy and completeness cannot be guaranteed.
This site is not an investment advisor, hence it does
not endorse or recommend any securities or other investments.
Any recommendation contained in this report may not
be suitable for all investors and it is not to be deemed
an offer or solicitation on our part with respect to
the purchase or sale of any securities. All trademarks,
service marks and trade names appearing in this report
are the property of their respective owners, and are
likewise used for identification purposes only.
This report is a service available
only to active Paid Premium Members.
You may opt-out of receiving report notifications
at any time. Questions or comments may be submitted
by writing to Premium Membership Services 665 S.E. 10 Street, Suite 201 Deerfield Beach, FL 33441-5634 or by calling 1-800-965-8307
or 954-785-1121.
|
|
|

