Help Lines 954-785-1121


You are not logged in. Upgrade Here
 <<<Previous Mid Day Report     Next Mid Day Report >>> 
 <<<Previous After Market Report Next After Market Report >>> 
You are not logged in.
This means you CAN ONLY VIEW reports that were published prior to Monday, February 26, 2024.
You MUST UPGRADE YOUR MEMBERSHIP if you want to see any current reports.

AFTER MARKET UPDATE - WEDNESDAY, NOVEMBER 6TH, 2019
Previous After Market Report Next After Market Report >>>
Indices NYSE Nasdaq
DOW  -0.07 27,492.56 -0.00% Volume 988,137,170 -0% Volume 2,308,984,620 +2%
NASDAQ -24.05 8,410.63 -0.29% Advancers 1,298 45% Advancers 1,130 37%
S&P 500 +2.16 3,076.78 +0.07% Decliners 1,566 55% Decliners 1,963 63%
Russell 2000 -10.07 1,589.54 -0.63% 52 Wk Highs 106   52 Wk Highs 92  
S&P 600 -5.64 984.54 -0.57% 52 Wk Lows 33   52 Wk Lows 76  

Leadership Thinned as Major Indices Remained Near Records

The Dow ticked down less than a point, while the S&P 500 gained less than 0.1%. The Nasdaq Composite lost 0.3%. Decliners led advancers by an 8-7 margin on the NYSE and by nearly 2-1 on the Nasdaq exchange. There were 38 high-ranked companies from the Leaders List that hit a new 52-week high and were listed on the BreakOuts Page, versus the total of 98 on the prior session. New 52-week highs totals outnumbered new 52-week lows totals on the NYSE and on the Nasdaq exchange. The major indices (M criteria) are in a "confirmed uptrend" after enduring distributional pressure in recent weeks. The Featured Stocks Page provides the most timely analysis on high-ranked leaders.
Charts used courtesy of www.stockcharts.com

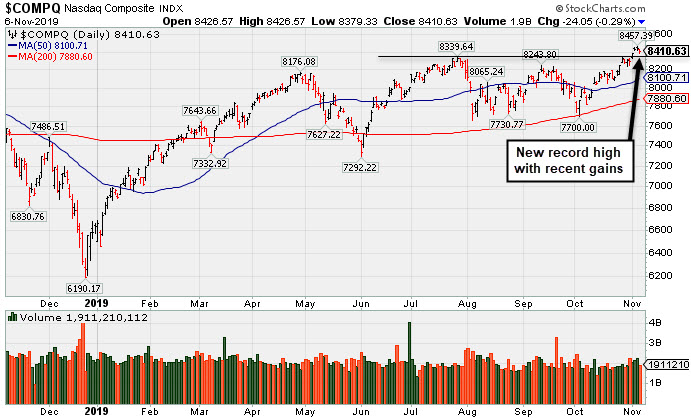
PICTURED: The Nasdaq Composite Index is perched near its new record high. 

U.S. equities finished mixed Wednesday, as investors digested corporate earnings releases and developments on the trade front. Optimism faded around “phase one” of a U.S.-China trade deal after reports indicated the agreement is not likely to be signed until December as the two sides finalize terms and meeting location. 

Seven of 11 S&P 500 sectors ended the day in positive territory. The Health Care and Consumer Staples sectors paced gains, while Energy shares declined more than 2.0% in sympathy with a retreat in oil prices. In earnings, CVS Health (CVS +5.36%) rose following its top and bottom line beat that was fueled by solid results in its pharmacy benefit management division. Humana (HUM +3.46%) rose after the insurer’s profit and revenue figures topped analyst estimates. Coty (COTY +13.61%) rose after the cosmetics maker bested analyst profit projections. In M&A news, HP Inc. (HPQ +6.36%) jumped on news the personal computer maker may be acquired by Xerox (XRX +3.55%).

In commodities, WTI crude declined 1.2% to $56.55/barrel after gaining in the prior three trading sessions after data showed a build in U.S. inventories. COMEX gold advanced 0.6% to $1,492.00/ounce.

On the data front, MBA mortgage applications slipped 0.1% last week, after increasing 0.6% in the prior period. A separate update showed productivity in the U.S. unexpectedly fell in the third quarter, marking the first decline in four years. Treasuries strengthened, with the yield on the 10-year falling three basis points to 1.82%.

Kenneth J. Gruneisen started out as a licensed stockbroker in August 1987, a couple of months prior to the historic stock market crash that took the Dow Jones Industrial Average down -22.6% in a single day. He has published daily fact-based fundamental and technical analysis on high-ranked stocks online for two decades. Through FACTBASEDINVESTING.COM, Kenneth provides educational articles, news, market commentary, and other information regarding proven investment systems that work in good times and bad.

Comments contained in the body of this report are technical opinions only and are not necessarily those of Gruneisen Growth Corp. The material herein has been obtained from sources believed to be reliable and accurate, however, its accuracy and completeness cannot be guaranteed. Our firm, employees, and customers may effect transactions, including transactions contrary to any recommendation herein, or have positions in the securities mentioned herein or options with respect thereto. Any recommendation contained in this report may not be suitable for all investors and it is not to be deemed an offer or solicitation on our part with respect to the purchase or sale of any securities.


Gold & Silver Index and Networking Index Posted Gains

The Bank Index ($BKX -0.08%), Broker/Dealer Index ($XBD -0.13%), and the Retail Index ($RLX -0.05%) each ended the session slightly in the red. The tech sector was mixed as the Networking Index ($NWX +0.35%) eked out a small gain, meanwhile the Semiconductor Index ($SOX -0.84%) and the Biotech Index ($BTK -0.86%) both ended lower. The Oil Services Index ($OSX -2.85%) and the Integrated Oil Index ($XOI -2.72%) had a solidly negative bias, meanwhile, the Gold & Silver Index ($XAU +0.81%) was a standout gainer.
Charts courtesy of www.stockcharts.com

PICTURED: The Broker/Dealer Index ($XBD -0.13%) has recently been rebounding near its 2019 high.

Industry Index Symbol Close Change % Change YTD % Change
Oil Services $OSX  69.44 -2.04 -2.85% -13.85%
Integrated Oil $XOI  1,243.29 -34.72 -2.72% +7.26%
Semiconductor $SOX  1,715.67 -14.48 -0.84% +48.52%
Networking $NWX  552.43 +1.91 +0.35% +13.05%
Broker/Dealer $XBD  272.95 -0.36 -0.13% +15.00%
Retail $RLX  2,420.72 -1.12 -0.05% +24.05%
Gold & Silver $XAU  94.09 +0.75 +0.80% +33.16%
Bank $BKX  108.67 -0.09 -0.08% +26.67%
Biotech $BTK  4,464.96 -38.79 -0.86% +5.78%


Testing Support at 50-Day Moving Average

Copart Inc (CPRT $81.86 -$0.39 -0.47%) is consolidating near its 50-day moving average (DMA) line ($81.07) which defines near-term support and its color code was changed to yellow while sputtering below its "max buy" level again. 

CPRT wedged to new all-time highs with gains lacking great volume conviction after last shown in this FSU session on 10/22/19 with an annotated graph under the headline, "Reversed Into Red Today After Hitting New All-Time High". A volume-driven gain above the pivot point on 9/05/19 clinched a technical buy signal when CPRT was highlighted in yellow with pivot point cited based on its 7/26/19 high plus 10 cents (read here).

Bullish action came after it reported earnings +43% on +21% sales revenues for the Jul '19 quarter. Three of the past 4 quarterly earnings increases were above the +25% minimum guideline (C criteria) and its sales revenues growth rate has accelerated. Annual earnings (A criteria) history has been strong and steady since a downturn in FY '13.

The number of top-rated funds owning its shares rose from 1,120 in Sep '18 to 1,339 in Sep '19, a reassuring sign concerning the I criteria. It has a Timeliness Rating of A and Sponsorship Rating of B.

Charts courtesy of www.stockcharts.com

Color Codes Explained :
Y - Better candidates highlighted by our staff of experts.
G - Previously featured in past reports as yellow but may no longer be buyable under the guidelines.

***Last / Change / Volume data in this table is the closing quote data***
Symbol/Exchange
Company Name
Industry Group
PRICE CHANGE
(%Change)
Day High Volume
(% DAV)
(% 50 day avg vol)
52 Wk Hi
% From Hi
Featured
Date
Price
Featured
Pivot Featured
Max Buy
StockCharts.com Latest Chart for MLR MLR - NYSE
Miller Industries Inc
AUTOMOTIVE - Auto Parts  
$36.60 -0.83
-2.22%

$37.50

77,553
209.60% of 50 DAV
50 DAV is 37,000
$37.70
-2.92%
9/24/2019 $34.00 PP = $35.36
MB = $37.13
Most Recent Note - 11/6/2019 12:29:17 PM
Y - Abruptly retreating from its 52-week high with today's big loss following an impressive spurt of volume-driven gains. Prior highs in the $35 area define support above its 50 DMA line. Fundamentals remain strong.
>>> FEATURED STOCK ARTICLE : Hit New High But Did Not Close Session Above Pivot Point - 10/29/2019
 |  View all notes | Set NEW NOTE alert | Company Profile | SEC News | Chart | Request a new note C A  S  I 
StockCharts.com Latest Chart for CCBG CCBG - NASDAQ
Capital City Bk Gp
BANKING - Regional - Mid-Atlantic Banks  
$30.52 -0.03
-0.10%

$30.78

88,145
267.11% of 50 DAV
50 DAV is 33,000
$30.60
-0.26%
9/13/2019 $27.03 PP = $27.05
MB = $28.40
Most Recent Note - 11/4/2019 12:00:54 PM
G - Hitting another new 52-week high with today's gap up gain, getting more extended from the prior base. Prior highs define important support to watch along with its 50 DMA line ($26.71).
>>> FEATURED STOCK ARTICLE : Noted "Positive Reversal" on Volatile Session After Earnings - 10/31/2019
 |  View all notes | Set NEW NOTE alert | Company Profile | SEC News | Chart | Request a new note C A  S  I 
StockCharts.com Latest Chart for AUDC AUDC - NASDAQ
Audiocodes Ltd
ELECTRONICS - Scientific and Technical Instrum  
$21.44 -0.07
-0.33%

$22.20

323,143
136.35% of 50 DAV
50 DAV is 237,000
$22.50
-4.71%
9/13/2019 $19.68 PP = $19.84
MB = $20.83
Most Recent Note - 11/6/2019 5:17:09 PM
G - Color code is changed to green after recent gains back above its "max buy" level. Reported earnings +26% on +15% sales revenues for the Sep '19 quarter. Rallied above the prior pivot point with last week's volume driven gains. Recent low ($17.54 on 10/08/19) defines the next important support.
>>> FEATURED STOCK ARTICLE : Consolidating Above 50-Day Average But Below Prior Pivot Point - 10/21/2019
 |  View all notes | Set NEW NOTE alert | Company Profile | SEC News | Chart | Request a new note C A  S  I 
StockCharts.com Latest Chart for CHDN CHDN - NASDAQ
Churchill Downs Inc
LEISURE - Gaming Activities  
$122.38 -0.78
-0.63%

$125.15

308,791
112.70% of 50 DAV
50 DAV is 274,000
$135.32
-9.56%
10/8/2019 $129.77 PP = $132.83
MB = $139.47
Most Recent Note - 11/4/2019 5:19:06 PM
G - Retreating from its all-time high, it violated its 50 DMA line ($126) with today's volume-driven loss and its color code is changed to green. Reported Sep '19 earnings +4% on +38% sales revenues versus the year ago period, its 2nd consecutive quarterly comparison below the +25% minimum earnings guideline (C criteria), raising greater fundamental concerns. See the latest FSU analysis for more details and an annotated graph.
>>> FEATURED STOCK ARTICLE : Perched at Record High at Time of Quarterly Report - 10/30/2019
 |  View all notes | Set NEW NOTE alert | Company Profile | SEC News | Chart | Request a new note C A  S  I 
StockCharts.com Latest Chart for LULU LULU - NASDAQ
Lululemon Athletica
MANUFACTURING - Textile Manufacturing  
$200.74 +6.40
3.29%

$200.90

2,467,588
127.00% of 50 DAV
50 DAV is 1,943,000
$209.02
-3.96%
9/6/2019 $201.25 PP = $194.35
MB = $204.07
Most Recent Note - 11/4/2019 5:16:56 PM
G - After wedging higher with gains lacking great volume conviction it is testing its 50 DMA line ($195.60) with losses on higher volume. The prior low ($185.36 on 10/03/19) defines the next important near-term support. See the latest FSU analysis for more details and a new annotated graph.
>>> FEATURED STOCK ARTICLE : Testing 50-Day Moving Average With Loss on Above Average Volume - 11/4/2019
 |  View all notes | Set NEW NOTE alert | Company Profile | SEC News | Chart | Request a new note C A  S  I 
Symbol/Exchange
Company Name
Industry Group
PRICE CHANGE
(%Change)
Day High Volume
(% DAV)
(% 50 day avg vol)
52 Wk Hi
% From Hi
Featured
Date
Price
Featured
Pivot Featured
Max Buy
StockCharts.com Latest Chart for CPRT CPRT - NASDAQ
Copart Inc
SPECIALTY RETAIL - Auto Dealerships  
$81.86 -0.39
-0.47%

$82.48

1,236,208
81.38% of 50 DAV
50 DAV is 1,519,000
$85.31
-4.04%
9/5/2019 $79.13 PP = $79.84
MB = $83.83
Most Recent Note - 11/6/2019 5:13:14 PM
Y - Color code is changed to yellow while consolidating below its "max buy" level and just above its 50 DMA line ($81.07). The 50 DMA line defines near-term support above the prior low ($76.35 on 10/03/19). Wedged to new all-time highs with recent gains lacking great volume conviction. See the latest FSU analysis for more details and a new annotated graph.
>>> FEATURED STOCK ARTICLE : Testing Support at 50-Day Moving Average - 11/6/2019
 |  View all notes | Set NEW NOTE alert | Company Profile | SEC News | Chart | Request a new note C A  S  I 
StockCharts.com Latest Chart for BLD BLD - NYSE
Topbuild Corp
Bldg-Constr Prds/Misc  
$109.22 +2.59
2.43%

$109.47

276,531
98.06% of 50 DAV
50 DAV is 282,000
$111.48
-2.03%
5/17/2019 $82.19 PP = $87.31
MB = $91.68
Most Recent Note - 11/4/2019 5:24:04 PM
G - Pulled back today after getting very extended from any sound base and powering to all-time highs with volume-driven gains. Reported earnings +24% on +5% sales revenues for the Sep '19 quarter versus the year ago period, just below the +25% minimum guideline (C criteria). Found prompt support near its 50 DMA line ($96) during its ongoing ascent.
>>> FEATURED STOCK ARTICLE : Pulling Back After Recently Wedging Into New High Territory - 10/23/2019
 |  View all notes | Set NEW NOTE alert | Company Profile | SEC News | Chart | Request a new note C A  S  I 

THESE ARE NOT BUY RECOMMENDATIONS!  Comments contained in the body of this report are technical opinions only. The material herein has been obtained from sources believed to be reliable and accurate, however, its accuracy and completeness cannot be guaranteed. This site is not an investment advisor, hence it does not endorse or recommend any securities or other investments. Any recommendation contained in this report may not be suitable for all investors and it is not to be deemed an offer or solicitation on our part with respect to the purchase or sale of any securities. All trademarks, service marks and trade names appearing in this report are the property of their respective owners, and are likewise used for identification purposes only.

This report is a service available only to active Paid Premium Members. You may opt-out of receiving report notifications at any time.  Questions or comments may be submitted by writing to Premium Membership Services 665 S.E. 10 Street, Suite 201 Deerfield Beach, FL 33441-5634 or by calling 1-800-965-8307 or 954-785-1121.

Kenneth J. Gruneisen founded Gruneisen Growth Corp. (2003), which prior to May 11, 2015, operated CANSLIM.net and CANSLIM.com both under license from Data Analysis Inc. / Investor's Business Daily. Kenneth has passed the CAN SLIM® Master's Exam. Gruneisen Growth Corp. now continues over two decades of fact based market analysis via FactBasedInvesting.com.

Copyright © 1996-2024 Gruneisen Growth Corp. All rights reserved. Protected by the copyright laws of the United States and Canada and by international treaties

Privacy Policy | Terms of Use | Contact Us