You are not logged in.
This means you
CAN ONLY VIEW reports that were published prior to Monday, April 14, 2025.
You
MUST UPGRADE YOUR MEMBERSHIP if you want to see any current reports.
AFTER MARKET UPDATE - THURSDAY, NOVEMBER 6TH, 2014
Previous After Market Report Next After Market Report >>>
|
|
|
|
DOW |
+69.94 |
17,554.47 |
+0.40% |
|
Volume |
733,804,880 |
-6% |
|
Volume |
1,821,398,630 |
-1% |
|
NASDAQ |
+17.75 |
4,638.47 |
+0.38% |
|
Advancers |
1,743 |
54% |
|
Advancers |
1,656 |
56% |
|
S&P 500 |
+7.64 |
2,031.21 |
+0.38% |
|
Decliners |
1,337 |
42% |
|
Decliners |
1,190 |
40% |
|
Russell 2000 |
+4.79 |
1,171.86 |
+0.41% |
|
52 Wk Highs |
177 |
|
|
52 Wk Highs |
117 |
|
|
S&P 600 |
+1.68 |
678.90 |
+0.25% |
|
52 Wk Lows |
61 |
|
|
52 Wk Lows |
64 |
|
|
 |
Major Averages Rose With Less Volume Conviction
Kenneth J. Gruneisen - Passed the CAN SLIM® Master's Exam
Stocks edged higher on Thursday. The volume totals were reported lighter than the prior session totals on the NYSE and on the Nasdaq exchange. Breadth was positive as advancers led decliners by about a 4-3 margin on the NYSE and on the Nasdaq exchange. There were 84 high-ranked companies from the CANSLIM.net Leaders List that made new 52-week highs and appeared on the CANSLIM.net BreakOuts Page, down from the prior session total of 101 stocks. New 52-week highs contracted yet still outnumbered new 52-week lows on the NYSE and on the Nasdaq exchange. There were gains for 8 of the 12 high-ranked companies currently on the Featured Stocks Page, a list which recently gained several new companies as broader market conditions improved. Disciplined investors know that new buying efforts may be made under the fact-based investment system only in stocks meeting all key criteria.
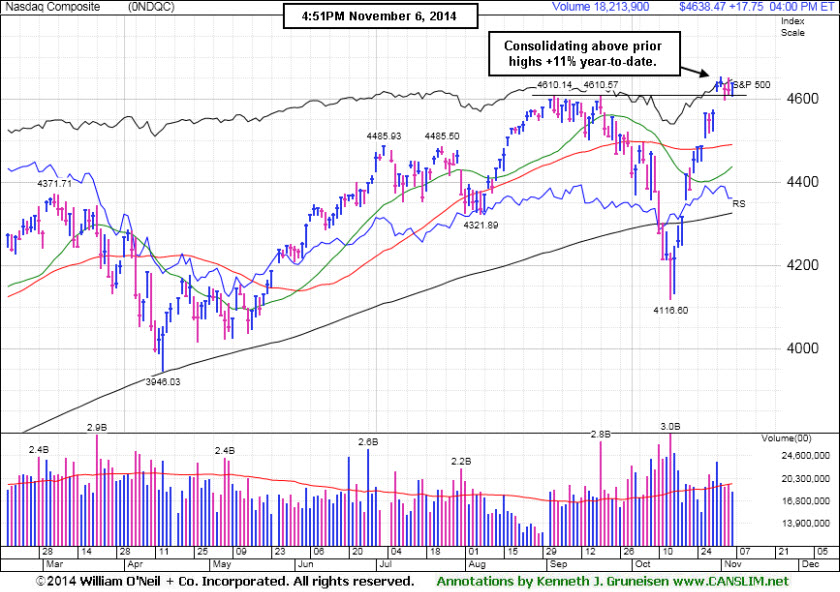
PICTURED: The Nasdaq Composite index is consolidating above prior highs, and it climbed 17 points to 4,638. The tech-heavy index is up +11% year-to-date.
The Dow rose 69 points to a new record high of 17,554. The S&P 500 also closed at a fresh all-time high as it gained 7 points to 2,031.
The major averages advanced but gains were limited ahead of tomorrow’s all-important non-farm payrolls report. The economy is projected to add 235,000 jobs in October while the unemployment rate remains at a six-year low of 5.9%. Today’s economic data was encouraging as jobless claims fell more than anticipated to a three-week of 278,000.
Investors were also focused on monetary policy as the European Central Bank left interests rates unchanged. In addition, President Mario Draghi said officials are ready to boost stimulus measures if needed and signaled the bank may cut growth forecasts next month as growth weakens.
Seven of the 10 sectors in the S&P 500 finished in positive territory. Energy and consumer stocks helped lift the market. EOG Resources (EOG +2.99%) rose. Whole Foods Market (WFM +12.15%) rallied after posting a quarterly profit above analyst estimates. Utilities and tech were among the worst performing groups. Duke Energy (DUK -2.79%). Shares of Qualcomm (QCOM -8.58%) fell after the chipmaker reported disappointing earnings and warned that next year's profit may be hurt by an antitrust investigation in China.
Treasuries declined. The 10-year note lost 10/32 to yield 2.38%.
Large gains on 10/21/14 backed by higher volume totals while leadership (stocks hitting new 52-week highs) expanded met the definition of a "follow-through day" confirming a new uptrend for the market (M criteria). The S&P 500 Index, Nasdaq Composite Index, and the Dow Jones Industrial Average have collectively rebounded above their respective 50-day and 200-day moving average (DMA) lines, technically putting the market in a healthier stance.
The CANSLIM.net Featured Stocks Page shows the most action-worthy candidates and their latest notes and a Headline Link directs members to the latest detailed analysis with data-packed graphs annotated by a Certified expert along with links to additional resources. The Premium Member Homepage includes "dynamic archives" to all prior pay reports published.
|
 Kenneth J. Gruneisen started out as a licensed stockbroker in August 1987, a couple of months prior to the historic stock market crash that took the Dow Jones Industrial Average down -22.6% in a single day. He has published daily fact-based fundamental and technical analysis on high-ranked stocks online for two decades. Through FACTBASEDINVESTING.COM, Kenneth provides educational articles, news, market commentary, and other information regarding proven investment systems that work in good times and bad.
Comments contained in the body of this report are technical opinions only and are not necessarily those of Gruneisen Growth Corp. The material herein has been obtained from sources believed to be reliable and accurate, however, its accuracy and completeness cannot be guaranteed. Our firm, employees, and customers may effect transactions, including transactions contrary to any recommendation herein, or have positions in the securities mentioned herein or options with respect thereto. Any recommendation contained in this report may not be suitable for all investors and it is not to be deemed an offer or solicitation on our part with respect to the purchase or sale of any securities. |
|
 |
XAU Bounces From Multi-Year Lows; Retail, Financial, and Energy Groups Rose
Kenneth J. Gruneisen - Passed the CAN SLIM® Master's Exam
The Retail Index ($RLX +1.15%) was a positive influence on the major averages while the Broker/Dealer Index ($XBD +0.21%) and Bank Index ($BKX +0.65%) both helped with modest gains. The Biotechnology Index ($BTK +1.56%) led the tech sector and the Networking Index ($NWX +0.69%) posted a modest gain while the Semiconductor Index ($SOX -0.88%) declined. Energy-related shares rose and the Integrated Oil Index ($XOI +0.81%) and Oil Services Index ($OSX +1.50%) both posted gains.
Charts courtesy www.stockcharts.com
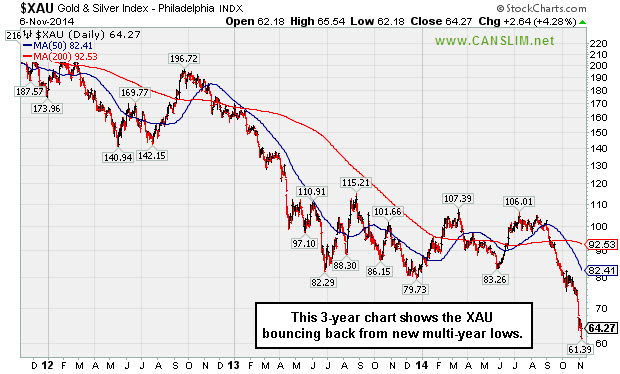
PICTURED: The Gold & Silver Index ($XAU +4.28%) was a standout gainer as it bounced back from multi-year lows..
| Oil Services |
$OSX |
244.25 |
+3.60 |
+1.50% |
-13.09% |
| Integrated Oil |
$XOI |
1,460.69 |
+11.70 |
+0.81% |
-2.82% |
| Semiconductor |
$SOX |
643.30 |
-5.74 |
-0.88% |
+20.24% |
| Networking |
$NWX |
338.01 |
+2.32 |
+0.69% |
+4.34% |
| Broker/Dealer |
$XBD |
176.97 |
+0.38 |
+0.21% |
+10.22% |
| Retail |
$RLX |
948.44 |
+10.76 |
+1.15% |
+0.92% |
| Gold & Silver |
$XAU |
64.27 |
+2.64 |
+4.28% |
-23.62% |
| Bank |
$BKX |
73.22 |
+0.47 |
+0.65% |
+5.72% |
| Biotech |
$BTK |
3,321.90 |
+50.98 |
+1.56% |
+42.54% |
|
|
|
 |
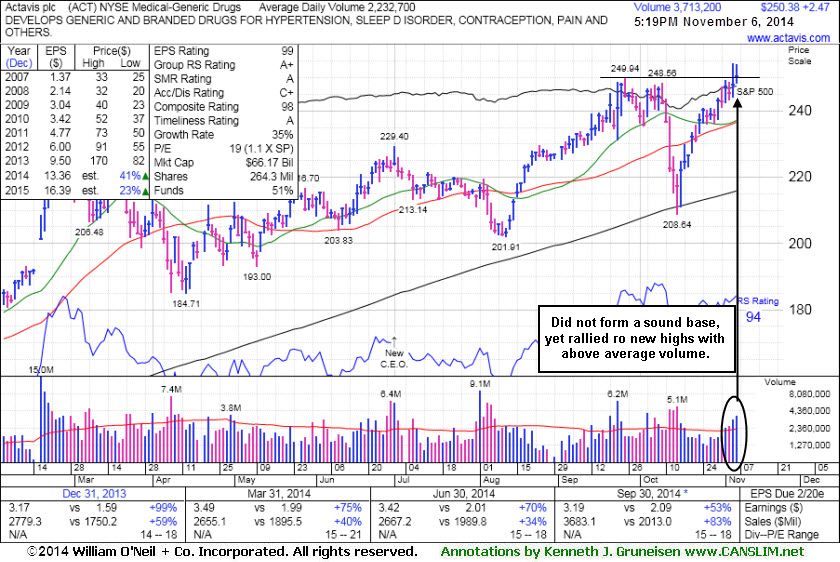
New Highs Following Deep "V" Shaped Pullback - Not a Sound Base
Kenneth J. Gruneisen - Passed the CAN SLIM® Master's Exam
Actavis plc (ACT +$2.47 or +1.00% to $250.38) is perched at its 52-week high after today's 2nd consecutive volume-driven gain. It did not form a sound base pattern, but there was a deep "V" shaped pullback and recovery, and now it is extended from its prior base. Recent lows near $208 define initial support to watch below its 50-day moving average (DMA) line ($236.59) on pullbacks.
Its current Accumulation/Distribution Rating is C+, up from a D- when last shown in this FSU section on 10/21/14 with annotated graphs under the headline, "Quiet Gains Help Generic Drug Firm Rise Above 50-Day Average". It found prompt support at its 200 DMA line after a damaging streak of 5 consecutive losses marked by volume triggered technical sell signals.
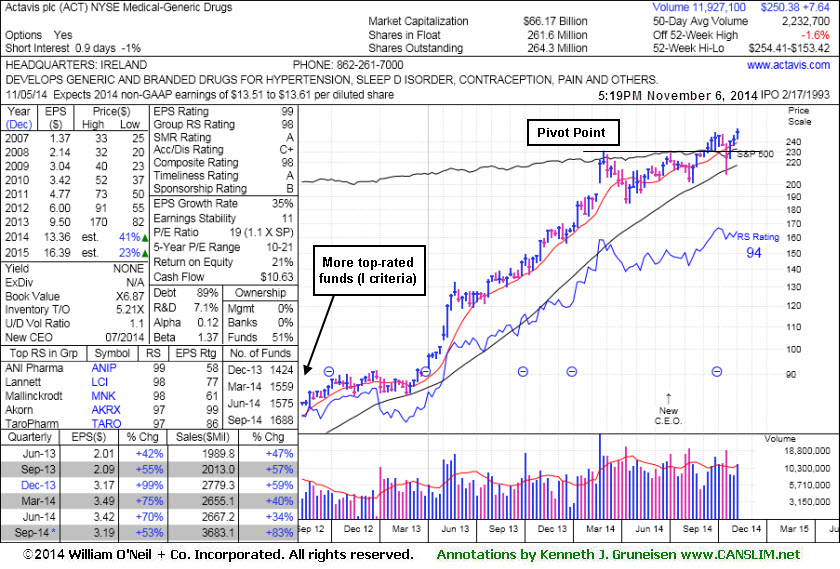
ACT was first highlighted in yellow in the 6/20/14 mid-day report (read here) with a pivot point based on its 2/26/14 high plus 10 cents. The Medical - Generic Drugs industry group currently has a 98 Group Relative Strength Rating, up from a 66 when shown on 8/28/14. Leadership from other issues in the group is also a reassuring sign concerning the L criteria. It reported earnings +53% on +83% sales revenues for the Sep '14 quarter, and its strong record satisfies the C criteria. Its annual earnings (A criteria) history has also been strong. The number of top-rated funds owning its shares has been on the rise, up from 1,219 in Sep '13 to 1,688 in Sep '14, a reassuring sign concerning the I criteria.
|
|
|
Color Codes Explained :
Y - Better candidates highlighted by our
staff of experts.
G - Previously featured
in past reports as yellow but may no longer be buyable under the
guidelines.
***Last / Change / Volume data in this table is the closing quote data***
Symbol/Exchange
Company Name
Industry Group |
PRICE |
CHANGE
(%Change) |
Day High |
Volume
(% DAV)
(% 50 day avg vol) |
52 Wk Hi
% From Hi |
Featured
Date |
Price
Featured |
Pivot Featured |
|
Max Buy |
ACT
-
NYSE
Actavis plc
Medical-Generic Drugs
|
$250.38
|
+2.47
1.00% |
$254.13
|
3,833,900
171.77% of 50 DAV
50 DAV is 2,232,000
|
$254.41
-1.58%
|
6/20/2014
|
$216.53
|
PP = $230.87
|
|
MB = $242.41
|
 Most Recent Note - 11/6/2014 5:38:55 PM
G - Perched at its 52-week high today following 2 volume-driven gains, extended from any sound base. Recent lows near $208 define initial support to watch below its 50 DMA line ($236) on pullbacks. See the latest FSU analysis for more details and new annotated graphs.
>>> FEATURED STOCK ARTICLE : New Highs Following Deep "V" Shaped Pullback - Not a Sound Base - 11/6/2014
View all notes |
Set NEW NOTE alert |
CANSLIM.net Company Profile |
SEC
News |
Chart |
Request a new note
C
A N
S L
I M


|
AFSI
-
NASDAQ
Amtrust Financial Svcs
INSURANCE - Property and; Casualty Insurance
|
$50.47
|
-1.02
-1.98% |
$51.56
|
1,019,400
108.79% of 50 DAV
50 DAV is 937,000
|
$53.50
-5.66%
|
10/17/2014
|
$45.24
|
PP = $46.02
|
|
MB = $48.32
|
Most Recent Note - 11/5/2014 6:23:12 PM
G - Tallied 4 consecutive gains with above average volume, rallying back toward its 52-week high. Found support at its 50 DMA line when abruptly retreating last week following an analyst downgrade. See the latest FSU analysis for more details and new annotated graphs.
>>> FEATURED STOCK ARTICLE : 50-Day Average Acted as Support Following Analyst Downgrade - 11/5/2014
View all notes |
Set NEW NOTE alert |
CANSLIM.net Company Profile |
SEC
News |
Chart |
Request a new note
C
A N
S L
I M
|
ALXN
-
NASDAQ
Alexion Pharmaceuticals
DRUGS - Drug Manufacturers - Other
|
$193.14
|
+3.25
1.71% |
$195.95
|
1,380,854
113.74% of 50 DAV
50 DAV is 1,214,000
|
$197.64
-2.28%
|
10/23/2014
|
$184.01
|
PP = $185.53
|
|
MB = $194.81
|
Most Recent Note - 11/6/2014 5:41:54 PM
Y - Managed a best-ever close with today's gain on slightly higher than average volume. Prior highs in the $180 area define initial support to watch on pullbacks.
>>> FEATURED STOCK ARTICLE : Finished Strong After Gapping Up Above Prior High - 10/23/2014
View all notes |
Set NEW NOTE alert |
CANSLIM.net Company Profile |
SEC
News |
Chart |
Request a new note
C
A N
S L
I M
|
BIDU
-
NASDAQ
Baidu Inc Ads
INTERNET - Internet Information Providers
|
$236.90
|
-0.80
-0.34% |
$239.06
|
2,965,309
78.22% of 50 DAV
50 DAV is 3,791,000
|
$246.00
-3.70%
|
10/30/2014
|
$234.08
|
PP = $231.51
|
|
MB = $243.09
|
Most Recent Note - 11/4/2014 5:43:47 PM
Y - Gain today on lighter volume for a best-ever close but still finished below its "max buy" level. Prior highs near $230 define near-term support to watch on pullbacks.
>>> FEATURED STOCK ARTICLE : Technical Breakout on Triple Average Volume Following Strong Earnings - 10/30/2014
View all notes |
Set NEW NOTE alert |
CANSLIM.net Company Profile |
SEC
News |
Chart |
Request a new note
C
A N
S L
I M
|
EPAM
-
NYSE
Epam Systems Inc
COMPUTER SOFTWARE and SERVICES - Information Technology Service
|
$47.92
|
-0.33
-0.68% |
$48.79
|
270,086
64.15% of 50 DAV
50 DAV is 421,000
|
$50.00
-4.16%
|
10/23/2014
|
$45.21
|
PP = $46.09
|
|
MB = $48.39
|
Most Recent Note - 11/5/2014 1:45:06 PM
Y - Poised for a best-ever close with today's big gain. Found prompt support on the prior session after briefly undercutting prior highs in the $44 area. The latest FSU analysis (10/24/14) reminded members - "Keep in mind that the high-ranked Computer - Tech Services firm is due to report earnings for the Sep '14 quarter on 11/04/14. Volume and volatility often increase near earnings news."
>>> FEATURED STOCK ARTICLE : Pulled Back After Challenging Prior Highs - 10/24/2014
View all notes |
Set NEW NOTE alert |
CANSLIM.net Company Profile |
SEC
News |
Chart |
Request a new note
C
A N
S L
I M
|
Symbol/Exchange
Company Name
Industry Group |
PRICE |
CHANGE
(%Change) |
Day High |
Volume
(% DAV)
(% 50 day avg vol) |
52 Wk Hi
% From Hi |
Featured
Date |
Price
Featured |
Pivot Featured |
|
Max Buy |
FB
-
NASDAQ
Facebook Inc Cl A
INTERNET
|
$75.26
|
+0.43
0.57% |
$75.60
|
21,315,456
53.15% of 50 DAV
50 DAV is 40,104,000
|
$81.16
-7.27%
|
9/9/2014
|
$76.67
|
PP = $76.84
|
|
MB = $80.68
|
Most Recent Note - 11/5/2014 1:52:48 PM
G - Encountering resistance at its 50 DMA line following a violation on 3 times average volume on 10/29/14 that raised concerns and triggered a technical sell signal. Volume and volatility often increase near earnings news. The company reported earnings +59% on +59% sales for the Sep '14 quarter but warned of rising costs. Historic studies show that investors have a far better chance of success when buying as a stock is breaking out, not buying on pullbacks.
>>> FEATURED STOCK ARTICLE : Gapped Down Following Latest Strong Earnings Report - 10/29/2014
View all notes |
Set NEW NOTE alert |
CANSLIM.net Company Profile |
SEC
News |
Chart |
Request a new note
C
A N
S L
I M
|
FLT
-
NYSE
Fleetcor Technologies
DIVERSIFIED SERVICES - Business/Management Services
|
$150.47
|
+1.96
1.32% |
$150.69
|
531,361
74.42% of 50 DAV
50 DAV is 714,000
|
$153.52
-1.99%
|
10/31/2014
|
$148.50
|
PP = $146.29
|
|
MB = $153.60
|
Most Recent Note - 11/5/2014 1:57:22 PM
Y - Holding its ground after volume-driven gains for new 52-week highs. Finished strong after highlighted in yellow in the 10/31/14 mid-day report (read here) clinching a convincing technical buy signal. Disciplined investors avoid chasing stocks more than +5% above prior highs and always limit losses by selling any stock that falls more than -7% from their purchase price.
>>> FEATURED STOCK ARTICLE : Strong Finish Following Gap Up After Earnings News - 10/31/2014
View all notes |
Set NEW NOTE alert |
CANSLIM.net Company Profile |
SEC
News |
Chart |
Request a new note
C
A N
S L
I M
|
ILMN
-
NASDAQ
Illumina Inc
DRUGS - Biotechnology
|
$189.87
|
+3.50
1.88% |
$190.89
|
850,484
67.07% of 50 DAV
50 DAV is 1,268,000
|
$197.37
-3.80%
|
10/22/2014
|
$188.77
|
PP = $182.27
|
|
MB = $191.38
|
Most Recent Note - 11/5/2014 2:00:36 PM
Y - Volume totals have been cooling while consolidating and its color code is changed to yellow after dipping below its "max buy" level. Prior highs near $182 define near-term support to watch on pullbacks.
>>> FEATURED STOCK ARTICLE : Breakout Cleared "Double Bottom" Base Pattern - 10/22/2014
View all notes |
Set NEW NOTE alert |
CANSLIM.net Company Profile |
SEC
News |
Chart |
Request a new note
C
A N
S L
I M
|
NBCB
-
NASDAQ
First N B C Bank Hldg
Banks-Southeast
|
$37.25
|
+0.27
0.73% |
$37.54
|
71,344
80.16% of 50 DAV
50 DAV is 89,000
|
$37.83
-1.53%
|
10/31/2014
|
$36.31
|
PP = $35.93
|
|
MB = $37.73
|
Most Recent Note - 11/5/2014 6:30:11 PM
Y - Pulled back today on higher (near average) volume following 8 consecutive gains. No resistance remains due to overhead supply. Highlighted in yellow in the 10/31/14 mid-day report (read here). Prior highs near $34 define near-term support to watch on pullbacks.
>>> FEATURED STOCK ARTICLE : Financial Firm at 52-Week High Tallied 8th Consecutive Gain - 11/3/2014
View all notes |
Set NEW NOTE alert |
CANSLIM.net Company Profile |
SEC
News |
Chart |
Request a new note
C
A N
S L
I M
|
PANW
-
NYSE
Palo Alto Networks
Computer Sftwr-Security
|
$106.11
|
+3.59
3.50% |
$106.11
|
1,115,192
48.11% of 50 DAV
50 DAV is 2,318,000
|
$108.50
-2.20%
|
7/30/2014
|
$84.21
|
PP = $85.88
|
|
MB = $90.17
|
Most Recent Note - 11/5/2014 6:26:10 PM
G - Finished near the session low with a loss today on higher but below average volume. Its 50 DMA line ($98.05) defines near-term support to watch.
>>> FEATURED STOCK ARTICLE : Rebound and Rally Leaves Tech Firm Extended From Base - 10/28/2014
View all notes |
Set NEW NOTE alert |
CANSLIM.net Company Profile |
SEC
News |
Chart |
Request a new note
C
A N
S L
I M
|
Symbol/Exchange
Company Name
Industry Group |
PRICE |
CHANGE
(%Change) |
Day High |
Volume
(% DAV)
(% 50 day avg vol) |
52 Wk Hi
% From Hi |
Featured
Date |
Price
Featured |
Pivot Featured |
|
Max Buy |
SNCR
-
NASDAQ
Synchronoss Technologies
COMPUTER SOFTWARE andamp; SERVICES - Application Software
|
$52.33
|
+1.80
3.56% |
$52.46
|
819,667
155.24% of 50 DAV
50 DAV is 528,000
|
$53.47
-2.13%
|
10/27/2014
|
$46.40
|
PP = $47.81
|
|
MB = $50.20
|
Most Recent Note - 11/6/2014 5:40:47 PM
G - Matched its best-ever close with today's volume-driven gain. Prior highs in the $47 area define initial support to watch above its 50 DMA line ($45.53) on pullbacks.
>>> FEATURED STOCK ARTICLE : No Resistance Remains; Perched at Secondary Buy Point - 10/27/2014
View all notes |
Set NEW NOTE alert |
CANSLIM.net Company Profile |
SEC
News |
Chart |
Request a new note
C
A N
S L
I M
|
STRT
-
NASDAQ
Strattec Security Corp
AUTOMOTIVE - Auto Parts
|
$103.00
|
-1.81
-1.73% |
$104.80
|
17,523
62.58% of 50 DAV
50 DAV is 28,000
|
$109.44
-5.88%
|
9/19/2014
|
$86.06
|
PP = $89.97
|
|
MB = $94.47
|
Most Recent Note - 11/4/2014 5:45:39 PM
G - Hovering near its 52-week high, extended from its prior base after volume-driven gains. Prior highs in the $88 area define important near-term support to watch above its 50 DMA line. See the latest FSU analysis for more details and new annotated graphs.
>>> FEATURED STOCK ARTICLE : Stock With Small Supply Quickly Got Extended From Prior Base - 11/4/2014
View all notes |
Set NEW NOTE alert |
CANSLIM.net Company Profile |
SEC
News |
Chart |
Request a new note
C
A N
S L
I M
|
|
|
|
THESE ARE NOT BUY RECOMMENDATIONS!
Comments contained in the body of this report are technical
opinions only. The material herein has been obtained
from sources believed to be reliable and accurate, however,
its accuracy and completeness cannot be guaranteed.
This site is not an investment advisor, hence it does
not endorse or recommend any securities or other investments.
Any recommendation contained in this report may not
be suitable for all investors and it is not to be deemed
an offer or solicitation on our part with respect to
the purchase or sale of any securities. All trademarks,
service marks and trade names appearing in this report
are the property of their respective owners, and are
likewise used for identification purposes only.
This report is a service available
only to active Paid Premium Members.
You may opt-out of receiving report notifications
at any time. Questions or comments may be submitted
by writing to Premium Membership Services 665 S.E. 10 Street, Suite 201 Deerfield Beach, FL 33441-5634 or by calling 1-800-965-8307
or 954-785-1121.
|
|
|

