You are not logged in.
This means you
CAN ONLY VIEW reports that were published prior to Tuesday, April 15, 2025.
You
MUST UPGRADE YOUR MEMBERSHIP if you want to see any current reports.
AFTER MARKET UPDATE - WEDNESDAY, NOVEMBER 5TH, 2014
Previous After Market Report Next After Market Report >>>
|
|
|
|
DOW |
+100.69 |
17,484.53 |
+0.58% |
|
Volume |
777,380,860 |
-4% |
|
Volume |
1,839,265,530 |
+3% |
|
NASDAQ |
-2.92 |
4,620.72 |
-0.06% |
|
Advancers |
1,815 |
57% |
|
Advancers |
1,615 |
53% |
|
S&P 500 |
+11.47 |
2,023.57 |
+0.57% |
|
Decliners |
1,272 |
40% |
|
Decliners |
1,348 |
44% |
|
Russell 2000 |
+1.65 |
1,167.07 |
+0.14% |
|
52 Wk Highs |
252 |
|
|
52 Wk Highs |
138 |
|
|
S&P 600 |
+1.50 |
677.22 |
+0.22% |
|
52 Wk Lows |
70 |
|
|
52 Wk Lows |
57 |
|
|
 |
Dow and S&P 500 Index Both Hit New Record Highs
Kenneth J. Gruneisen - Passed the CAN SLIM® Master's Exam
Most stocks advanced on Wednesday. The Dow closed at a new record high of 17,484 as it gained 100 points. The S&P 500 rose 11 points to an all-time high of 2,023. The volume totals were reported mixed, lighter than the prior session total on the NYSE and higher on the Nasdaq exchange. Breadth was positive as advancers led decliners by a 3-2 margin on the NYSE and 8-7 on the Nasdaq exchange. There were 101 high-ranked companies from the CANSLIM.net Leaders List that made new 52-week highs and appeared on the CANSLIM.net BreakOuts Page, up from the prior session total of 65 stocks. The new 52-week highs totals expanded and easily outnumbered new 52-week lows on the NYSE and on the Nasdaq exchange. There were gains for 4 of the 12 high-ranked companies currently on the Featured Stocks Page, a list which recently gained several new companies as broader market conditions improved. Disciplined investors know that new buying efforts may be made under the fact-based investment system only in stocks meeting all key criteria.
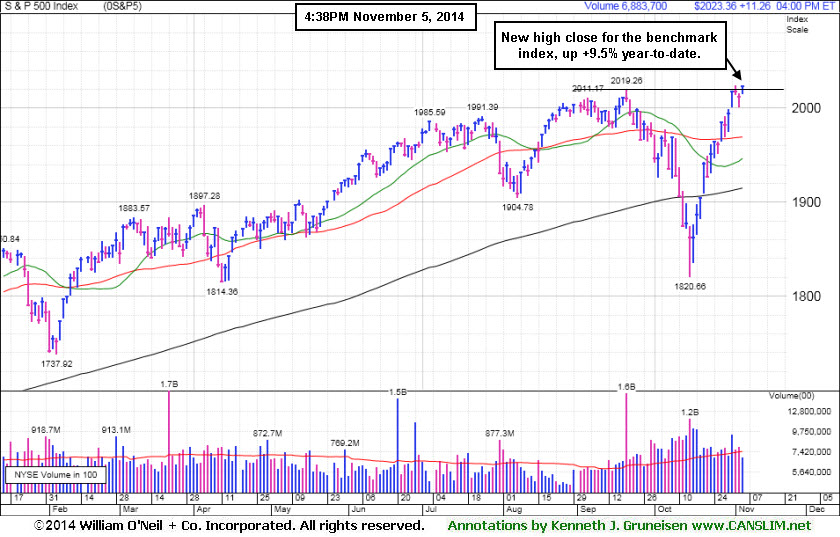
PICTURED: The S&P 500 Index finished at a best-ever close and it is up +9.5% year-to-date.
Investors spent the session digesting mid-term elections and encouraging jobs data. Republicans retained control of the House and won their first Senate majority in eight years. Ahead of Friday's all-important non-farm payrolls number ADP reported companies unexpectedly added 230,000 workers to payrolls in October, the most in four months. Other data showed the ISM's non-manufacturing index ticked lower last month, but exceeded the average for the first six months of the year. A separate report revealed U.S. service industries expanded at a slower pace in October.
Nine of the 10 sectors in the S&P 500 finished higher. The tech-heavy NASDAQ Composite lost 3 points to 4,620 as Google's (GOOGL -1.46%) and Facebook (FB -1.23%) fell. Utilities paced the advance led by NextEra Energy (NEE +3.88%). Energy was also among the best performing groups as WTI crude rebounded from a three-year low. EOG Resources (EOG +6.45%) rose after reporting better-than-expected earnings results. Schlumberger (SLB +2.63%) erased the prior session's loss. Health care lagged behind amid a drop in biotech stocks including Gilead Sciences (GILD -3.34%).
Treasuries declined. The 10-year note fell 2/32 to yield 2.34%.
Large gains on 10/21/14 backed by higher volume totals while leadership (stocks hitting new 52-week highs) expanded met the definition of a "follow-through day" confirming a new uptrend for the market (M criteria). The S&P 500 Index, Nasdaq Composite Index, and the Dow Jones Industrial Average have collectively rebounded above their respective 50-day and 200-day moving average (DMA) lines, technically putting the market in a healthier stance.
The CANSLIM.net Featured Stocks Page shows the most action-worthy candidates and their latest notes and a Headline Link directs members to the latest detailed analysis with data-packed graphs annotated by a Certified expert along with links to additional resources. The Premium Member Homepage includes "dynamic archives" to all prior pay reports published.
|
 Kenneth J. Gruneisen started out as a licensed stockbroker in August 1987, a couple of months prior to the historic stock market crash that took the Dow Jones Industrial Average down -22.6% in a single day. He has published daily fact-based fundamental and technical analysis on high-ranked stocks online for two decades. Through FACTBASEDINVESTING.COM, Kenneth provides educational articles, news, market commentary, and other information regarding proven investment systems that work in good times and bad.
Comments contained in the body of this report are technical opinions only and are not necessarily those of Gruneisen Growth Corp. The material herein has been obtained from sources believed to be reliable and accurate, however, its accuracy and completeness cannot be guaranteed. Our firm, employees, and customers may effect transactions, including transactions contrary to any recommendation herein, or have positions in the securities mentioned herein or options with respect thereto. Any recommendation contained in this report may not be suitable for all investors and it is not to be deemed an offer or solicitation on our part with respect to the purchase or sale of any securities. |
|
 |
Gains for Financial, Energy, and Semiconductor Indexes
Kenneth J. Gruneisen - Passed the CAN SLIM® Master's Exam
The tech sector was mixed as the Semiconductor Index ($SOX +0.94%) rose while Biotechnology Index ($BTK -1.74%) fell and the Networking Index ($NWX -0.34%) also edged lower. Financial shares had a positive influence on the major averages as the Broker/Dealer Index ($XBD +0.57%) and the Bank Index ($BKX +0.78%) rose, but a loss for the Retail Index ($RLX -0.44%) created a slight drag. Energy-related shares posted gains and the Integrated Oil Index ($XOI +1.30%) and the Oil Services Index ($OSX +2.76%) rallied, meanwhile the Gold & Silver Index ($XAU -4.23%) was a standout decliner yet again.
Charts courtesy www.stockcharts.com
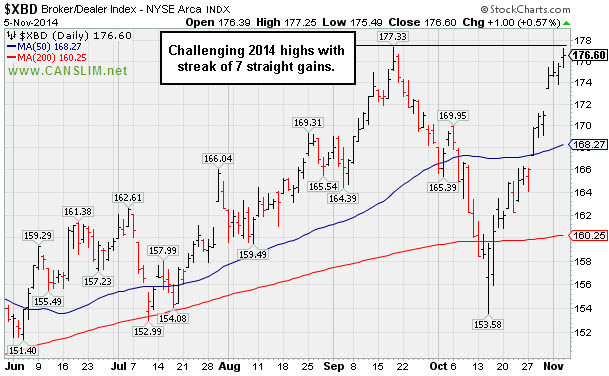
PICTURED: The Broker/Dealer Index ($XBD +0.57%) is challenging its 2014 high with a streak of 7 consecutive gains.
| Oil Services |
$OSX |
240.65 |
+6.46 |
+2.76% |
-14.37% |
| Integrated Oil |
$XOI |
1,448.99 |
+18.64 |
+1.30% |
-3.60% |
| Semiconductor |
$SOX |
649.04 |
+6.05 |
+0.94% |
+21.31% |
| Networking |
$NWX |
335.70 |
-1.13 |
-0.34% |
+3.63% |
| Broker/Dealer |
$XBD |
176.60 |
+1.00 |
+0.57% |
+9.99% |
| Retail |
$RLX |
937.68 |
-4.14 |
-0.44% |
-0.23% |
| Gold & Silver |
$XAU |
61.63 |
-2.72 |
-4.23% |
-26.76% |
| Bank |
$BKX |
72.75 |
+0.56 |
+0.78% |
+5.04% |
| Biotech |
$BTK |
3,270.91 |
-57.82 |
-1.74% |
+40.36% |
|
|
|
 |
50-Day Average Acted as Support Following Analyst Downgrade
Kenneth J. Gruneisen - Passed the CAN SLIM® Master's Exam
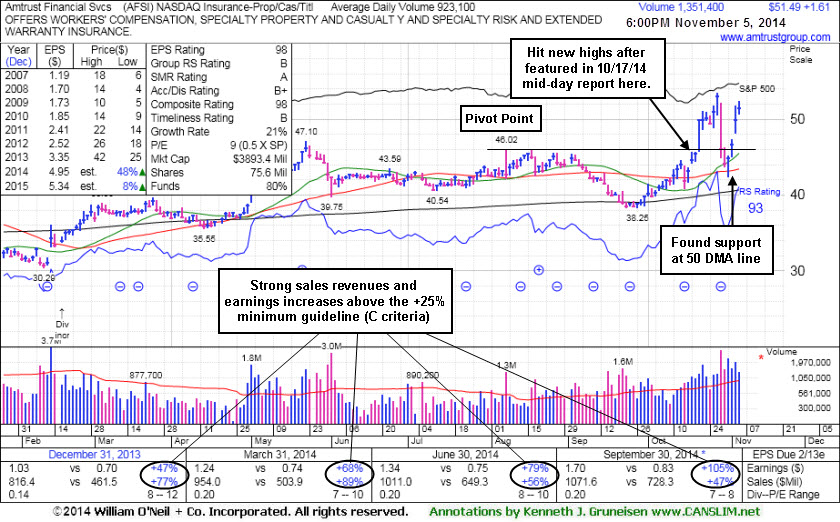
Amtrust Financial Services' (AFSI +$1.61 or +3.23% to $51.49) tallied a 4th consecutive gain today with above average volume, rallying back toward its 52-week high, and it faces no resistance due to overhead supply. It found support at its 50-day moving average (DMA) line when abruptly retreating last week following an analyst downgrade.
It was highlighted in yellow with new pivot point cited based on its 8/07/14 high in the 10/17/14 mid-day report (read here) and. This FSU section on 10/17/14 included detailed analysis and annotated graphs under the headline, "Perched Near High After Rebounding From 200-Day Average". Subsequent volume-driven gains above the pivot point triggered a technical buy signal. It found support at its 200-day moving average (DMA) line then rebounded since dropped from the Featured Stocks list on 9/15/14.
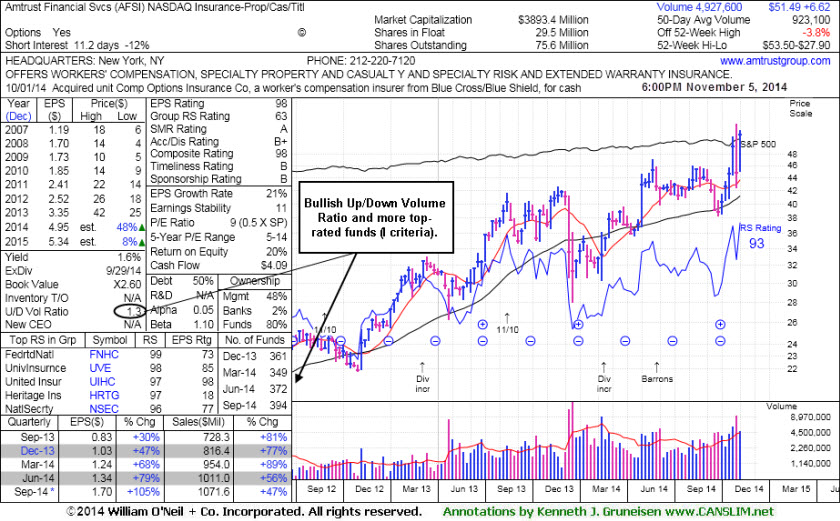
The number of top-rated funds owning an interest rose from 349 in Mar '14 to 394 in Sep '14, a reassuring sign concerning the I criteria. The high-ranked Insurance - Property/Casualty/Title firm reported earnings +105% on +47% sales revenues for the quarter ended Sep '14 quarter versus the year ago period, its 9th consecutive comparison above the +25% minimum earnings guideline (C criteria). It has a great annual earnings (A criteria) history and it has earned an impressive 98 Earnings Per Share rating, well above the 80+ minimum rating for buy candidates. Its Relative Strength Rating is currently 93, above the 80+ minimum guideline for buy candidates.
|
|
|
Color Codes Explained :
Y - Better candidates highlighted by our
staff of experts.
G - Previously featured
in past reports as yellow but may no longer be buyable under the
guidelines.
***Last / Change / Volume data in this table is the closing quote data***
Symbol/Exchange
Company Name
Industry Group |
PRICE |
CHANGE
(%Change) |
Day High |
Volume
(% DAV)
(% 50 day avg vol) |
52 Wk Hi
% From Hi |
Featured
Date |
Price
Featured |
Pivot Featured |
|
Max Buy |
ACT
-
NYSE
Actavis plc
Medical-Generic Drugs
|
$247.91
|
+2.59
1.06% |
$254.41
|
3,239,753
147.73% of 50 DAV
50 DAV is 2,193,000
|
$249.94
-0.81%
|
6/20/2014
|
$216.53
|
PP = $230.87
|
|
MB = $242.41
|
 Most Recent Note - 11/5/2014 1:50:22 PM
G - Off earlier highs after hitting a new 52-week high today. Recent lows near $208 define initial support to watch below its 50 DMA line ($236) on pullbacks.
>>> FEATURED STOCK ARTICLE : Quiet Gains Help Generic Drug Firm Rise Above 50-Day Average - 10/21/2014
View all notes |
Set NEW NOTE alert |
CANSLIM.net Company Profile |
SEC
News |
Chart |
Request a new note
C
A N
S L
I M


|
AFSI
-
NASDAQ
Amtrust Financial Svcs
INSURANCE - Property and; Casualty Insurance
|
$51.49
|
+1.61
3.23% |
$52.40
|
1,351,507
146.43% of 50 DAV
50 DAV is 923,000
|
$53.50
-3.76%
|
10/17/2014
|
$45.24
|
PP = $46.02
|
|
MB = $48.32
|
Most Recent Note - 11/5/2014 6:23:12 PM
G - Tallied 4 consecutive gains with above average volume, rallying back toward its 52-week high. Found support at its 50 DMA line when abruptly retreating last week following an analyst downgrade. See the latest FSU analysis for more details and new annotated graphs.
>>> FEATURED STOCK ARTICLE : 50-Day Average Acted as Support Following Analyst Downgrade - 11/5/2014
View all notes |
Set NEW NOTE alert |
CANSLIM.net Company Profile |
SEC
News |
Chart |
Request a new note
C
A N
S L
I M
|
ALXN
-
NASDAQ
Alexion Pharmaceuticals
DRUGS - Drug Manufacturers - Other
|
$189.89
|
-1.41
-0.74% |
$197.64
|
1,053,225
87.19% of 50 DAV
50 DAV is 1,208,000
|
$197.23
-3.72%
|
10/23/2014
|
$184.01
|
PP = $185.53
|
|
MB = $194.81
|
Most Recent Note - 11/3/2014 6:11:03 PM
Y - Holding its ground at its 52-week high volume totals cooling. Prior highs in the $180 area define initial support to watch on pullbacks.
>>> FEATURED STOCK ARTICLE : Finished Strong After Gapping Up Above Prior High - 10/23/2014
View all notes |
Set NEW NOTE alert |
CANSLIM.net Company Profile |
SEC
News |
Chart |
Request a new note
C
A N
S L
I M
|
BIDU
-
NASDAQ
Baidu Inc Ads
INTERNET - Internet Information Providers
|
$237.70
|
-4.26
-1.76% |
$246.00
|
4,546,956
121.67% of 50 DAV
50 DAV is 3,737,000
|
$242.62
-2.03%
|
10/30/2014
|
$234.08
|
PP = $231.51
|
|
MB = $243.09
|
Most Recent Note - 11/4/2014 5:43:47 PM
Y - Gain today on lighter volume for a best-ever close but still finished below its "max buy" level. Prior highs near $230 define near-term support to watch on pullbacks.
>>> FEATURED STOCK ARTICLE : Technical Breakout on Triple Average Volume Following Strong Earnings - 10/30/2014
View all notes |
Set NEW NOTE alert |
CANSLIM.net Company Profile |
SEC
News |
Chart |
Request a new note
C
A N
S L
I M
|
EPAM
-
NYSE
Epam Systems Inc
COMPUTER SOFTWARE and SERVICES - Information Technology Service
|
$48.25
|
+1.64
3.52% |
$50.00
|
535,190
126.52% of 50 DAV
50 DAV is 423,000
|
$49.94
-3.38%
|
10/23/2014
|
$45.21
|
PP = $46.09
|
|
MB = $48.39
|
Most Recent Note - 11/5/2014 1:45:06 PM
Y - Poised for a best-ever close with today's big gain. Found prompt support on the prior session after briefly undercutting prior highs in the $44 area. The latest FSU analysis (10/24/14) reminded members - "Keep in mind that the high-ranked Computer - Tech Services firm is due to report earnings for the Sep '14 quarter on 11/04/14. Volume and volatility often increase near earnings news."
>>> FEATURED STOCK ARTICLE : Pulled Back After Challenging Prior Highs - 10/24/2014
View all notes |
Set NEW NOTE alert |
CANSLIM.net Company Profile |
SEC
News |
Chart |
Request a new note
C
A N
S L
I M
|
Symbol/Exchange
Company Name
Industry Group |
PRICE |
CHANGE
(%Change) |
Day High |
Volume
(% DAV)
(% 50 day avg vol) |
52 Wk Hi
% From Hi |
Featured
Date |
Price
Featured |
Pivot Featured |
|
Max Buy |
FB
-
NASDAQ
Facebook Inc Cl A
INTERNET
|
$74.83
|
-0.93
-1.23% |
$76.80
|
35,868,097
89.97% of 50 DAV
50 DAV is 39,865,000
|
$81.16
-7.80%
|
9/9/2014
|
$76.67
|
PP = $76.84
|
|
MB = $80.68
|
Most Recent Note - 11/5/2014 1:52:48 PM
G - Encountering resistance at its 50 DMA line following a violation on 3 times average volume on 10/29/14 that raised concerns and triggered a technical sell signal. Volume and volatility often increase near earnings news. The company reported earnings +59% on +59% sales for the Sep '14 quarter but warned of rising costs. Historic studies show that investors have a far better chance of success when buying as a stock is breaking out, not buying on pullbacks.
>>> FEATURED STOCK ARTICLE : Gapped Down Following Latest Strong Earnings Report - 10/29/2014
View all notes |
Set NEW NOTE alert |
CANSLIM.net Company Profile |
SEC
News |
Chart |
Request a new note
C
A N
S L
I M
|
FLT
-
NYSE
Fleetcor Technologies
DIVERSIFIED SERVICES - Business/Management Services
|
$148.51
|
-0.02
-0.01% |
$151.01
|
506,369
70.92% of 50 DAV
50 DAV is 714,000
|
$153.52
-3.26%
|
10/31/2014
|
$148.50
|
PP = $146.29
|
|
MB = $153.60
|
Most Recent Note - 11/5/2014 1:57:22 PM
Y - Holding its ground after volume-driven gains for new 52-week highs. Finished strong after highlighted in yellow in the 10/31/14 mid-day report (read here) clinching a convincing technical buy signal. Disciplined investors avoid chasing stocks more than +5% above prior highs and always limit losses by selling any stock that falls more than -7% from their purchase price.
>>> FEATURED STOCK ARTICLE : Strong Finish Following Gap Up After Earnings News - 10/31/2014
View all notes |
Set NEW NOTE alert |
CANSLIM.net Company Profile |
SEC
News |
Chart |
Request a new note
C
A N
S L
I M
|
ILMN
-
NASDAQ
Illumina Inc
DRUGS - Biotechnology
|
$186.37
|
-5.04
-2.63% |
$194.13
|
1,125,625
89.05% of 50 DAV
50 DAV is 1,264,000
|
$197.37
-5.57%
|
10/22/2014
|
$188.77
|
PP = $182.27
|
|
MB = $191.38
|
Most Recent Note - 11/5/2014 2:00:36 PM
Y - Volume totals have been cooling while consolidating and its color code is changed to yellow after dipping below its "max buy" level. Prior highs near $182 define near-term support to watch on pullbacks.
>>> FEATURED STOCK ARTICLE : Breakout Cleared "Double Bottom" Base Pattern - 10/22/2014
View all notes |
Set NEW NOTE alert |
CANSLIM.net Company Profile |
SEC
News |
Chart |
Request a new note
C
A N
S L
I M
|
NBCB
-
NASDAQ
First N B C Bank Hldg
Banks-Southeast
|
$36.98
|
-0.34
-0.91% |
$37.63
|
90,376
100.42% of 50 DAV
50 DAV is 90,000
|
$37.83
-2.25%
|
10/31/2014
|
$36.31
|
PP = $35.93
|
|
MB = $37.73
|
Most Recent Note - 11/5/2014 6:30:11 PM
Y - Pulled back today on higher (near average) volume following 8 consecutive gains. No resistance remains due to overhead supply. Highlighted in yellow in the 10/31/14 mid-day report (read here). Prior highs near $34 define near-term support to watch on pullbacks.
>>> FEATURED STOCK ARTICLE : Financial Firm at 52-Week High Tallied 8th Consecutive Gain - 11/3/2014
View all notes |
Set NEW NOTE alert |
CANSLIM.net Company Profile |
SEC
News |
Chart |
Request a new note
C
A N
S L
I M
|
PANW
-
NYSE
Palo Alto Networks
Computer Sftwr-Security
|
$102.52
|
-4.19
-3.93% |
$107.25
|
1,699,649
73.87% of 50 DAV
50 DAV is 2,301,000
|
$108.50
-5.51%
|
7/30/2014
|
$84.21
|
PP = $85.88
|
|
MB = $90.17
|
Most Recent Note - 11/5/2014 6:26:10 PM
G - Finished near the session low with a loss today on higher but below average volume. Its 50 DMA line ($98.05) defines near-term support to watch.
>>> FEATURED STOCK ARTICLE : Rebound and Rally Leaves Tech Firm Extended From Base - 10/28/2014
View all notes |
Set NEW NOTE alert |
CANSLIM.net Company Profile |
SEC
News |
Chart |
Request a new note
C
A N
S L
I M
|
Symbol/Exchange
Company Name
Industry Group |
PRICE |
CHANGE
(%Change) |
Day High |
Volume
(% DAV)
(% 50 day avg vol) |
52 Wk Hi
% From Hi |
Featured
Date |
Price
Featured |
Pivot Featured |
|
Max Buy |
SNCR
-
NASDAQ
Synchronoss Technologies
COMPUTER SOFTWARE andamp; SERVICES - Application Software
|
$50.53
|
-0.27
-0.53% |
$51.86
|
615,346
117.21% of 50 DAV
50 DAV is 525,000
|
$53.47
-5.50%
|
10/27/2014
|
$46.40
|
PP = $47.81
|
|
MB = $50.20
|
Most Recent Note - 11/5/2014 2:01:58 PM
G - Consolidating above the "max buy" level cited. Prior highs in the $47 area define initial support to watch on pullbacks. Considerable gain on 10/28/14 was backed by more than 4 times average volume after reporting earnings +35% on +40% sales revenues for the Sep '14 quarter.
>>> FEATURED STOCK ARTICLE : No Resistance Remains; Perched at Secondary Buy Point - 10/27/2014
View all notes |
Set NEW NOTE alert |
CANSLIM.net Company Profile |
SEC
News |
Chart |
Request a new note
C
A N
S L
I M
|
STRT
-
NASDAQ
Strattec Security Corp
AUTOMOTIVE - Auto Parts
|
$104.81
|
+2.16
2.10% |
$106.40
|
26,449
94.46% of 50 DAV
50 DAV is 28,000
|
$109.44
-4.23%
|
9/19/2014
|
$86.06
|
PP = $89.97
|
|
MB = $94.47
|
Most Recent Note - 11/4/2014 5:45:39 PM
G - Hovering near its 52-week high, extended from its prior base after volume-driven gains. Prior highs in the $88 area define important near-term support to watch above its 50 DMA line. See the latest FSU analysis for more details and new annotated graphs.
>>> FEATURED STOCK ARTICLE : Stock With Small Supply Quickly Got Extended From Prior Base - 11/4/2014
View all notes |
Set NEW NOTE alert |
CANSLIM.net Company Profile |
SEC
News |
Chart |
Request a new note
C
A N
S L
I M
|
|
|
|
THESE ARE NOT BUY RECOMMENDATIONS!
Comments contained in the body of this report are technical
opinions only. The material herein has been obtained
from sources believed to be reliable and accurate, however,
its accuracy and completeness cannot be guaranteed.
This site is not an investment advisor, hence it does
not endorse or recommend any securities or other investments.
Any recommendation contained in this report may not
be suitable for all investors and it is not to be deemed
an offer or solicitation on our part with respect to
the purchase or sale of any securities. All trademarks,
service marks and trade names appearing in this report
are the property of their respective owners, and are
likewise used for identification purposes only.
This report is a service available
only to active Paid Premium Members.
You may opt-out of receiving report notifications
at any time. Questions or comments may be submitted
by writing to Premium Membership Services 665 S.E. 10 Street, Suite 201 Deerfield Beach, FL 33441-5634 or by calling 1-800-965-8307
or 954-785-1121.
|
|
|

