You are not logged in.
This means you
CAN ONLY VIEW reports that were published prior to Monday, March 10, 2025.
You
MUST UPGRADE YOUR MEMBERSHIP if you want to see any current reports.
AFTER MARKET UPDATE - TUESDAY, NOVEMBER 3RD, 2009
Previous After Market Report Next After Market Report >>>
|
|
|
|
DOW |
-17.53 |
9,771.91 |
-0.18% |
|
Volume |
1,380,281,320 |
-11% |
|
Volume |
2,207,641,210 |
-9% |
|
NASDAQ |
+8.12 |
2,057.32 |
+0.40% |
|
Advancers |
1,844 |
59% |
|
Advancers |
1,643 |
58% |
|
S&P 500 |
+2.53 |
1,045.41 |
+0.24% |
|
Decliners |
1,181 |
38% |
|
Decliners |
1,094 |
38% |
|
Russell 2000 |
+8.22 |
570.62 |
+1.46% |
|
52 Wk Highs |
35 |
|
|
52 Wk Highs |
27 |
|
|
S&P 600 |
+3.98 |
302.67 |
+1.33% |
|
52 Wk Lows |
10 |
|
|
52 Wk Lows |
35 |
|
|
 |
Lighter Volume Gains For Stocks While Gold Futures Spike To New Record High
Adam Sarhan, Contributing Writer,
Except for the Dow Jones Industrial Average's minor loss all of the major averages ended higher while the US dollar advanced. The positive bias was in part attributed to the latest round of multi-billion dollar mergers and acquisitions. For the second straight day, volume was reported lower than the prior session on the NYSE and Nasdaq exchange, indicating that large institutional investors were not aggressively buying stocks as the indices rose. Advancers led decliners by about a 3-to-2 ratio on the NYSE and on the Nasdaq exchange. There were only 10 high-ranked companies from the CANSLIM.net Leaders List making a new 52-week high and appearing on the CANSLIM.net BreakOuts Page, better than the 4 issue that appeared on the prior session. In terms of new leadership, the recent action is a sign that there is none showing up. New 52-week highs still outnumbered new 52-week lows on the NYSE, however new lows outnumbered new highs on Nasdaq exchange for a fourth consecutive day.
Before Tuesday's open, Warren Buffett announced his plans to buy Burlington Northern Santa Fe Corp. (BNI +27.51%) for a $44 billion cash and stock deal which is his largest buy-out ever. Meanwhile, Stanley Works (SWK +10.06%) said it will take over Black & Decker Corp. (BDK +30.97%) which sent both stocks higher. Burlington Northern gapped up and surged +28% after Buffett made his “all-in wager” on the nation’s economic future. Buffett said that his purchase was a bet on the US economy and was optimistic about the future.
Late Monday night, the International Monetary Fund (IMF) reported that it sold 200 metric tons of gold to the Bank of India. This alleviated a major amount of overhead supply and helped send gold futures surging to a fresh all-time high. Elsewhere, the Federal Reserve Board began its two-day meeting for monetary policy, and will announce their decision Wednesday afternoon. Tuesday marked Day 2 of a new rally attempt which means that, as long as Monday's lows are not breached, the earliest a possible follow-through day could emerge is Thursday. It is a negative sign that volume has receded during the last two days and the S&P 500 failed to trade back above its 50 DMA line. It is also worrisome to see the action in most leading stocks continues to be questionable.
PICTURED: The S&P 500 Index posted a gain on lighter volume while consolidating, closing about 8 points below its 50-day moving average (DMA) line.
|
|
|
 |
XAU Above 50-Day Average While Financials Still Below
Kenneth J. Gruneisen - Passed the CAN SLIM® Master's Exam
Tuesday's was a good day for defensive groups, and the Gold & Silver Index ($XAU +6.38%) was a standout gainer. Energy-related shares were on the rise as the Oil Services Index ($OSX +2.92%) outpaced the Integrated Oil Index ($XOI +1.12%). The Healthcare Index ($HMO +1.33%) also posted a gain. The Biotechnology Index ($BTK +3.46%) was also a standout gainer, easily outpacing the Networking Index ($NWX +0.98%) and the Internet Index ($IIX +0.66%). There was very little change on the session for the Retail Index ($RLX -0.10%) and the Bank Index ($BKX +0.02%), yet the Broker/Dealer Index ($XBD +0.80%) produced a modest gain. Both financial indexes remain trading below their respective 50-day moving average (DMA) lines, meanwhile the Retail Index is currently testing support at its short-term average.
Charts courtesy www.stockcharts.com
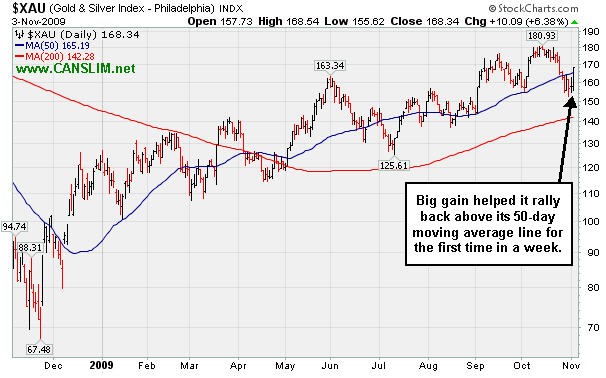
PICTURED 1: The Gold & Silver Index ($XAU +6.38%) was a standout gainer. The big gain helped it rally back above its 50-day moving average line for the first time in a week.
Charts courtesy www.stockcharts.com
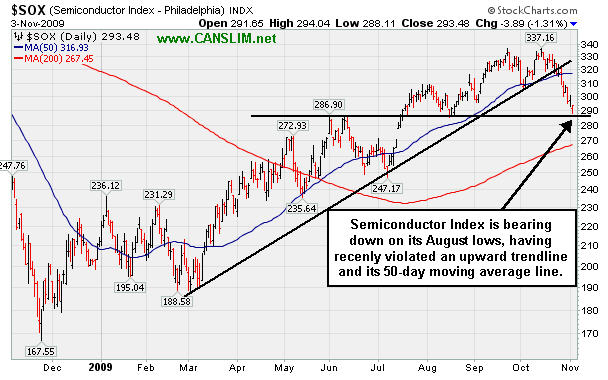
PICTURED 2: The Semiconductor Index ($SOX -1.31%) is bearing down on its August lows, having recently violated its upward trendline and its 50-day moving average line.
| Oil Services |
$OSX |
194.06 |
+5.51 |
+2.92% |
+59.86% |
| Healthcare |
$HMO |
1,171.50 |
+15.37 |
+1.33% |
+22.01% |
| Integrated Oil |
$XOI |
1,069.95 |
+11.90 |
+1.12% |
+9.21% |
| Semiconductor |
$SOX |
293.48 |
-3.89 |
-1.31% |
+38.32% |
| Networking |
$NWX |
220.46 |
+2.13 |
+0.98% |
+53.21% |
| Internet |
$IIX |
213.30 |
+1.39 |
+0.66% |
+59.45% |
| Broker/Dealer |
$XBD |
112.67 |
+0.89 |
+0.80% |
+45.44% |
| Retail |
$RLX |
383.29 |
-0.38 |
-0.10% |
+37.25% |
| Gold & Silver |
$XAU |
168.34 |
+10.09 |
+6.38% |
+35.92% |
| Bank |
$BKX |
42.62 |
+0.01 |
+0.02% |
-3.84% |
| Biotech |
$BTK |
874.27 |
+29.24 |
+3.46% |
+35.09% |
|
|
|
 |
Prior Chart Highs Being Put To Test As Support
Kenneth J. Gruneisen - Passed the CAN SLIM® Master's Exam
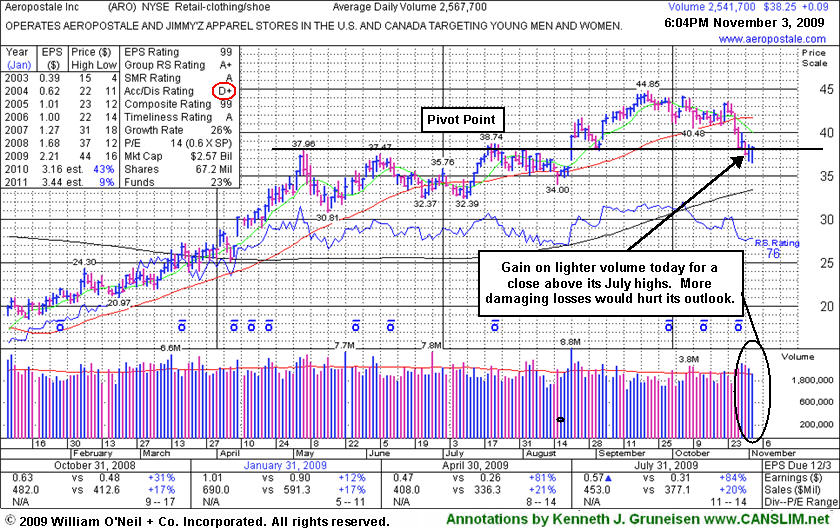
Aeropostale Inc. (ARO +$0.09 or +0.24% to $38.25) posted a small gain today with lighter volume, overcoming a weak start for a second positive reversal in a row. It also closed back above its July 20th high close, which is a somewhat encouraging sign. Last week's serious 50-day moving average (DMA) line violation led to previously noted technical sell signals. It essentially negated its 8/21/09 technical breakout with a close below July's highest close (its highest pre-breakout close), while it is currently trading near its prior highs in the $38 area which have been identified as important support. More damaging losses would hurt its outlook.
This high-ranked leader in the Retail - Clothing/shoe group has encountered some very obvious distributional pressure in recent weeks. Its Accumulation/Distribution rank (see red circle on left) has slumped to a D+ from a B- on October 6th. Its Relative Strength rank also fell to 76 from 84 over that same time frame, indicating its relative under-performance in recent weeks. ARO was featured in yellow with new pivot point and max buy levels noted in the 8/21/09 Mid-Day BreakOuts Report (read here). It has a great annual earnings history (the A criteria), and the 2 latest quarterly comparisons showed +81% and +84% earnings increases, well above the investment system's +25% guideline. The number of top-rated funds owning an interest in its shares rose from 207 in Dec '08 to 237 in Jun '09, which is good news concerning the I criteria.
|
|
|
Color Codes Explained :
Y - Better candidates highlighted by our
staff of experts.
G - Previously featured
in past reports as yellow but may no longer be buyable under the
guidelines.
***Last / Change / Volume quote data in this table corresponds with the timestamp on the note***
Symbol/Exchange
Company Name
Industry Group |
Last |
Chg. |
Vol
% DAV |
Date Featured |
Price Featured |
Latest Pivot Point
Featured |
Status |
| Latest Max Buy Price |
ARO
- NYSE
Aeropostale Inc
RETAIL - Apparel Stores
|
$38.25
|
+0.09
|
2,546,030
98% DAV
2,609,200
|
8/21/2009
(Date
Featured) |
$39.21
(Price
Featured) |
PP = $44.95 |
G |
| MB = $47.20 |
Most Recent Note - 11/3/2009 5:46:56 PM
G - Overcame a weak start today for a second positive reversal in a row, and it closed back above its July 20th high close. Last week's previously noted technical sell signals and deterioration negated its 8/21/09 technical breakout with a close below July's highest close (its highest pre-breakout close).
>>> The latest Featured Stock Update with an annotated graph appeared on 11/3/2009. click here.
|
|
C
A
S
I |
News |
Chart |
SEC
View all notes Alert
me of new notes
Company
Profile
|
ARST
-
|
$24.29
|
-0.02
|
237,028
35% DAV
670,900
|
9/1/2009
(Date
Featured) |
$19.91
(Price
Featured) |
PP = $20.90 |
G |
| MB = $21.95 |
Most Recent Note - 11/3/2009 5:48:30 PM
G - Down on very light volume today, consolidating in a tight trading range above its 50 DMA line and near all-time highs. ARST traded up more than +30% since it was first featured in yellow at $19.91 in the 9/01/09 mid-day report with an annotated daily graph (read here).
>>> The latest Featured Stock Update with an annotated graph appeared on 10/21/2009. click here.
|
|
C
A
S
I |
News |
Chart |
SEC
View all notes Alert
me of new notes
Company
Profile
|
ASIA
-
|
$22.13
|
-0.36
|
741,460
92% DAV
805,700
|
10/14/2009
(Date
Featured) |
$23.05
(Price
Featured) |
PP = $22.19 |
Y |
| MB = $23.30 |
Most Recent Note - 11/3/2009 5:50:01 PM
Y - Quietly consolidating since the 10/29/09 big gap up on solid earnings and raised guidance. It found prompt support near its 50 DMA line (a textbook chart support level) after a 7 session losing streak with losses on high volume briefly negated its latest breakout. Color code was changed to yellow based on impressive fundamentals and technical strength, however market conditions (M criteria) are a concern until a new follow-through-day occurs. Featured 10/14/09 in the mid-day report (read here) as it gapped up for a new 52-week high with 5 times average volume, triggering a technical buy signal by blasting above its pivot point. First featured in the August 2009 CANSLIM.net News (read here).
>>> The latest Featured Stock Update with an annotated graph appeared on 10/30/2009. click here.
|
|
C
A
S
I |
News |
Chart |
SEC
View all notes Alert
me of new notes
Company
Profile
|
BIDU
- NASDAQ
Baidu Inc Ads
INTERNET - Internet Information Providers
|
$383.04
|
+7.59
|
1,436,686
74% DAV
1,932,400
|
9/8/2009
(Date
Featured) |
$351.80
(Price
Featured) |
PP = $368.59 |
G |
| MB = $387.02 |
Most Recent Note - 11/3/2009 5:51:02 PM
G - Gain on light volume today, still closing below its 50 DMA line. Volume spiked to 5 times normal on 10/27/09 as it gapped down for a considerable loss following its latest earnings report. As recently noted, "Choppy action has not allowed it to form a sound base in recent weeks." BIDU traded up as much as +23% from its price when featured in yellow in the 9/08/09 Mid-Day BreakOuts Report (read here).
>>> The latest Featured Stock Update with an annotated graph appeared on 10/28/2009. click here.
|
|
C
A
S
I |
News |
Chart |
SEC
View all notes Alert
me of new notes
Company
Profile
|
CACC
- NASDAQ
Credit Acceptance Corp
FINANCIAL SERVICES - Credit Services
|
$34.61
|
-0.13
|
19,891
52% DAV
38,200
|
9/29/2009
(Date
Featured) |
$33.48
(Price
Featured) |
PP = $32.60 |
G |
| MB = $34.23 |
Most Recent Note - 11/3/2009 5:52:52 PM
G - Small loss on light volume today after an impressive positive reversal on the prior session. Market conditions (M criteria) are an overriding concern suggesting that investors hold off on any new buying efforts until a new rally with follow through day occurs. Prior chart highs and its 50 DMA line coincide in the $32 area, an important level to watch on pullbacks. The Finance - Consumer/Commercial Loans firm has maintained a great track record of annual and quarterly sales revenues and earnings increases. It was featured on 9/29/09 in yellow in the mid-day report (read here).
>>> The latest Featured Stock Update with an annotated graph appeared on 10/15/2009. click here.
|
|
C
A
S
I |
News |
Chart |
SEC
View all notes Alert
me of new notes
Company
Profile
|
CRM
- NYSE
Salesforce.com Inc
INTERNET - Internet Software & Services
|
$58.59
|
+0.78
|
1,326,538
66% DAV
2,012,800
|
8/16/2009
(Date
Featured) |
$47.12
(Price
Featured) |
PP = $45.59 |
G |
| MB = $47.87 |
Most Recent Note - 11/3/2009 5:54:42 PM
G - For a second consecutive session it overcame early weakness and closed just above its 50 DMA line, while today's volume total was lighter. Deterioration last week led to technical sell signals as it violated prior chart highs in the $59 area and an upward trendline connecting its July, August and October chart lows.
>>> The latest Featured Stock Update with an annotated graph appeared on 10/27/2009. click here.
|
|
C
A
S
I |
News |
Chart |
SEC
View all notes Alert
me of new notes
Company
Profile
|
EBIX
- NASDAQ
Ebix Inc
COMPUTER SOFTWARE & SERVICES - Business Software & Services
|
$58.43
|
-1.69
|
566,931
253% DAV
223,700
|
8/28/2009
(Date
Featured) |
$45.86
(Price
Featured) |
PP = $45.35 |
G |
| MB = $47.62 |
Most Recent Note - 11/3/2009 5:56:23 PM
G - Another loss on even higher volume today continues its consolidation. Previously noted its negative reversal from all-time highs on 10/26/09, followed by more worrisome distributional pressure. It is still well above prior chart highs and its 50 DMA line coinciding in the $54 area, the next important support level to watch.
>>> The latest Featured Stock Update with an annotated graph appeared on 11/2/2009. click here.
|
|
C
A
S
I |
News |
Chart |
SEC
View all notes Alert
me of new notes
Company
Profile
|
GMCR
- NASDAQ
Green Mtn Coffee Roastrs
FOOD & BEVERAGE - Processed & Packaged Goods
|
$68.75
|
+1.80
|
1,406,392
116% DAV
1,213,500
|
10/5/2009
(Date
Featured) |
$71.11
(Price
Featured) |
PP = $75.89 |
G |
| MB = $79.68 |
Most Recent Note - 11/3/2009 5:57:17 PM
G - Gain on slightly above average volume today, closing just above its 50 DMA line ($67.50) which was previously noted as an important support level to watch. Technically, it has also been hovering the past few session near an upward trendline connecting its March-September lows. Further deterioration would raise more concerns that its previously strong uptrend has gone cold.
>>> The latest Featured Stock Update with an annotated graph appeared on 10/29/2009. click here.
|
|
C
A
S
I |
News |
Chart |
SEC
View all notes Alert
me of new notes
Company
Profile
|
PEGA
- NASDAQ
Pegasystems Inc
COMPUTER SOFTWARE & SERVICES - Business Software & Services
|
$28.62
|
+0.44
|
435,301
137% DAV
318,600
|
9/9/2009
(Date
Featured) |
$31.14
(Price
Featured) |
PP = $33.35 |
G |
| MB = $35.02 |
Most Recent Note - 11/3/2009 6:00:11 PM
G - Its June-July highs, which were once resistance in the $27 area, are now being put to the test as a chart support level. Additional damaging losses would hurt its outlook.
>>> The latest Featured Stock Update with an annotated graph appeared on 10/23/2009. click here.
|
|
C
A
S
I |
News |
Chart |
SEC
View all notes Alert
me of new notes
Company
Profile
|
|
|
|
THESE ARE NOT BUY RECOMMENDATIONS!
Comments contained in the body of this report are technical
opinions only. The material herein has been obtained
from sources believed to be reliable and accurate, however,
its accuracy and completeness cannot be guaranteed.
This site is not an investment advisor, hence it does
not endorse or recommend any securities or other investments.
Any recommendation contained in this report may not
be suitable for all investors and it is not to be deemed
an offer or solicitation on our part with respect to
the purchase or sale of any securities. All trademarks,
service marks and trade names appearing in this report
are the property of their respective owners, and are
likewise used for identification purposes only.
This report is a service available
only to active Paid Premium Members.
You may opt-out of receiving report notifications
at any time. Questions or comments may be submitted
by writing to Premium Membership Services 665 S.E. 10 Street, Suite 201 Deerfield Beach, FL 33441-5634 or by calling 1-800-965-8307
or 954-785-1121.
|
|
|


