You are not logged in.
This means you
CAN ONLY VIEW reports that were published prior to Monday, March 10, 2025.
You
MUST UPGRADE YOUR MEMBERSHIP if you want to see any current reports.
AFTER MARKET UPDATE - MONDAY, NOVEMBER 2ND, 2009
Previous After Market Report Next After Market Report >>>
|
|
|
|
DOW |
+76.71 |
9,789.44 |
+0.79% |
|
Volume |
1,545,341,290 |
-7% |
|
Volume |
2,430,932,100 |
-15% |
|
NASDAQ |
+4.09 |
2,049.20 |
+0.20% |
|
Advancers |
1,625 |
52% |
|
Advancers |
1,314 |
46% |
|
S&P 500 |
+6.69 |
1,042.88 |
+0.65% |
|
Decliners |
1,413 |
45% |
|
Decliners |
1,427 |
50% |
|
Russell 2000 |
-0.37 |
562.40 |
-0.07% |
|
52 Wk Highs |
26 |
|
|
52 Wk Highs |
17 |
|
|
S&P 600 |
-0.38 |
298.69 |
-0.13% |
|
52 Wk Lows |
13 |
|
|
52 Wk Lows |
46 |
|
|
 |
Rally Attempt Starts With Mixed Breadth And Lighter Volume
Adam Sarhan, Contributing Writer,
The major US averages marked Day 1 of a new rally attempt as they squeezed out a nominal gain on Monday after investors digested the latest flurry of economic and earnings data. Volume was reported lower on the NYSE and Nasdaq exchange, indicating that large institutional investors were not aggressively buying stocks while the indices advanced. Advancers led decliners by a narrow margin on the NYSE but trailed by narrow margin on the Nasdaq exchange. There were only 4 high-ranked companies from the CANSLIM.net Leaders List making a new 52-week high and appearing on the CANSLIM.net BreakOuts Page, just better than the 3 issue that appeared on the prior session. In terms of new leadership, the recent action is a sign that there is none showing up. New 52-week highs still outnumbered new 52-week lows on the NYSE, however new lows outnumbered new highs on Nasdaq exchange for a third consecutive day.
Over the weekend, troubled lender C I T Group (CIT -65.28%) filed for Chapter 11 bankruptcy protection after failing to secure financing. The stock gapped down on massive volume and closed near its lows as investors scrambled to unload shares. However, it was somewhat encouraging to see the major averages end higher on Monday in the face of that bad news, helped by positive economic data and a strong earnings report from Ford Motor (F +8.29%). The troubled car maker reported its first quarterly profit in more than two years which helped its shares gap above its 50-day moving average (DMA) line.
On the economic front, investors cheered after key manufacturing and home sales and construction spending exceeded analysts estimates. The Institute for Supply Management (ISM) said its factory index rose to 55.7 in October as US manufacturing grew by its fastest pace in more than 3 years! Remember that a weaker US dollar helps exporters sell their goods since dollar denominated assets become "cheaper" for foreigners. The Commerce Department said construction spending unexpectedly rose +0.8% in September which suggested an uptick in spending. Elsewhere, the National Association of Realtors said signed purchase agreements for homes grew by +6.1% as the housing market continues to make its way out of the worst housing collapse in several generations!
Monday marked Day 1 of a new rally attempt which means that as long as Monday's lows are not breached this rally-attempt remains intact, and the earliest a possible follow-through day could occur is this Thursday. However, if at any point, Monday's lows are taken out, then the day count will be reset. Remember that last week the market slid into a correction as the major averages sliced below support (50 DMA lines and 7-month upward trendlines). Defense is the best offense until a new healthy follow-through day is produced.
PICTURED: Monday marked Day 1 of a new rally attempt. The blue chip Dow Jones Industrial Average rallied up from its latest test of its 50 DMA line. Subsequent deterioration to new lows below that important short-term average would not bode well for the overall market outlook.
|
|
|
 |
Defensive Groups and Biotech Index Lead Gainers
Kenneth J. Gruneisen - Passed the CAN SLIM® Master's Exam
Defensive groups were among Monday's best gainers as the Healthcare Index ($HMO +1.02%) and Gold & Silver Index ($XAU +1.03%) rose, and modest gains in the energy group helped the Integrated Oil Index ($XOI +0.50%) and Oil Services Index ($OSX +0.67%) end higher. Other positive influences included the Retail Index ($RLX +0.86%) and the Bank Index ($BKX +0.90%), meanwhile the Broker/Dealer Index ($XBD -0.06%) failed to follow along. The tech sector was mostly quiet as the Semiconductor Index ($SOX +0.26%) posted a tiny gain, the Networking Index ($NWX +0.01%) held steady, and the Internet Index ($IIX -0.20%) inched lower.
Charts courtesy www.stockcharts.com
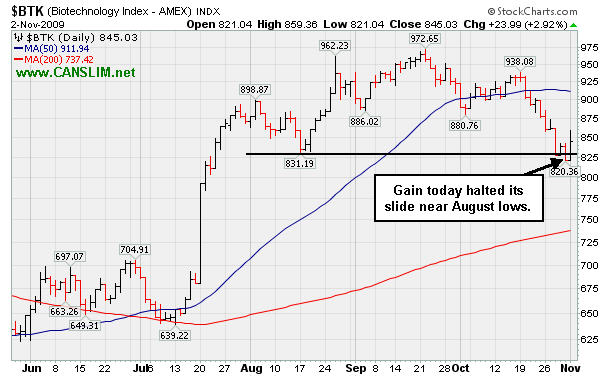
PICTURED: The Biotechnology Index ($BTK +2.92%) was a standout gainer after Human Genome Sciences Inc. (HGSI +35.28%) reported positive data on a lupus drug. Amylin Pharmaceuticals, Inc. (AMLN +9.87%) and Vertex Pharmaceuticals Incorporated (VRTX +7.72%) were also among the group's top gainers. However, none of the above mentioned companies has the fundamentals (earnings history) to be included on the watchlist as a serious buy candidate for any strict followers using the investment system.
| Oil Services |
$OSX |
188.55 |
+1.25 |
+0.67% |
+55.33% |
| Healthcare |
$HMO |
1,156.13 |
+11.65 |
+1.02% |
+20.41% |
| Integrated Oil |
$XOI |
1,058.05 |
+5.25 |
+0.50% |
+8.00% |
| Semiconductor |
$SOX |
297.37 |
+0.76 |
+0.26% |
+40.16% |
| Networking |
$NWX |
218.33 |
+0.03 |
+0.01% |
+51.73% |
| Internet |
$IIX |
211.91 |
-0.43 |
-0.20% |
+58.41% |
| Broker/Dealer |
$XBD |
111.78 |
-0.07 |
-0.06% |
+44.29% |
| Retail |
$RLX |
383.67 |
+3.28 |
+0.86% |
+37.39% |
| Gold & Silver |
$XAU |
158.25 |
+1.61 |
+1.03% |
+27.78% |
| Bank |
$BKX |
42.61 |
+0.38 |
+0.90% |
-3.86% |
| Biotech |
$BTK |
845.03 |
+23.99 |
+2.92% |
+30.57% |
|
|
|
 |
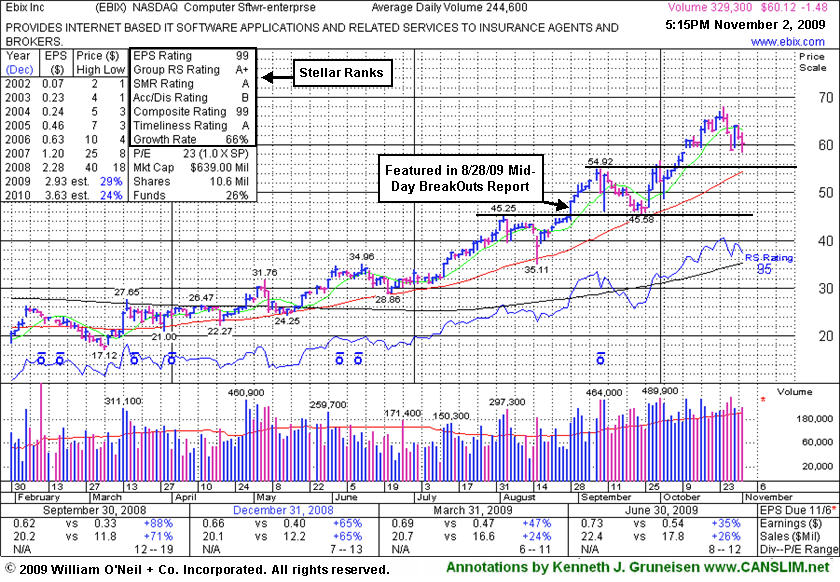
50 DMA and Prior Chart Highs Coincide Near $54 As Next Support Level
Kenneth J. Gruneisen - Passed the CAN SLIM® Master's Exam
Ebix Inc (EBIX -$1.48 or -2.46% to $60.12) ended lower today on slightly higher volume, continuing its consolidation that began with the previously noted negative reversal from all-time highs on 10/26/09, followed by more worrisome distributional pressure. It is still well above prior chart highs and its 50-day moving average (DMA) line coinciding in the $54 area, the next important support level to watch. Since its last appearance on 10/13/09 under the headline "Computer Software Firm Is Extended From Latest Base it went on rallying to get even more extended, trading as much as +48% above its price when featured at $45.86 in yellow in the 8/28/09 CANSLIM.net Mid-Day BreakOuts Report (read here) as it was reaching a new all-time high. Prior to that, it formed the big cup-with-high-handle shaped pattern (finding great support at its 50 DMA line) since weak action prompted it to be dropped from the Featured Stocks list on 10/07/08. As shown in the annotated graph below, earnings increases in quarterly comparisons have been strong and above the +25% guideline, but previously noted earnings deceleration is of some concern. It is preferred when earnings growth is strong and accelerating, not losing steam.
EBIX had traded up more than +59% after it was first featured in the March 2008 CANSLIM.net News (read here). At that time its average daily volume was only 4,900 shares, whereas today its average volume is at 244,600 shares. Today there are 10.6 million shares (the S criteria) in the public float, so its share price still could be very volatile in the event of heavy institutional buying or selling. The number of top-rated funds owning an interest in its shares rose from 31 in Dec '08 to 58 in Jun '09, which is a good sign concerning the I criteria of the investment system. Return on Equity is now reported at +42%, well above the +17% guideline. Do not be confused by the 3:1 split that took effect on 10/09/08.
|
|
|
Color Codes Explained :
Y - Better candidates highlighted by our
staff of experts.
G - Previously featured
in past reports as yellow but may no longer be buyable under the
guidelines.
***Last / Change / Volume quote data in this table corresponds with the timestamp on the note***
Symbol/Exchange
Company Name
Industry Group |
Last |
Chg. |
Vol
% DAV |
Date Featured |
Price Featured |
Latest Pivot Point
Featured |
Status |
| Latest Max Buy Price |
ARO
- NYSE
Aeropostale Inc
RETAIL - Apparel Stores
|
$38.16
|
+0.63
|
3,248,029
124% DAV
2,609,200
|
8/21/2009
(Date
Featured) |
$39.21
(Price
Featured) |
PP = $44.95 |
G |
| MB = $47.20 |
Most Recent Note - 11/2/2009 4:27:48 PM
G - Overcame a weak start for a positive reversal today, yet it still closed under its July 20th high close. Last week's previously noted technical sell signals and deterioration negated its 8/21/09 technical breakout with a close below July's highest close (its highest pre-breakout close).
>>> The latest Featured Stock Update with an annotated graph appeared on 10/22/2009. click here.
|
|
C
A
S
I |
News |
Chart |
SEC
View all notes Alert
me of new notes
Company
Profile
|
ARST
-
|
$24.31
|
-0.41
|
464,996
69% DAV
670,900
|
9/1/2009
(Date
Featured) |
$19.91
(Price
Featured) |
PP = $20.90 |
G |
| MB = $21.95 |
Most Recent Note - 11/2/2009 4:36:47 PM
G - Down on lighter volume today for a second consecutive session, consolidating above its 50 DMA line near all-time highs. ARST traded up more than +30% since it was first featured in yellow at $19.91 in the 9/01/09 mid-day report with an annotated daily graph (read here).
>>> The latest Featured Stock Update with an annotated graph appeared on 10/21/2009. click here.
|
|
C
A
S
I |
News |
Chart |
SEC
View all notes Alert
me of new notes
Company
Profile
|
ASIA
-
|
$22.49
|
+0.43
|
1,065,873
132% DAV
805,700
|
10/14/2009
(Date
Featured) |
$23.05
(Price
Featured) |
PP = $22.19 |
Y |
| MB = $23.30 |
Most Recent Note - 11/2/2009 4:48:56 PM
Y - Gain today while consolidating after a 10/29/09 gap up on solid earnings and raised guidance. It found prompt support near its 50 DMA line (a textbook chart support level) after a 7 session losing streak with losses on high volume briefly negated its latest breakout. Color code was changed to yellow based on impressive fundamentals and technical strength, however market conditions (M criteria) are a concern until a new follow-through-day occurs. Featured 10/14/09 in the mid-day report (read here) as it gapped up for a new 52-week high with 5 times average volume, triggering a technical buy signal by blasting above its pivot point. First featured in the August 2009 CANSLIM.net News (read here).
>>> The latest Featured Stock Update with an annotated graph appeared on 10/30/2009. click here.
|
|
C
A
S
I |
News |
Chart |
SEC
View all notes Alert
me of new notes
Company
Profile
|
BIDU
- NASDAQ
Baidu Inc Ads
INTERNET - Internet Information Providers
|
$375.45
|
-2.47
|
2,187,266
113% DAV
1,932,400
|
9/8/2009
(Date
Featured) |
$351.80
(Price
Featured) |
PP = $368.59 |
G |
| MB = $387.02 |
Most Recent Note - 11/2/2009 4:50:25 PM
G - Down again today on lighter than average volume, inching further below its 50 DMA line. Volume spiked to 5 times normal on 10/27/09 as it gapped down for a considerable loss following its latest earnings report. As recently noted, "Choppy action has not allowed it to form a sound base in recent weeks." BIDU traded up as much as +23% from its price when featured in yellow in the 9/08/09 Mid-Day BreakOuts Report (read here).
>>> The latest Featured Stock Update with an annotated graph appeared on 10/28/2009. click here.
|
|
C
A
S
I |
News |
Chart |
SEC
View all notes Alert
me of new notes
Company
Profile
|
CACC
- NASDAQ
Credit Acceptance Corp
FINANCIAL SERVICES - Credit Services
|
$34.74
|
+0.37
|
68,320
179% DAV
38,200
|
9/29/2009
(Date
Featured) |
$33.48
(Price
Featured) |
PP = $32.60 |
G |
| MB = $34.23 |
Most Recent Note - 11/2/2009 4:53:00 PM
G - Gapped down today and then positively reversed for a gain on above average volume, closing above its "max buy" level. Color code is changed to green. Market conditions (M criteria) are an overriding concern suggesting that investors hold off on any new buying efforts until a new rally with follow through day occurs. Prior chart highs and its 50 DMA line coincide in the $32 area, an important level to watch on pullbacks. The Finance - Consumer/Commercial Loans firm has maintained a great track record of annual and quarterly sales revenues and earnings increases. It was featured on 9/29/09 in yellow in the mid-day report (read here).
>>> The latest Featured Stock Update with an annotated graph appeared on 10/15/2009. click here.
|
|
C
A
S
I |
News |
Chart |
SEC
View all notes Alert
me of new notes
Company
Profile
|
CRM
- NYSE
Salesforce.com Inc
INTERNET - Internet Software & Services
|
$57.81
|
+1.06
|
1,803,587
90% DAV
2,012,800
|
8/16/2009
(Date
Featured) |
$47.12
(Price
Featured) |
PP = $45.59 |
G |
| MB = $47.87 |
Most Recent Note - 11/2/2009 4:55:22 PM
G - Overcame early weakness today and closed just above its 50 DMA line while the volume total was average behind the session's gain. Deterioration last week led to technical sell signals as it violated prior chart highs in the $59 area and an upward trendline connecting its July, August and October chart lows.
>>> The latest Featured Stock Update with an annotated graph appeared on 10/27/2009. click here.
|
|
C
A
S
I |
News |
Chart |
SEC
View all notes Alert
me of new notes
Company
Profile
|
EBIX
- NASDAQ
Ebix Inc
COMPUTER SOFTWARE & SERVICES - Business Software & Services
|
$60.12
|
-1.48
|
330,513
148% DAV
223,700
|
8/28/2009
(Date
Featured) |
$45.86
(Price
Featured) |
PP = $45.35 |
G |
| MB = $47.62 |
Most Recent Note - 11/2/2009 4:58:40 PM
G - Loss on slightly higher volume today continues its consolidation that began with the previously noted negative reversal from all-time highs on 10/26/09, followed by more worrisome distributional pressure. It is still well above prior chart highs and its 50 DMA line coinciding in the $54 area, the next important support level to watch.
>>> The latest Featured Stock Update with an annotated graph appeared on 11/2/2009. click here.
|
|
C
A
S
I |
News |
Chart |
SEC
View all notes Alert
me of new notes
Company
Profile
|
GMCR
- NASDAQ
Green Mtn Coffee Roastrs
FOOD & BEVERAGE - Processed & Packaged Goods
|
$66.95
|
+0.40
|
1,057,004
87% DAV
1,213,500
|
10/5/2009
(Date
Featured) |
$71.11
(Price
Featured) |
PP = $75.89 |
G |
| MB = $79.68 |
Most Recent Note - 11/2/2009 5:06:17 PM
G - Small gain on average volume today, still closing just below its 50 DMA line ($67.50) which was previously noted as an important support level to watch. Technically, it has also been hovering the past few session near an upward trendline connecting its March-September lows. Further deterioration would raise more concerns that its previously strong uptrend has gone cold.
>>> The latest Featured Stock Update with an annotated graph appeared on 10/29/2009. click here.
|
|
C
A
S
I |
News |
Chart |
SEC
View all notes Alert
me of new notes
Company
Profile
|
PEGA
- NASDAQ
Pegasystems Inc
COMPUTER SOFTWARE & SERVICES - Business Software & Services
|
$28.18
|
-0.49
|
467,550
147% DAV
318,600
|
9/9/2009
(Date
Featured) |
$31.14
(Price
Featured) |
PP = $33.35 |
G |
| MB = $35.02 |
Most Recent Note - 11/2/2009 5:08:32 PM
G - Ended in the upper half of its intra-day range, but still suffered a loss today with above average volume. Last week's violations of its 50 DMA line and upward trendline were previously noted as technical sell signals. Disciplined investors always limit losses when a stock falls more than 7% from their buy price. Its June highs, which were once resistance in the $27-28 area, are now being put to the test as a chart support level.
>>> The latest Featured Stock Update with an annotated graph appeared on 10/23/2009. click here.
|
|
C
A
S
I |
News |
Chart |
SEC
View all notes Alert
me of new notes
Company
Profile
|
|
|
|
THESE ARE NOT BUY RECOMMENDATIONS!
Comments contained in the body of this report are technical
opinions only. The material herein has been obtained
from sources believed to be reliable and accurate, however,
its accuracy and completeness cannot be guaranteed.
This site is not an investment advisor, hence it does
not endorse or recommend any securities or other investments.
Any recommendation contained in this report may not
be suitable for all investors and it is not to be deemed
an offer or solicitation on our part with respect to
the purchase or sale of any securities. All trademarks,
service marks and trade names appearing in this report
are the property of their respective owners, and are
likewise used for identification purposes only.
This report is a service available
only to active Paid Premium Members.
You may opt-out of receiving report notifications
at any time. Questions or comments may be submitted
by writing to Premium Membership Services 665 S.E. 10 Street, Suite 201 Deerfield Beach, FL 33441-5634 or by calling 1-800-965-8307
or 954-785-1121.
|
|
|


