Help Lines 954-785-1121


You are not logged in. Upgrade Here
 <<<Previous Mid Day Report     Next Mid Day Report >>> 
 <<<Previous After Market Report Next After Market Report >>> 
You are not logged in.
This means you CAN ONLY VIEW reports that were published prior to Monday, February 26, 2024.
You MUST UPGRADE YOUR MEMBERSHIP if you want to see any current reports.

AFTER MARKET UPDATE - FRIDAY, NOVEMBER 1ST, 2019
Previous After Market Report Next After Market Report >>>
Indices NYSE Nasdaq
DOW  +301.13 27,347.36 +1.11% Volume 854,921,930 -26% Volume 2,054,795,639 -9%
NASDAQ +94.04 8,386.40 +1.13% Advancers 2,122 73% Advancers 2,386 77%
S&P 500 +29.35 3,066.91 +0.97% Decliners 771 27% Decliners 727 23%
Russell 2000 +26.88 1,589.33 +1.72% 52 Wk Highs 181   52 Wk Highs 189  
S&P 600 +15.07 980.42 +1.56% 52 Wk Lows 24   52 Wk Lows 47  

Major Indices Posted Solid Gains With Impressive Leadership

The S&P 500 rallied 1% to another record closing high to cap a fourth-straight weekly gain. The Dow climbed 301 points, while the Nasdaq Composite advanced 1.1%, also ending the day at an all-time high. For the week, the S&P 500 rose 1.5%, while the Dow and Nasdaq Composite were each up 1.4% and 1.7%, respectively. Advancers led decliners by almost a 3-1 margin on the NYSE and more than 3-1 on the Nasdaq exchange. There were 81 high-ranked companies from the Leaders List that hit a new 52-week high and were listed on the BreakOuts Page, versus the total of 53 on the prior session. New 52-week highs totals expanded and easily outnumbered shrinking new 52-week lows totals on the NYSE and on the Nasdaq exchange. The major indices (M criteria) are in a "confirmed uptrend" after enduring distributional pressure in recent weeks. The Featured Stocks Page provides the most timely analysis on high-ranked leaders.
Charts used courtesy of www.stockcharts.com

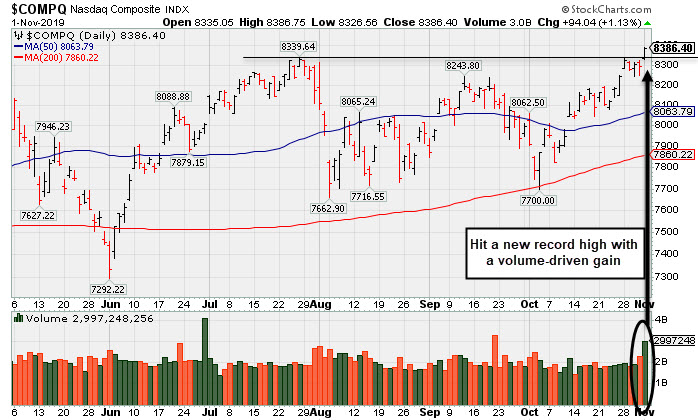
PICTURED: The Nasdaq Composite Index hit a new record high with a solid volume-driven gain. 

Stocks finished firmly higher Friday, as investors digested better-than-expected economic data and the latest trade headlines. On the data front, the Labor Department’s non-farm payrolls report showed 128,000 jobs were added in October, exceeding analyst expectations of an 85,000 uptick. The unemployment rate rose to 3.6% from a 50-year low of 3.5%. Separately, the Institute for Supply Management’s gauge showed manufacturing activity improved slightly in October, though remained in contractionary territory for the third-consecutive month. Treasuries declined, with the yield on the 10-year note up four basis points to 1.72%. In commodities, WTI crude added 3.7% to $56.20/barrel, paring its weekly decline to 1%.

Risk sentiment was also supported on reassurance from President Trump, who said that Washington and Beijing would determine a new meeting site to sign a “Phase One” trade agreement later this month. Separately, Chinese officials stated a “consensus on principles” was reached with the U.S. during discussions this week.

Nine of 11 S&P 500 sectors closed in positive territory, with Real Estate and Utilities the laggards. Energy shares paced gains with Exxon Mobil (XOM +3.00%) rising following its positive quarterly results. In M&A news, Fitbit (FIT +15.53%) rose after Google parent Alphabet (GOOGL +1.07%) agreed to purchase the smartwatch maker.


Kenneth J. Gruneisen started out as a licensed stockbroker in August 1987, a couple of months prior to the historic stock market crash that took the Dow Jones Industrial Average down -22.6% in a single day. He has published daily fact-based fundamental and technical analysis on high-ranked stocks online for two decades. Through FACTBASEDINVESTING.COM, Kenneth provides educational articles, news, market commentary, and other information regarding proven investment systems that work in good times and bad.

Comments contained in the body of this report are technical opinions only and are not necessarily those of Gruneisen Growth Corp. The material herein has been obtained from sources believed to be reliable and accurate, however, its accuracy and completeness cannot be guaranteed. Our firm, employees, and customers may effect transactions, including transactions contrary to any recommendation herein, or have positions in the securities mentioned herein or options with respect thereto. Any recommendation contained in this report may not be suitable for all investors and it is not to be deemed an offer or solicitation on our part with respect to the purchase or sale of any securities.


Energy Groups Outpaced Financial, Retail, Semiconductor, and Biotech

The Bank Index ($BKX +1.93%) and the Broker/Dealer Index ($XBD +1.61%) both posted solid gains and outpaced the Retail Index ($RLX +0.85%). The tech sector was mixed as the Semiconductor Index ($SOX +2.34%) and the Biotech Index ($BTK +2.36%) each posted solid gains but the , Networking Index ($NWX -1.74%) ended lower. The Integrated Oil Index ($XOI +2.32%) and the Gold & Silver Index ($XAU +0.34%) rose.
Charts courtesy of www.stockcharts.com

PICTURED: The Oil Services Index ($OSX +5.37%) posted an impressive standout gain on Friday as it rebounded to close the week above its 50-day moving average (DMA) line.

Industry Index Symbol Close Change % Change YTD % Change
Oil Services $OSX  68.28 +3.48 +5.37% -15.29%
Integrated Oil $XOI  1,246.17 +28.31 +2.32% +7.51%
Semiconductor $SOX  1,689.93 +38.71 +2.34% +46.29%
Networking $NWX  543.98 -9.63 -1.74% +11.32%
Broker/Dealer $XBD  268.97 +4.26 +1.61% +13.33%
Retail $RLX  2,416.63 +20.41 +0.85% +23.84%
Gold & Silver $XAU  95.94 +0.32 +0.33% +35.78%
Bank $BKX  105.80 +2.01 +1.94% +23.32%
Biotech $BTK  4,526.90 +104.19 +2.36% +7.25%


Featured Stocks

See the Featured Stocks with most recent note below. Feel free to contact us if you have a need for any additional information. 

Color Codes Explained :
Y - Better candidates highlighted by our staff of experts.
G - Previously featured in past reports as yellow but may no longer be buyable under the guidelines.

***Last / Change / Volume data in this table is the closing quote data***
Symbol/Exchange
Company Name
Industry Group
PRICE CHANGE
(%Change)
Day High Volume
(% DAV)
(% 50 day avg vol)
52 Wk Hi
% From Hi
Featured
Date
Price
Featured
Pivot Featured
Max Buy
StockCharts.com Latest Chart for MLR MLR - NYSE
Miller Industries Inc
AUTOMOTIVE - Auto Parts  
$35.77 -0.18
-0.50%

$36.17

34,901
96.95% of 50 DAV
50 DAV is 36,000
$36.34
-1.57%
9/24/2019 $34.00 PP = $35.36
MB = $37.13
Most Recent Note - 10/30/2019 12:37:41 PM
Y - Hitting another new high with today's 4th consecutive gain backed by ever-increasing volume. Prior reports repeatedly noted - "Subsequent gains and a close above the pivot point backed by at least +40% above average volume may trigger a convincing technical buy signal. Fundamentals remain strong."
>>> FEATURED STOCK ARTICLE : Hit New High But Did Not Close Session Above Pivot Point - 10/29/2019
 |  View all notes | Set NEW NOTE alert | Company Profile | SEC News | Chart | Request a new note C A  S  I 
StockCharts.com Latest Chart for CCBG CCBG - NASDAQ
Capital City Bk Gp
BANKING - Regional - Mid-Atlantic Banks  
$29.13 +0.68
2.37%

$29.23

58,373
194.58% of 50 DAV
50 DAV is 30,000
$29.17
-0.15%
9/13/2019 $27.03 PP = $27.05
MB = $28.40
Most Recent Note - 11/1/2019 12:16:37 PM
G - Hit a new 52-week high with today's early gain backed by above average volume. Managed a "positive reversal" on 10/29/19 following another strong earnings report. Prior highs define important support to watch along with its 50 DMA line ($26.59). See the latest FSU analysis for more details and a annotated graph.
>>> FEATURED STOCK ARTICLE : Noted "Positive Reversal" on Volatile Session After Earnings - 10/31/2019
 |  View all notes | Set NEW NOTE alert | Company Profile | SEC News | Chart | Request a new note C A  S  I 
StockCharts.com Latest Chart for AUDC AUDC - NASDAQ
Audiocodes Ltd
ELECTRONICS - Scientific and Technical Instrum  
$20.89 -0.25
-1.18%

$21.70

202,818
89.35% of 50 DAV
50 DAV is 227,000
$22.50
-7.16%
9/13/2019 $19.68 PP = $19.84
MB = $20.83
Most Recent Note - 10/31/2019 6:41:39 PM
Y - Pulled back today with above average volume breaking a streak of 4 consecutive gains marked by some heavier volume. Reported earnings +26% on +15% sales revenues for the Sep '19 quarter. Rallying above the prior pivot point with this week's volume driven gains. Recent low ($17.54 on 10/08/19) defines the next important support.
>>> FEATURED STOCK ARTICLE : Consolidating Above 50-Day Average But Below Prior Pivot Point - 10/21/2019
 |  View all notes | Set NEW NOTE alert | Company Profile | SEC News | Chart | Request a new note C A  S  I 
StockCharts.com Latest Chart for CHDN CHDN - NASDAQ
Churchill Downs Inc
LEISURE - Gaming Activities  
$129.11 -0.88
-0.68%

$131.40

283,131
106.84% of 50 DAV
50 DAV is 265,000
$135.32
-4.59%
10/8/2019 $129.77 PP = $132.83
MB = $139.47
Most Recent Note - 10/31/2019 6:38:58 PM
Y - Retreated from its all-time high with a volume-driven loss today and tested its 50 DMA line ($126) which acted as support in recent months. Reported Sep '19 earnings +4% on +38% sales revenues versus the year ago period, its 2nd consecutive quarterly comparison below the +25% minimum earnings guideline (C criteria), raising greater fundamental concerns. See the latest FSU analysis for more details and an annotated graph.
>>> FEATURED STOCK ARTICLE : Perched at Record High at Time of Quarterly Report - 10/30/2019
 |  View all notes | Set NEW NOTE alert | Company Profile | SEC News | Chart | Request a new note C A  S  I 
StockCharts.com Latest Chart for LULU LULU - NASDAQ
Lululemon Athletica
MANUFACTURING - Textile Manufacturing  
$200.69 -3.58
-1.75%

$205.66

1,999,067
106.45% of 50 DAV
50 DAV is 1,878,000
$209.02
-3.99%
9/6/2019 $201.25 PP = $194.35
MB = $204.07
Most Recent Note - 10/28/2019 12:31:21 PM
G - Holding its ground near its all-time high after wedging higher with gains lacking great volume conviction. Its 50 DMA line ($193.44) and recent low ($185.36 on 10/03/19) define important near-term support.
>>> FEATURED STOCK ARTICLE : LULU Stretches to Hit New Record High - 10/18/2019
 |  View all notes | Set NEW NOTE alert | Company Profile | SEC News | Chart | Request a new note C A  S  I 
Symbol/Exchange
Company Name
Industry Group
PRICE CHANGE
(%Change)
Day High Volume
(% DAV)
(% 50 day avg vol)
52 Wk Hi
% From Hi
Featured
Date
Price
Featured
Pivot Featured
Max Buy
StockCharts.com Latest Chart for CPRT CPRT - NASDAQ
Copart Inc
SPECIALTY RETAIL - Auto Dealerships  
$82.91 +0.27
0.33%

$83.90

1,542,729
102.37% of 50 DAV
50 DAV is 1,507,000
$85.31
-2.81%
9/5/2019 $79.13 PP = $79.84
MB = $83.83
Most Recent Note - 10/30/2019 5:45:05 PM
G - Wedged to new all-time highs with recent gains lacking great volume conviction. Its 50 DMA line ($80.34) defines near-term support above the prior low ($76.35 on 10/03/19).
>>> FEATURED STOCK ARTICLE : Reversed Into Red Today After Hitting New All-Time High - 10/22/2019
 |  View all notes | Set NEW NOTE alert | Company Profile | SEC News | Chart | Request a new note C A  S  I 
StockCharts.com Latest Chart for BLD BLD - NYSE
Topbuild Corp
Bldg-Constr Prds/Misc  
$110.27 +6.34
6.10%

$110.29

614,784
231.12% of 50 DAV
50 DAV is 266,000
$106.82
3.23%
5/17/2019 $82.19 PP = $87.31
MB = $91.68
Most Recent Note - 11/1/2019 12:10:24 PM
G - Extended from any sound base and powering to yet another new all-time high with today's volume-driven gain. Reported earnings +24% on +5% sales revenues for the Sep '19 quarter versus the year ago period, just below the +25% minimum guideline (C criteria). Found prompt support near its 50 DMA line ($95) during its ongoing ascent.
>>> FEATURED STOCK ARTICLE : Pulling Back After Recently Wedging Into New High Territory - 10/23/2019
 |  View all notes | Set NEW NOTE alert | Company Profile | SEC News | Chart | Request a new note C A  S  I 

THESE ARE NOT BUY RECOMMENDATIONS!  Comments contained in the body of this report are technical opinions only. The material herein has been obtained from sources believed to be reliable and accurate, however, its accuracy and completeness cannot be guaranteed. This site is not an investment advisor, hence it does not endorse or recommend any securities or other investments. Any recommendation contained in this report may not be suitable for all investors and it is not to be deemed an offer or solicitation on our part with respect to the purchase or sale of any securities. All trademarks, service marks and trade names appearing in this report are the property of their respective owners, and are likewise used for identification purposes only.

This report is a service available only to active Paid Premium Members. You may opt-out of receiving report notifications at any time.  Questions or comments may be submitted by writing to Premium Membership Services 665 S.E. 10 Street, Suite 201 Deerfield Beach, FL 33441-5634 or by calling 1-800-965-8307 or 954-785-1121.

Kenneth J. Gruneisen founded Gruneisen Growth Corp. (2003), which prior to May 11, 2015, operated CANSLIM.net and CANSLIM.com both under license from Data Analysis Inc. / Investor's Business Daily. Kenneth has passed the CAN SLIM® Master's Exam. Gruneisen Growth Corp. now continues over two decades of fact based market analysis via FactBasedInvesting.com.

Copyright © 1996-2024 Gruneisen Growth Corp. All rights reserved. Protected by the copyright laws of the United States and Canada and by international treaties

Privacy Policy | Terms of Use | Contact Us