***Last / Change / Volume data in this table is the closing quote data***
Symbol/Exchange
Company Name
Industry Group |
PRICE |
CHANGE
(%Change) |
Day High |
Volume
(% DAV)
(% 50 day avg vol) |
52 Wk Hi
% From Hi |
Featured
Date |
Price
Featured |
Pivot Featured |
|
Max Buy |
BITA
-
NYSE
Bitauto Hldgs Ltd Ads
INTERNET - Internet Information Providers
|
$24.51
|
+0.55
2.30% |
$25.67
|
861,172
104.08% of 50 DAV
50 DAV is 827,400
|
$28.48
-13.94%
|
9/24/2013
|
$16.40
|
PP = $17.31
|
|
MB = $18.18
|
Most Recent Note - 10/30/2013 2:06:47 PM
G - Down considerably for its 3rd volume-driven loss in the span of 4 sessions. Wider than usual intra-day price swings in recent days is a worrisome sign of uncertainty while it remains very extended from its prior base. Prior highs in the $18 area define initial support to watch on pullbacks.
>>> FEATURED STOCK ARTICLE : Volume-Driven Gains Cleared Latest Pivot Point - 10/2/2013
View all notes |
Set NEW NOTE alert |
CANSLIM.net Company Profile |
SEC
News |
Chart |
Request a new note
C
A N
S L
I M


|
BLOX
-
NYSE
Infoblox Inc
COMPUTER HARDWARE - Networking and Communication Dev
|
$44.45
|
+0.36
0.82% |
$45.29
|
460,922
56.76% of 50 DAV
50 DAV is 812,100
|
$48.97
-9.22%
|
10/11/2013
|
$43.02
|
PP = $45.60
|
|
MB = $47.88
|
Most Recent Note - 10/30/2013 3:08:22 PM
Y - Retreating today on lighter volume however it has slumped below prior highs in the $45 area defining initial support to watch raising some concern. Prior volume-driven gains above the pivot point triggered a technical buy signal. Disciplined investors avoid chasing "extended" stocks and limit losses by selling any stock that falls more than -7% from their purchase price.
>>> FEATURED STOCK ARTICLE : Finished Another Week Higher With Volume Behind Gains - 10/11/2013
View all notes |
Set NEW NOTE alert |
CANSLIM.net Company Profile |
SEC
News |
Chart |
Request a new note
C
A N
S L
I M
|
CELG
-
NASDAQ
Celgene Corp
DRUGS - Drug Manufacturers - Major
|
$148.49
|
-2.83
-1.87% |
$152.93
|
3,290,604
121.53% of 50 DAV
50 DAV is 2,707,700
|
$161.64
-8.14%
|
9/12/2013
|
$149.50
|
PP = $150.02
|
|
MB = $157.52
|
Most Recent Note - 10/30/2013 3:13:19 PM
G - Slumping near its 50 DMA line with today's 5th loss in 6 sessions while retreating from all-time highs. Its 50 DMA line ($150.07 now) defines important near-term support while the prior low ($143.13 on 10/09/13) is the next technical support level where subsequent violations may trigger technical sell signals.
>>> FEATURED STOCK ARTICLE : Volume-Driven Gain Challenging New Pivot Point - 9/20/2013
View all notes |
Set NEW NOTE alert |
CANSLIM.net Company Profile |
SEC
News |
Chart |
Request a new note
C
A N
S L
I M
|
EGBN
-
NASDAQ
Eagle Bancorp Inc
BANKING - Regional - Mid-Atlantic Banks
|
$26.45
|
-1.00
-3.64% |
$27.38
|
131,259
182.81% of 50 DAV
50 DAV is 71,800
|
$29.92
-11.60%
|
9/16/2013
|
$27.48
|
PP = $27.77
|
|
MB = $29.16
|
 Most Recent Note - 10/31/2013 6:00:57 PM
Recently reported earnings +10% on +8% sales revenues for the Sep '13 quarter, below the +25% minimum guideline (C criteria), raising fundamental concerns. Today it violated its recent low ($26.88 on 10/08/13) and its 50 DMA line with a damaging volume driven loss triggering more worrisome technical sell signals. Due to the deterioration it will be dropped from the Featured Stocks list tonight.
>>> FEATURED STOCK ARTICLE : Fundamental and Technical Deterioration Raising Concerns - 10/23/2013
View all notes |
Set NEW NOTE alert |
CANSLIM.net Company Profile |
SEC
News |
Chart |
Request a new note
C
A N
S L
I M
|
EGOV
-
NASDAQ
N I C Inc
INTERNET - Internet Software and Services
|
$24.62
|
-0.13
-0.53% |
$24.97
|
235,838
81.30% of 50 DAV
50 DAV is 290,100
|
$25.99
-5.27%
|
10/18/2013
|
$25.17
|
PP = $23.66
|
|
MB = $24.84
|
Most Recent Note - 10/28/2013 6:46:25 PM
Y - Holding its ground perched in a tight range near its 52-week high following a technical breakout from a "double bottom" base on 10/18/13.
>>> FEATURED STOCK ARTICLE : Technical Breakout From "Double Bottom" Base on 3 Times Average Volume - 10/18/2013
View all notes |
Set NEW NOTE alert |
CANSLIM.net Company Profile |
SEC
News |
Chart |
Request a new note
C
A N
S L
I M
|
Symbol/Exchange
Company Name
Industry Group |
PRICE |
CHANGE
(%Change) |
Day High |
Volume
(% DAV)
(% 50 day avg vol) |
52 Wk Hi
% From Hi |
Featured
Date |
Price
Featured |
Pivot Featured |
|
Max Buy |
FLT
-
NYSE
Fleetcor Technologies
DIVERSIFIED SERVICES - Business/Management Services
|
$115.35
|
+8.19
7.64% |
$120.51
|
1,793,320
234.94% of 50 DAV
50 DAV is 763,300
|
$114.16
1.04%
|
8/19/2013
|
$99.01
|
PP = $100.97
|
|
MB = $106.02
|
Most Recent Note - 10/31/2013 12:35:24 PM
G - Gapped up from support near its 50 DMA line and hit a new 52-week high with today's considerable volume-driven gain. Endured distributional pressure in recent weeks and has not formed a sound base. Reported earnings +30% on +20% sales revenues for the Sep '13 quarter.
>>> FEATURED STOCK ARTICLE : Extended After 13 Weekly Gains in Span of 14 Weeks - 10/7/2013
View all notes |
Set NEW NOTE alert |
CANSLIM.net Company Profile |
SEC
News |
Chart |
Request a new note
C
A N
S L
I M
|
GNRC
-
NYSE
Generac Hldgs Inc
CONSUMER DURABLES - Electronic Equipment
|
$49.35
|
+0.18
0.37% |
$50.00
|
633,878
77.83% of 50 DAV
50 DAV is 814,400
|
$52.32
-5.68%
|
10/24/2013
|
$47.46
|
PP = $44.24
|
|
MB = $46.45
|
Most Recent Note - 10/30/2013 6:06:38 PM
G - Consolidating after quickly getting very extended from its latest base after highlighted in yellow with new pivot point cited based on its 9/25/13 high in the 10/24/13 mid-day report (read here) after a considerable "breakaway gap" triggered a technical buy signal. See the latest FSU analysis for more details and new annotated daily and weekly graphs.
>>> FEATURED STOCK ARTICLE : Consolidating After "Breakway Gap" With 4 Times Average Volume - 10/30/2013
View all notes |
Set NEW NOTE alert |
CANSLIM.net Company Profile |
SEC
News |
Chart |
Request a new note
C
A N
S L
I M
|
JAZZ
-
NASDAQ
Jazz Pharmaceuticals Plc
DRUGS - Biotechnology
|
$90.74
|
+0.03
0.03% |
$91.34
|
620,465
89.10% of 50 DAV
50 DAV is 696,400
|
$95.24
-4.73%
|
9/30/2013
|
$93.20
|
PP = $89.10
|
|
MB = $93.56
|
Most Recent Note - 10/31/2013 5:46:46 PM
Y- Color code is changed to yellow while quietly consolidating under its "max buy" level after a spurt of volume-driven gains into new high territory.
>>> FEATURED STOCK ARTICLE : Strong Finish With High Volume Indicative of Accumulation - 9/30/2013
View all notes |
Set NEW NOTE alert |
CANSLIM.net Company Profile |
SEC
News |
Chart |
Request a new note
C
A N
S L
I M
|
KORS
-
NYSE
Michael Kors Hldgs Ltd
RETAIL - Apparel Stores
|
$76.95
|
-1.03
-1.32% |
$77.27
|
6,136,022
186.43% of 50 DAV
50 DAV is 3,291,400
|
$78.83
-2.38%
|
8/6/2013
|
$69.66
|
PP = $66.28
|
|
MB = $69.59
|
Most Recent Note - 10/31/2013 12:42:20 PM
G - Small gap down today after trading heavy volume behind recent gains but making limited price progress versus prior highs in the $78 area, noted as signs it has been enduring distributional pressure. Recent low ($70.59 on 10/09/13) defines the next important near-term support area below its 50 DMA line ($74.74 now).
>>> FEATURED STOCK ARTICLE : Extended From Base After Additional Volume-Driven Gains - 9/27/2013
View all notes |
Set NEW NOTE alert |
CANSLIM.net Company Profile |
SEC
News |
Chart |
Request a new note
C
A N
S L
I M
|
LOPE
-
NASDAQ
Grand Canyon Education
DIVERSIFIED SERVICES - Education and; Training Services
|
$47.27
|
-0.62
-1.29% |
$48.27
|
843,419
225.63% of 50 DAV
50 DAV is 373,800
|
$50.48
-6.36%
|
6/19/2013
|
$31.47
|
PP = $34.17
|
|
MB = $35.88
|
Most Recent Note - 10/31/2013 12:47:31 PM
G - Perched near its all-time high today following a gap up on the prior session for a considerable volume-driven gain. Reported earnings +17% on +14% sales revenues for the Sep '13 quarter, its 2nd quarterly comparison with an earnings increase below the +25% minimum guideline (C criteria). Repeatedly noted - "Fundamental concerns remain while technical action has been reassuring."
>>> FEATURED STOCK ARTICLE : Formed Advanced Base But Fundamental Concerns Remain - 10/14/2013
View all notes |
Set NEW NOTE alert |
CANSLIM.net Company Profile |
SEC
News |
Chart |
Request a new note
C
A N
S L
I M
|
Symbol/Exchange
Company Name
Industry Group |
PRICE |
CHANGE
(%Change) |
Day High |
Volume
(% DAV)
(% 50 day avg vol) |
52 Wk Hi
% From Hi |
Featured
Date |
Price
Featured |
Pivot Featured |
|
Max Buy |
MRLN
-
NASDAQ
Marlin Business Services
DIVERSIFIED SERVICES - Rental and Leasing Services
|
$27.57
|
-0.13
-0.47% |
$27.98
|
34,274
109.85% of 50 DAV
50 DAV is 31,200
|
$28.64
-3.73%
|
9/9/2013
|
$23.75
|
PP = $24.03
|
|
MB = $25.23
|
Most Recent Note - 10/31/2013 5:43:56 PM
G - Encountered distributional pressure today while holding its ground near its 52-week high. Found support at its 50 DMA line on the last pullback then rallied to new highs and got more extended from its prior base. Prior highs in the $26 area define initial support to watch on pullbacks.
>>> FEATURED STOCK ARTICLE : Faring Better Than Others While Testing 50-Day Average Line - 10/8/2013
View all notes |
Set NEW NOTE alert |
CANSLIM.net Company Profile |
SEC
News |
Chart |
Request a new note
C
A N
S L
I M
|
NOAH
-
NYSE
Noah Holdings Ltd Ads
FINANCIAL SERVICES - Asset Management
|
$19.29
|
-0.13
-0.67% |
$20.53
|
794,563
99.25% of 50 DAV
50 DAV is 800,600
|
$22.99
-16.09%
|
10/15/2013
|
$19.10
|
PP = $18.33
|
|
MB = $19.25
|
Most Recent Note - 10/29/2013 3:28:33 PM
Y - Rebounding today after testing support at its 50 DMA line, and its color code is changed to yellow. Disciplined investors always limit losses by selling if any stock falls more than -7% from their purchase price.
>>> FEATURED STOCK ARTICLE : Finished Strong With Gain on 4 Times Average Volume - 10/15/2013
View all notes |
Set NEW NOTE alert |
CANSLIM.net Company Profile |
SEC
News |
Chart |
Request a new note
C
A N
S L
I M
|
OII
-
NYSE
Oceaneering Intl Inc
ENERGY - Oil and Gas Drilling and Explorati
|
$85.88
|
-0.80
-0.92% |
$87.27
|
686,841
105.75% of 50 DAV
50 DAV is 649,500
|
$87.64
-2.01%
|
10/16/2013
|
$83.08
|
PP = $84.74
|
|
MB = $88.98
|
Most Recent Note - 10/29/2013 3:31:30 PM
Y - Rising within close striking distance of its best-ever close with today's 4th consecutive gain helping it rebound above its pivot point. Its 50 DMA line and recent lows define near-term support in the $82 area.
>>> FEATURED STOCK ARTICLE : Forming Set-Up Above 50-Day Moving Average Line - 10/16/2013
View all notes |
Set NEW NOTE alert |
CANSLIM.net Company Profile |
SEC
News |
Chart |
Request a new note
C
A N
S L
I M
|
PCLN
-
NASDAQ
Priceline.Com Inc
INTERNET - Internet Software and Services
|
$1,053.83
|
-14.72
-1.38% |
$1,082.00
|
668,031
126.19% of 50 DAV
50 DAV is 529,400
|
$1,098.70
-4.08%
|
9/13/2013
|
$966.82
|
PP = $995.08
|
|
MB = $1,044.83
|
Most Recent Note - 10/29/2013 6:10:03 PM
G - Hovering near its 52-week high, extended from any sound base. Found support near its 50 DMA line then rallied to new highs with volume-driven gains. see the latest FSU analysis for more details and new annotated daily and weekly graphs.
>>> FEATURED STOCK ARTICLE : Rallied to New Highs Following Pullback to 50-day Average - 10/29/2013
View all notes |
Set NEW NOTE alert |
CANSLIM.net Company Profile |
SEC
News |
Chart |
Request a new note
C
A N
S L
I M
|
PRAA
-
NASDAQ
Portfolio Recovery Assoc
DIVERSIFIED SERVICES - Business/Management Services
|
$59.45
|
-3.49
-5.54% |
$63.24
|
1,520,325
390.53% of 50 DAV
50 DAV is 389,300
|
$63.96
-7.06%
|
10/17/2013
|
$60.75
|
PP = $61.70
|
|
MB = $64.79
|
Most Recent Note - 10/31/2013 10:57:25 AM
Y - Reported earnings +43% on +31% sales revenues for the Sep '13 quarter. Down today with above average volume, slumping below prior highs and undercutting its 50 DMA line. Volume-driven gains did not trigger a proper new (or add-on) technical buy signal after a new pivot point was cited.
>>> FEATURED STOCK ARTICLE : Wedging to New Highs With Gains Lacking Volume Conviction - 9/26/2013
View all notes |
Set NEW NOTE alert |
CANSLIM.net Company Profile |
SEC
News |
Chart |
Request a new note
C
A N
S L
I M
|
Symbol/Exchange
Company Name
Industry Group |
PRICE |
CHANGE
(%Change) |
Day High |
Volume
(% DAV)
(% 50 day avg vol) |
52 Wk Hi
% From Hi |
Featured
Date |
Price
Featured |
Pivot Featured |
|
Max Buy |
PRLB
-
NYSE
Proto Labs Inc
MANUFACTURING - Small Tools and Accessories
|
$83.86
|
-0.14
-0.17% |
$84.45
|
2,284,866
666.92% of 50 DAV
50 DAV is 342,600
|
$88.63
-5.38%
|
7/29/2013
|
$64.86
|
PP = $67.50
|
|
MB = $70.88
|
Most Recent Note - 10/31/2013 10:51:42 AM
G - Reported earnings +28% on +29% sales revenues for the Sep '13 quarter. Gapped down today for a damaging loss with heavy volume, yet rebounded from earlier lows after undercutting its 50 DMA line. Prior low $68.29 on 10/09/13 defines the next important near-term support level.
>>> FEATURED STOCK ARTICLE : Extended Following Additional Volume-Driven Gains - 9/25/2013
View all notes |
Set NEW NOTE alert |
CANSLIM.net Company Profile |
SEC
News |
Chart |
Request a new note
C
A N
S L
I M
|
SFUN
-
NYSE
Soufun Hldgs Ltd Ads A
INTERNET - Internet Information Providers
|
$53.23
|
+3.32
6.65% |
$54.48
|
990,419
68.68% of 50 DAV
50 DAV is 1,442,100
|
$59.50
-10.54%
|
10/17/2013
|
$58.02
|
PP = $53.87
|
|
MB = $56.56
|
Most Recent Note - 10/28/2013 1:48:51 PM
Y - Halted its slide today after undercutting prior highs in the $53 area and slumping into its prior base with 5 consecutive losses marked by ever-increasing volume. Its 50 DMA line ($48.09 now) defines important near-term support to watch.
>>> FEATURED STOCK ARTICLE : Following Great Rally No New Base Has Been Formed - 10/1/2013
View all notes |
Set NEW NOTE alert |
CANSLIM.net Company Profile |
SEC
News |
Chart |
Request a new note
C
A N
S L
I M
|
SSNC
-
NASDAQ
S S & C Technologies
COMPUTER SOFTWARE and SERVICES - Application Software
|
$39.30
|
-0.11
-0.28% |
$39.60
|
466,975
116.42% of 50 DAV
50 DAV is 401,100
|
$39.99
-1.72%
|
10/22/2013
|
$39.17
|
PP = $40.04
|
|
MB = $42.04
|
Most Recent Note - 10/29/2013 3:36:16 PM
Y - Volume totals have been cooling while recently wedging higher and it touched a new 52-week high today but reversed into the red. Subsequent volume-driven gains above the pivot point may trigger a new (or add-on) technical buy signal.
>>> FEATURED STOCK ARTICLE : Finding Support Near 50-Day Average After Secondary Offering - 10/4/2013
View all notes |
Set NEW NOTE alert |
CANSLIM.net Company Profile |
SEC
News |
Chart |
Request a new note
C
A N
S L
I M
|
SSYS
-
NASDAQ
Stratasys Ltd
COMPUTER HARDWARE - Computer Peripherals
|
$113.28
|
+0.61
0.54% |
$115.00
|
1,012,356
90.26% of 50 DAV
50 DAV is 1,121,600
|
$113.49
-0.18%
|
10/11/2013
|
$102.94
|
PP = $105.38
|
|
MB = $110.65
|
Most Recent Note - 10/30/2013 3:27:43 PM
G - Poised for a possible new high close with today's gain challenging its 52-week high. Color code is changed to green while rallying back above its "max buy" level. Found support above prior highs in the $105 area when consolidating after rallying from a "double bottom" base. Recent gains lacked higher volume indicative of heavy institutional buying demand.
>>> FEATURED STOCK ARTICLE : Faltering and Relative Strength Waning After Offering - 10/9/2013
View all notes |
Set NEW NOTE alert |
CANSLIM.net Company Profile |
SEC
News |
Chart |
Request a new note
C
A N
S L
I M
|
STMP
-
NASDAQ
Stamps.Com Inc
INTERNET - Internet Software and Services
|
$45.44
|
-0.52
-1.13% |
$46.36
|
130,203
117.09% of 50 DAV
50 DAV is 111,200
|
$49.40
-8.02%
|
9/24/2013
|
$45.54
|
PP = $46.57
|
|
MB = $48.90
|
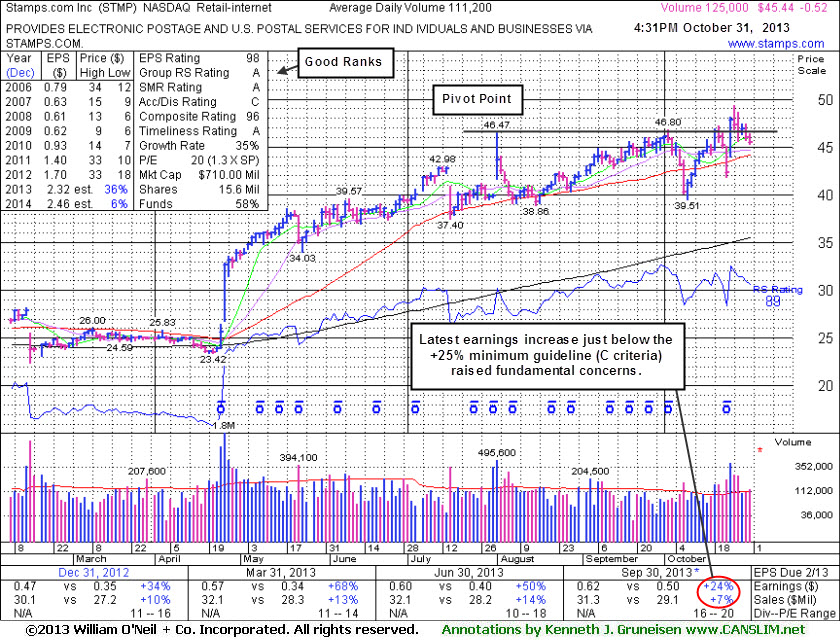
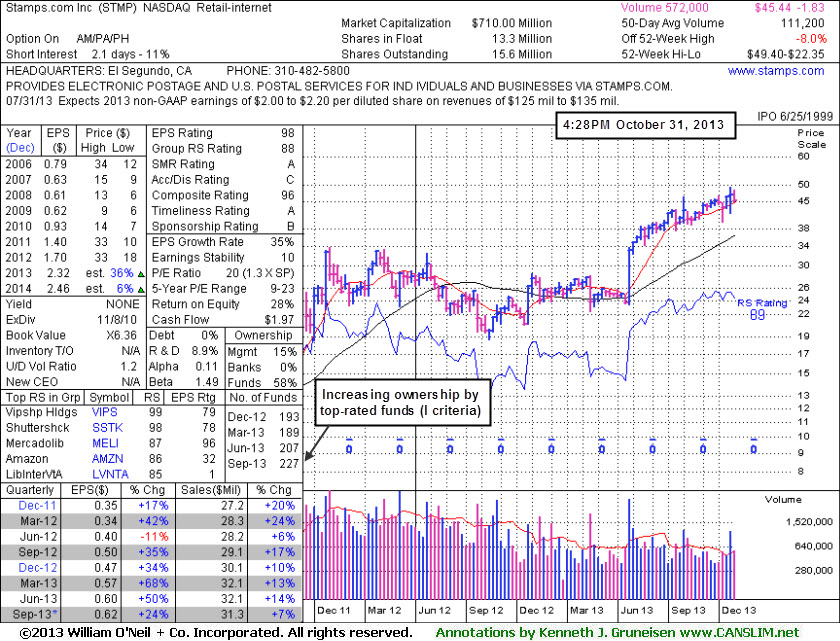
Most Recent Note - 10/31/2013 5:40:17 PM
G - Churned above average volume at its 52-week high for the past week while making limited headway above prior highs in the $46 area. Fundamental concerns were raised by waning sales revenues and earnings increases. Reported earnings +24% on +7% sales revenues for the Sep '13 quarter, just below the +25% minimum earnings guideline (C criteria). See the latest FSU analysis for more details and new annotated daily and weekly graphs.
>>> FEATURED STOCK ARTICLE : Fundamental Flaw May Prompt Disciplined Investors to Look Elsewhere - 10/31/2013
View all notes |
Set NEW NOTE alert |
CANSLIM.net Company Profile |
SEC
News |
Chart |
Request a new note
C
A N
S L
I M
|
Symbol/Exchange
Company Name
Industry Group |
PRICE |
CHANGE
(%Change) |
Day High |
Volume
(% DAV)
(% 50 day avg vol) |
52 Wk Hi
% From Hi |
Featured
Date |
Price
Featured |
Pivot Featured |
|
Max Buy |
TBBK
-
NASDAQ
Bancorp Inc
BANKING - Regional - Mid-Atlantic Banks
|
$16.17
|
-0.47
-2.82% |
$16.66
|
242,777
117.51% of 50 DAV
50 DAV is 206,600
|
$19.14
-15.52%
|
9/4/2013
|
$16.26
|
PP = $16.79
|
|
MB = $17.63
|
Most Recent Note - 10/31/2013 5:56:09 PM
Tallied its 8th consecutive loss today and slumped below its July highs falling into its prior base. It will be dropped from the Featured Stocks list tonight after damaging volume-driven losses and due to deteriorating fundamentals. Reported earnings +18% for the Sep '13 quarter, below the +25% minimum guideline (C criteria) for buy candidates raising concerns.
>>> FEATURED STOCK ARTICLE : Encountering Distributional Pressure While Consolidating Above Prior Highs - 10/3/2013
View all notes |
Set NEW NOTE alert |
CANSLIM.net Company Profile |
SEC
News |
Chart |
Request a new note
C
A N
S L
I M
|
ULTI
-
NASDAQ
Ultimate Software Group
INTERNET - Internet Software and Services
|
$154.48
|
-2.95
-1.87% |
$158.65
|
188,039
130.58% of 50 DAV
50 DAV is 144,000
|
$162.88
-5.16%
|
10/16/2013
|
$142.95
|
PP = $151.18
|
|
MB = $158.74
|
Most Recent Note - 10/30/2013 1:55:16 PM
G - Hit another new 52-week high with today's 5th consecutive gain, rallying just beyond its "max buy" level and its color code is changed to green while getting extended from its prior base. Volume-driven gains were noted when a technical buy signal was triggered. Disciplined investors avoid chasing extended stocks that have rallied more than +5% above their prior highs.
>>> FEATURED STOCK ARTICLE : Hovering Less Than -5% From 52-Week High - 10/17/2013
View all notes |
Set NEW NOTE alert |
CANSLIM.net Company Profile |
SEC
News |
Chart |
Request a new note
C
A N
S L
I M
|
VRX
-
NYSE
Valeant Pharmaceuticals
DRUGS - Drug Manufacturers - Other
|
$105.72
|
-3.34
-3.06% |
$108.24
|
5,138,923
473.81% of 50 DAV
50 DAV is 1,084,600
|
$115.40
-8.38%
|
9/11/2013
|
$100.26
|
PP = $105.50
|
|
MB = $110.78
|
Most Recent Note - 10/31/2013 11:01:18 AM
Y- Reported earnings +24% on +74% sales revenues for the Sep '13 quarter. Down with above average volume behind today's loss, trading near prior highs in the $105 area and its 50 DMA line defining important near-term support. Damaging violations may trigger technical sell signals.
>>> FEATURED STOCK ARTICLE : Found Support Above Prior Highs on Pullback - 10/10/2013
View all notes |
Set NEW NOTE alert |
CANSLIM.net Company Profile |
SEC
News |
Chart |
Request a new note
C
A N
S L
I M
|
YNDX
-
NASDAQ
Yandex N V Class A
INTERNET - Internet Information Providers
|
$36.86
|
-0.45
-1.21% |
$37.45
|
3,464,042
130.57% of 50 DAV
50 DAV is 2,653,100
|
$42.00
-12.24%
|
9/5/2013
|
$34.24
|
PP = $34.79
|
|
MB = $36.53
|
Most Recent Note - 10/31/2013 11:05:57 AM
G - Slumping just below its 50 DMA line and near an upward trendline connecting its April - October lows with today's 6th consecutive loss raising some concerns. Further deterioration may raise more serious concerns, and its prior low ($34.31 on 10/08/13) defines the next important support level.
>>> FEATURED STOCK ARTICLE : Consolidating After Getting Extended From Sound Base - 10/28/2013
View all notes |
Set NEW NOTE alert |
CANSLIM.net Company Profile |
SEC
News |
Chart |
Request a new note
C
A N
S L
I M
|