***Last / Change / Volume data in this table is the closing quote data***
Symbol/Exchange
Company Name
Industry Group |
PRICE |
CHANGE
(%Change) |
Day High |
Volume
(% DAV)
(% 50 day avg vol) |
52 Wk Hi
% From Hi |
Featured
Date |
Price
Featured |
Pivot Featured |
|
Max Buy |
BITA
-
NYSE
Bitauto Hldgs Ltd Ads
INTERNET - Internet Information Providers
|
$23.94
|
-0.57
-2.33% |
$25.34
|
499,053
59.33% of 50 DAV
50 DAV is 841,200
|
$28.48
-15.94%
|
9/24/2013
|
$16.40
|
PP = $17.31
|
|
MB = $18.18
|
Most Recent Note - 10/30/2013 2:06:47 PM
G - Down considerably for its 3rd volume-driven loss in the span of 4 sessions. Wider than usual intra-day price swings in recent days is a worrisome sign of uncertainty while it remains very extended from its prior base. Prior highs in the $18 area define initial support to watch on pullbacks.
>>> FEATURED STOCK ARTICLE : Volume-Driven Gains Cleared Latest Pivot Point - 10/2/2013
View all notes |
Set NEW NOTE alert |
CANSLIM.net Company Profile |
SEC
News |
Chart |
Request a new note
C
A N
S L
I M


|
BLOX
-
NYSE
Infoblox Inc
COMPUTER HARDWARE - Networking and Communication Dev
|
$43.70
|
-0.75
-1.69% |
$45.31
|
500,271
61.16% of 50 DAV
50 DAV is 818,000
|
$48.97
-10.75%
|
10/11/2013
|
$43.02
|
PP = $45.60
|
|
MB = $47.88
|
Most Recent Note - 10/30/2013 3:08:22 PM
Y - Retreating today on lighter volume however it has slumped below prior highs in the $45 area defining initial support to watch raising some concern. Prior volume-driven gains above the pivot point triggered a technical buy signal. Disciplined investors avoid chasing "extended" stocks and limit losses by selling any stock that falls more than -7% from their purchase price.
>>> FEATURED STOCK ARTICLE : Finished Another Week Higher With Volume Behind Gains - 10/11/2013
View all notes |
Set NEW NOTE alert |
CANSLIM.net Company Profile |
SEC
News |
Chart |
Request a new note
C
A N
S L
I M
|
CELG
-
NASDAQ
Celgene Corp
DRUGS - Drug Manufacturers - Major
|
$151.31
|
+2.82
1.90% |
$151.45
|
2,365,133
86.95% of 50 DAV
50 DAV is 2,720,200
|
$161.64
-6.40%
|
9/12/2013
|
$149.50
|
PP = $150.02
|
|
MB = $157.52
|
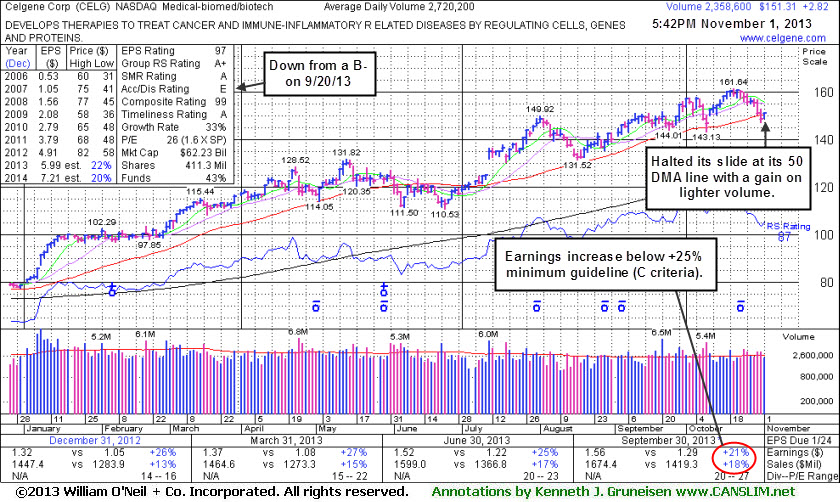
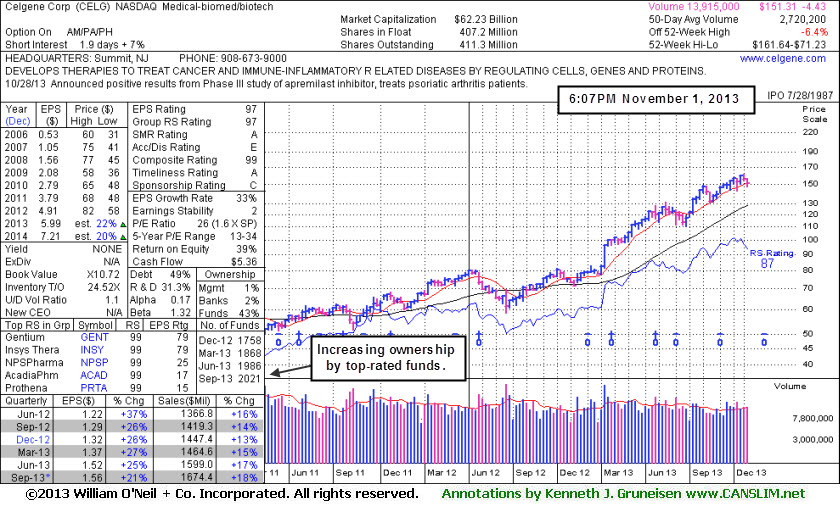
 Most Recent Note - 11/1/2013 6:18:05 PM
G - Halted its slide at its 50 DMA line with today's gain on light volume. The prior low ($143.13 on 10/09/13) is the next technical support level where a subsequent violation may trigger a more worrisome technical sell signal. See the latest FSU analysis for more details and new annotated daily and weekly analysis.
>>> FEATURED STOCK ARTICLE : Testing 50-Day Average Following Sub Par Earnings Increase - 11/1/2013
View all notes |
Set NEW NOTE alert |
CANSLIM.net Company Profile |
SEC
News |
Chart |
Request a new note
C
A N
S L
I M
|
EGOV
-
NASDAQ
N I C Inc
INTERNET - Internet Software and Services
|
$23.47
|
-1.15
-4.67% |
$24.60
|
719,229
249.21% of 50 DAV
50 DAV is 288,600
|
$25.99
-9.70%
|
10/18/2013
|
$25.17
|
PP = $23.66
|
|
MB = $24.84
|
Most Recent Note - 11/1/2013 2:17:55 PM
Y - Considerable loss today with above average volume undercut prior highs raising concerns while testing its 50 DMA line. It stalled following a technical breakout from a "double bottom" base on 10/18/13. Disciplined investors always limit losses by selling any stock that falls more than -7% from their purchase price.
>>> FEATURED STOCK ARTICLE : Technical Breakout From "Double Bottom" Base on 3 Times Average Volume - 10/18/2013
View all notes |
Set NEW NOTE alert |
CANSLIM.net Company Profile |
SEC
News |
Chart |
Request a new note
C
A N
S L
I M
|
FLT
-
NYSE
Fleetcor Technologies
DIVERSIFIED SERVICES - Business/Management Services
|
$114.16
|
-1.19
-1.03% |
$116.95
|
851,036
108.36% of 50 DAV
50 DAV is 785,400
|
$120.51
-5.27%
|
8/19/2013
|
$99.01
|
PP = $100.97
|
|
MB = $106.02
|
Most Recent Note - 10/31/2013 12:35:24 PM
G - Gapped up from support near its 50 DMA line and hit a new 52-week high with today's considerable volume-driven gain. Endured distributional pressure in recent weeks and has not formed a sound base. Reported earnings +30% on +20% sales revenues for the Sep '13 quarter.
>>> FEATURED STOCK ARTICLE : Extended After 13 Weekly Gains in Span of 14 Weeks - 10/7/2013
View all notes |
Set NEW NOTE alert |
CANSLIM.net Company Profile |
SEC
News |
Chart |
Request a new note
C
A N
S L
I M
|
Symbol/Exchange
Company Name
Industry Group |
PRICE |
CHANGE
(%Change) |
Day High |
Volume
(% DAV)
(% 50 day avg vol) |
52 Wk Hi
% From Hi |
Featured
Date |
Price
Featured |
Pivot Featured |
|
Max Buy |
GNRC
-
NYSE
Generac Hldgs Inc
CONSUMER DURABLES - Electronic Equipment
|
$47.63
|
-1.72
-3.49% |
$49.34
|
1,137,926
139.90% of 50 DAV
50 DAV is 813,400
|
$52.32
-8.96%
|
10/24/2013
|
$47.46
|
PP = $44.24
|
|
MB = $46.45
|
Most Recent Note - 11/1/2013 2:21:12 PM
G - Consolidating in a tight range near its 52-week high with volume totals cooling following volume-driven gains. Prior highs in the $44 area define near-term support to watch on pullbacks.
>>> FEATURED STOCK ARTICLE : Consolidating After "Breakway Gap" With 4 Times Average Volume - 10/30/2013
View all notes |
Set NEW NOTE alert |
CANSLIM.net Company Profile |
SEC
News |
Chart |
Request a new note
C
A N
S L
I M
|
JAZZ
-
NASDAQ
Jazz Pharmaceuticals Plc
DRUGS - Biotechnology
|
$90.08
|
-0.66
-0.73% |
$91.74
|
369,840
54.17% of 50 DAV
50 DAV is 682,800
|
$95.24
-5.42%
|
9/30/2013
|
$93.20
|
PP = $89.10
|
|
MB = $93.56
|
Most Recent Note - 10/31/2013 5:46:46 PM
Y- Color code is changed to yellow while quietly consolidating under its "max buy" level after a spurt of volume-driven gains into new high territory.
>>> FEATURED STOCK ARTICLE : Strong Finish With High Volume Indicative of Accumulation - 9/30/2013
View all notes |
Set NEW NOTE alert |
CANSLIM.net Company Profile |
SEC
News |
Chart |
Request a new note
C
A N
S L
I M
|
KORS
-
NYSE
Michael Kors Hldgs Ltd
RETAIL - Apparel Stores
|
$75.43
|
-1.52
-1.98% |
$77.64
|
5,777,177
171.61% of 50 DAV
50 DAV is 3,366,400
|
$78.83
-4.31%
|
8/6/2013
|
$69.66
|
PP = $66.28
|
|
MB = $69.59
|
Most Recent Note - 10/31/2013 12:42:20 PM
G - Small gap down today after trading heavy volume behind recent gains but making limited price progress versus prior highs in the $78 area, noted as signs it has been enduring distributional pressure. Recent low ($70.59 on 10/09/13) defines the next important near-term support area below its 50 DMA line ($74.74 now).
>>> FEATURED STOCK ARTICLE : Extended From Base After Additional Volume-Driven Gains - 9/27/2013
View all notes |
Set NEW NOTE alert |
CANSLIM.net Company Profile |
SEC
News |
Chart |
Request a new note
C
A N
S L
I M
|
LOPE
-
NASDAQ
Grand Canyon Education
DIVERSIFIED SERVICES - Education and; Training Services
|
$46.63
|
-0.64
-1.35% |
$47.08
|
570,820
147.46% of 50 DAV
50 DAV is 387,100
|
$50.48
-7.63%
|
6/19/2013
|
$31.47
|
PP = $34.17
|
|
MB = $35.88
|
Most Recent Note - 10/31/2013 12:47:31 PM
G - Perched near its all-time high today following a gap up on the prior session for a considerable volume-driven gain. Reported earnings +17% on +14% sales revenues for the Sep '13 quarter, its 2nd quarterly comparison with an earnings increase below the +25% minimum guideline (C criteria). Repeatedly noted - "Fundamental concerns remain while technical action has been reassuring."
>>> FEATURED STOCK ARTICLE : Formed Advanced Base But Fundamental Concerns Remain - 10/14/2013
View all notes |
Set NEW NOTE alert |
CANSLIM.net Company Profile |
SEC
News |
Chart |
Request a new note
C
A N
S L
I M
|
MRLN
-
NASDAQ
Marlin Business Services
DIVERSIFIED SERVICES - Rental and Leasing Services
|
$26.44
|
-1.13
-4.10% |
$27.47
|
61,512
194.04% of 50 DAV
50 DAV is 31,700
|
$28.64
-7.68%
|
9/9/2013
|
$23.75
|
PP = $24.03
|
|
MB = $25.23
|
Most Recent Note - 11/1/2013 6:21:37 PM
G - Encountered distributional pressure today with a damaging loss on nearly 2 times average volume. Important near term support is at its 50 DMA line and prior highs in the $26 area.
>>> FEATURED STOCK ARTICLE : Faring Better Than Others While Testing 50-Day Average Line - 10/8/2013
View all notes |
Set NEW NOTE alert |
CANSLIM.net Company Profile |
SEC
News |
Chart |
Request a new note
C
A N
S L
I M
|
Symbol/Exchange
Company Name
Industry Group |
PRICE |
CHANGE
(%Change) |
Day High |
Volume
(% DAV)
(% 50 day avg vol) |
52 Wk Hi
% From Hi |
Featured
Date |
Price
Featured |
Pivot Featured |
|
Max Buy |
NOAH
-
NYSE
Noah Holdings Ltd Ads
FINANCIAL SERVICES - Asset Management
|
$19.84
|
+0.55
2.85% |
$20.14
|
604,667
74.88% of 50 DAV
50 DAV is 807,500
|
$22.99
-13.70%
|
10/15/2013
|
$19.10
|
PP = $18.33
|
|
MB = $19.25
|
Most Recent Note - 10/29/2013 3:28:33 PM
Y - Rebounding today after testing support at its 50 DMA line, and its color code is changed to yellow. Disciplined investors always limit losses by selling if any stock falls more than -7% from their purchase price.
>>> FEATURED STOCK ARTICLE : Finished Strong With Gain on 4 Times Average Volume - 10/15/2013
View all notes |
Set NEW NOTE alert |
CANSLIM.net Company Profile |
SEC
News |
Chart |
Request a new note
C
A N
S L
I M
|
OII
-
NYSE
Oceaneering Intl Inc
ENERGY - Oil and Gas Drilling and Explorati
|
$86.14
|
+0.26
0.30% |
$86.34
|
564,905
86.55% of 50 DAV
50 DAV is 652,700
|
$87.64
-1.71%
|
10/16/2013
|
$83.08
|
PP = $84.74
|
|
MB = $88.98
|
Most Recent Note - 10/29/2013 3:31:30 PM
Y - Rising within close striking distance of its best-ever close with today's 4th consecutive gain helping it rebound above its pivot point. Its 50 DMA line and recent lows define near-term support in the $82 area.
>>> FEATURED STOCK ARTICLE : Forming Set-Up Above 50-Day Moving Average Line - 10/16/2013
View all notes |
Set NEW NOTE alert |
CANSLIM.net Company Profile |
SEC
News |
Chart |
Request a new note
C
A N
S L
I M
|
PCLN
-
NASDAQ
Priceline.Com Inc
INTERNET - Internet Software and Services
|
$1,052.50
|
-1.33
-0.13% |
$1,056.87
|
534,077
100.39% of 50 DAV
50 DAV is 532,000
|
$1,098.70
-4.20%
|
9/13/2013
|
$966.82
|
PP = $995.08
|
|
MB = $1,044.83
|
Most Recent Note - 10/29/2013 6:10:03 PM
G - Hovering near its 52-week high, extended from any sound base. Found support near its 50 DMA line then rallied to new highs with volume-driven gains. see the latest FSU analysis for more details and new annotated daily and weekly graphs.
>>> FEATURED STOCK ARTICLE : Rallied to New Highs Following Pullback to 50-day Average - 10/29/2013
View all notes |
Set NEW NOTE alert |
CANSLIM.net Company Profile |
SEC
News |
Chart |
Request a new note
C
A N
S L
I M
|
PRAA
-
NASDAQ
Portfolio Recovery Assoc
DIVERSIFIED SERVICES - Business/Management Services
|
$59.02
|
-0.43
-0.72% |
$59.84
|
514,642
124.37% of 50 DAV
50 DAV is 413,800
|
$63.96
-7.73%
|
10/17/2013
|
$60.75
|
PP = $61.70
|
|
MB = $64.79
|
Most Recent Note - 10/31/2013 10:57:25 AM
Y - Reported earnings +43% on +31% sales revenues for the Sep '13 quarter. Down today with above average volume, slumping below prior highs and undercutting its 50 DMA line. Volume-driven gains did not trigger a proper new (or add-on) technical buy signal after a new pivot point was cited.
>>> FEATURED STOCK ARTICLE : Wedging to New Highs With Gains Lacking Volume Conviction - 9/26/2013
View all notes |
Set NEW NOTE alert |
CANSLIM.net Company Profile |
SEC
News |
Chart |
Request a new note
C
A N
S L
I M
|
PRLB
-
NYSE
Proto Labs Inc
MANUFACTURING - Small Tools and Accessories
|
$83.88
|
+0.02
0.02% |
$86.45
|
1,063,935
281.24% of 50 DAV
50 DAV is 378,300
|
$88.63
-5.36%
|
7/29/2013
|
$64.86
|
PP = $67.50
|
|
MB = $70.88
|
Most Recent Note - 11/1/2013 12:48:43 PM
G - Reported earnings +28% on +29% sales revenues for the Sep '13 quarter. Up today with volume running at an above average pace. Gapped down on the prior session for a damaging loss with heavy volume, yet rebounded impressively to end nearly unchanged after undercutting its 50 DMA line. Prior low $68.29 on 10/09/13 defines the next important near-term support level.
>>> FEATURED STOCK ARTICLE : Extended Following Additional Volume-Driven Gains - 9/25/2013
View all notes |
Set NEW NOTE alert |
CANSLIM.net Company Profile |
SEC
News |
Chart |
Request a new note
C
A N
S L
I M
|
Symbol/Exchange
Company Name
Industry Group |
PRICE |
CHANGE
(%Change) |
Day High |
Volume
(% DAV)
(% 50 day avg vol) |
52 Wk Hi
% From Hi |
Featured
Date |
Price
Featured |
Pivot Featured |
|
Max Buy |
SFUN
-
NYSE
Soufun Hldgs Ltd Ads A
INTERNET - Internet Information Providers
|
$53.39
|
+0.16
0.30% |
$54.20
|
781,826
53.83% of 50 DAV
50 DAV is 1,452,300
|
$59.50
-10.27%
|
10/17/2013
|
$58.02
|
PP = $53.87
|
|
MB = $56.56
|
Most Recent Note - 10/28/2013 1:48:51 PM
Y - Halted its slide today after undercutting prior highs in the $53 area and slumping into its prior base with 5 consecutive losses marked by ever-increasing volume. Its 50 DMA line ($48.09 now) defines important near-term support to watch.
>>> FEATURED STOCK ARTICLE : Following Great Rally No New Base Has Been Formed - 10/1/2013
View all notes |
Set NEW NOTE alert |
CANSLIM.net Company Profile |
SEC
News |
Chart |
Request a new note
C
A N
S L
I M
|
SSNC
-
NASDAQ
S S & C Technologies
COMPUTER SOFTWARE and SERVICES - Application Software
|
$39.50
|
+0.20
0.51% |
$39.69
|
1,265,151
310.62% of 50 DAV
50 DAV is 407,300
|
$39.94
-1.10%
|
10/22/2013
|
$39.17
|
PP = $40.04
|
|
MB = $42.04
|
Most Recent Note - 11/1/2013 1:02:40 PM
Y - Gapped down today for a volume-driven loss and tested support at its 50 DMA line. Reported earnings +33% on +8% sales revenues for the Sep '13 quarter. Touched a new 52-week high on 10/29/13 but recent gains lacked great volume conviction. Subsequent volume-driven gains above the pivot point may trigger a new (or add-on) technical buy signal.
>>> FEATURED STOCK ARTICLE : Finding Support Near 50-Day Average After Secondary Offering - 10/4/2013
View all notes |
Set NEW NOTE alert |
CANSLIM.net Company Profile |
SEC
News |
Chart |
Request a new note
C
A N
S L
I M
|
SSYS
-
NASDAQ
Stratasys Ltd
COMPUTER HARDWARE - Computer Peripherals
|
$117.60
|
+4.32
3.81% |
$117.72
|
1,055,710
93.29% of 50 DAV
50 DAV is 1,131,700
|
$113.49
3.62%
|
10/11/2013
|
$102.94
|
PP = $105.38
|
|
MB = $110.65
|
Most Recent Note - 10/30/2013 3:27:43 PM
G - Poised for a possible new high close with today's gain challenging its 52-week high. Color code is changed to green while rallying back above its "max buy" level. Found support above prior highs in the $105 area when consolidating after rallying from a "double bottom" base. Recent gains lacked higher volume indicative of heavy institutional buying demand.
>>> FEATURED STOCK ARTICLE : Faltering and Relative Strength Waning After Offering - 10/9/2013
View all notes |
Set NEW NOTE alert |
CANSLIM.net Company Profile |
SEC
News |
Chart |
Request a new note
C
A N
S L
I M
|
STMP
-
NASDAQ
Stamps.Com Inc
INTERNET - Internet Software and Services
|
$44.03
|
-1.41
-3.10% |
$45.63
|
208,682
185.17% of 50 DAV
50 DAV is 112,700
|
$49.40
-10.87%
|
9/24/2013
|
$45.54
|
PP = $46.57
|
|
MB = $48.90
|
Most Recent Note - 10/31/2013 5:40:17 PM
G - Churned above average volume at its 52-week high for the past week while making limited headway above prior highs in the $46 area. Fundamental concerns were raised by waning sales revenues and earnings increases. Reported earnings +24% on +7% sales revenues for the Sep '13 quarter, just below the +25% minimum earnings guideline (C criteria). See the latest FSU analysis for more details and new annotated daily and weekly graphs.
>>> FEATURED STOCK ARTICLE : Fundamental Flaw May Prompt Disciplined Investors to Look Elsewhere - 10/31/2013
View all notes |
Set NEW NOTE alert |
CANSLIM.net Company Profile |
SEC
News |
Chart |
Request a new note
C
A N
S L
I M
|
ULTI
-
NASDAQ
Ultimate Software Group
INTERNET - Internet Software and Services
|
$152.04
|
-2.44
-1.58% |
$155.03
|
226,282
155.95% of 50 DAV
50 DAV is 145,100
|
$153.89
-1.20%
|
10/16/2013
|
$142.95
|
PP = $151.18
|
|
MB = $158.74
|
Most Recent Note - 10/30/2013 1:55:16 PM
G - Hit another new 52-week high with today's 5th consecutive gain, rallying just beyond its "max buy" level and its color code is changed to green while getting extended from its prior base. Volume-driven gains were noted when a technical buy signal was triggered. Disciplined investors avoid chasing extended stocks that have rallied more than +5% above their prior highs.
>>> FEATURED STOCK ARTICLE : Hovering Less Than -5% From 52-Week High - 10/17/2013
View all notes |
Set NEW NOTE alert |
CANSLIM.net Company Profile |
SEC
News |
Chart |
Request a new note
C
A N
S L
I M
|
Symbol/Exchange
Company Name
Industry Group |
PRICE |
CHANGE
(%Change) |
Day High |
Volume
(% DAV)
(% 50 day avg vol) |
52 Wk Hi
% From Hi |
Featured
Date |
Price
Featured |
Pivot Featured |
|
Max Buy |
VRX
-
NYSE
Valeant Pharmaceuticals
DRUGS - Drug Manufacturers - Other
|
$111.20
|
+5.48
5.18% |
$111.42
|
2,534,980
219.12% of 50 DAV
50 DAV is 1,156,900
|
$115.40
-3.64%
|
9/11/2013
|
$100.26
|
PP = $105.50
|
|
MB = $110.78
|
Most Recent Note - 11/1/2013 1:15:57 PM
Y- Reported earnings +24% on +74% sales revenues for the Sep '13 quarter, a notch below the +25% minimum guideline (C criteria). Rebounding today after finding support near prior highs in the $105 area and its 50 DMA line. Subsequent violations may trigger technical sell signals.
>>> FEATURED STOCK ARTICLE : Found Support Above Prior Highs on Pullback - 10/10/2013
View all notes |
Set NEW NOTE alert |
CANSLIM.net Company Profile |
SEC
News |
Chart |
Request a new note
C
A N
S L
I M
|
YNDX
-
NASDAQ
Yandex N V Class A
INTERNET - Internet Information Providers
|
$38.03
|
+1.17
3.17% |
$38.24
|
2,699,603
99.91% of 50 DAV
50 DAV is 2,702,000
|
$42.00
-9.45%
|
9/5/2013
|
$34.24
|
PP = $34.79
|
|
MB = $36.53
|
Most Recent Note - 10/31/2013 11:05:57 AM
G - Slumping just below its 50 DMA line and near an upward trendline connecting its April - October lows with today's 6th consecutive loss raising some concerns. Further deterioration may raise more serious concerns, and its prior low ($34.31 on 10/08/13) defines the next important support level.
>>> FEATURED STOCK ARTICLE : Consolidating After Getting Extended From Sound Base - 10/28/2013
View all notes |
Set NEW NOTE alert |
CANSLIM.net Company Profile |
SEC
News |
Chart |
Request a new note
C
A N
S L
I M
|