You are not logged in.
This means you
CAN ONLY VIEW reports that were published prior to Monday, April 14, 2025.
You
MUST UPGRADE YOUR MEMBERSHIP if you want to see any current reports.
AFTER MARKET UPDATE - MONDAY, OCTOBER 31ST, 2011
Previous After Market Report Next After Market Report >>>
|
|
|
|
DOW |
-276.10 |
11,955.01 |
-2.26% |
|
Volume |
1,143,020,710 |
+13% |
|
Volume |
1,726,834,550 |
-3% |
|
NASDAQ |
-52.74 |
2,684.41 |
-1.93% |
|
Advancers |
556 |
18% |
|
Advancers |
562 |
21% |
|
S&P 500 |
-31.79 |
1,253.30 |
-2.47% |
|
Decliners |
2,466 |
79% |
|
Decliners |
2,009 |
76% |
|
Russell 2000 |
-19.94 |
741.06 |
-2.62% |
|
52 Wk Highs |
37 |
|
|
52 Wk Highs |
21 |
|
|
S&P 600 |
-10.18 |
408.38 |
-2.43% |
|
52 Wk Lows |
8 |
|
|
52 Wk Lows |
29 |
|
|
 |
Major Averages Ended Big Winning October Pulling Back
Kenneth J. Gruneisen - Passed the CAN SLIM® Master's Exam
It was all tricks and no treats for Wall Street on Monday. The major averages fell sharply amid growing concerns of Europe's ability to fund its rescue package. Trading volume was reported slightly higher on the NYSE and slightly lower on the Nasdaq exchange. Decliners led advancers by more than 4-1 on the NYSE and nearly 4-1 on the Nasdaq exchange. New 52-week highs outnumbered new 52-week lows on the NYSE but new lows outnumbered new highs on the Nasdaq exchange. There were 27 high-ranked companies from the CANSLIM.net Leaders List that made new 52-week highs and appeared on the CANSLIM.net BreakOuts Page, down from the prior session total of 53 stocks. There were gains for only 3 of the 16 high-ranked companies currently included on the Featured Stocks Page, a list that has recently been growing again.
Financial stocks dropped in sympathy with European banks and broker MF Global Holdings Ltd (MF) filing bankruptcy. Shares of Morgan Stanley (MS -8.65%), Citigroup Inc (C -7.52%) and JP Morgan Chase & Co (JPM -5.26%) suffered large losses. Yahoo! Inc (YHOO -5.56%) dropped on reports the company may divest Asian assets rather than put itself up for sale. Weakness in energy and material stocks address to Monday's decline. Meanwhile, Humana Inc (HUM +5.65%) rallied after the managed care provider raised guidance for 2011 and forecast 2012 to be better than some analysts had been predicting.
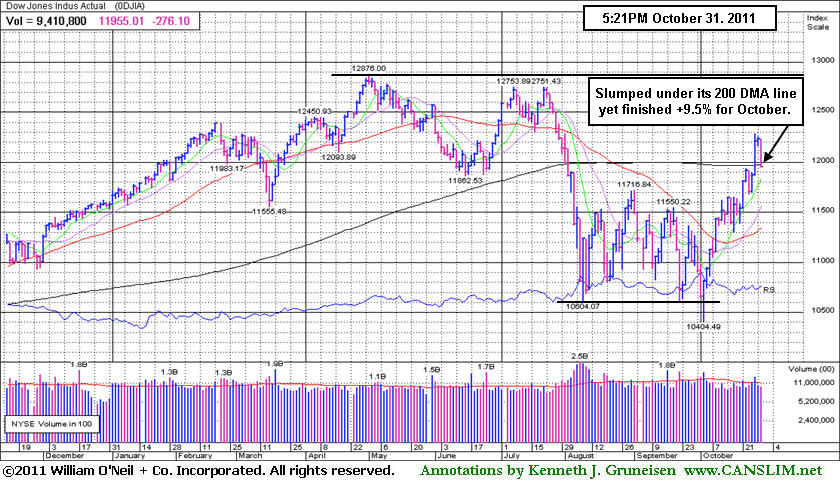
Despite the sell-off, the major averages snapped a five month losing streak with October's rally. For the month, the S&P 500 rallied +10.8% percent to post its best monthly performance since 1974. The Nasdaq rose +11.1% percent.
The October 2011 issue of our monthly newsletter CANSLIM.net News will be published soon with an informative review of current market conditions, leading groups, and best buy candidates. Via the Premium Member Homepage links to all prior reports and webcasts are always available.
PICTURED: The Dow Jones Industrial Average fell 275 points to 11,955 on Monday. For the month the Dow gained +9.5% percent.
|
 Kenneth J. Gruneisen started out as a licensed stockbroker in August 1987, a couple of months prior to the historic stock market crash that took the Dow Jones Industrial Average down -22.6% in a single day. He has published daily fact-based fundamental and technical analysis on high-ranked stocks online for two decades. Through FACTBASEDINVESTING.COM, Kenneth provides educational articles, news, market commentary, and other information regarding proven investment systems that work in good times and bad.
Comments contained in the body of this report are technical opinions only and are not necessarily those of Gruneisen Growth Corp. The material herein has been obtained from sources believed to be reliable and accurate, however, its accuracy and completeness cannot be guaranteed. Our firm, employees, and customers may effect transactions, including transactions contrary to any recommendation herein, or have positions in the securities mentioned herein or options with respect thereto. Any recommendation contained in this report may not be suitable for all investors and it is not to be deemed an offer or solicitation on our part with respect to the purchase or sale of any securities. |
|
 |
Financial, Energy, Gold, and Tech Groups Pulled Back
Kenneth J. Gruneisen - Passed the CAN SLIM® Master's Exam
Financial and energy-linked stocks led the market lower as the Broker/Dealer Index ($XBD -5.03%) and Bank Index ($BKX -4.14%) were smacked with large losses and the Oil Services Index ($OSX -4.36%) and Integrated Oil Index ($XOI -4.36%) also clearly endured selling pressure. The Gold & Silver Index ($XAU -3.24%) fell, not rewarding safe-haven investors. Biotechnology Index ($BTK -3.31%), Internet Index ($IIX -2.69%), Semiconductor Index ($SOX -2.48%), and the Networking Index ($NWX -1.93%) weighed on the major averages with unanimous losses. The Retail Index ($RLX -1.36%) ended lower and the Healthcare Index ($HMO -0.77%) also suffered a small loss.
Charts courtesy www.stockcharts.com
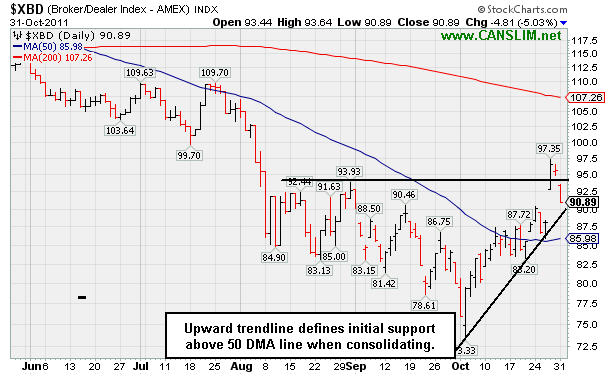
PICTURED: The Broker/Dealer Index ($XBD -5.03%) suffered a big loss on Monday. Its upward trendline defines initial support above 50-day moving average (DMA) line when consolidating.
| Oil Services |
$OSX |
231.48 |
-10.56 |
-4.36% |
-5.56% |
| Healthcare |
$HMO |
2,193.88 |
-17.11 |
-0.77% |
+29.66% |
| Integrated Oil |
$XOI |
1,221.26 |
-55.64 |
-4.36% |
+0.67% |
| Semiconductor |
$SOX |
386.49 |
-9.84 |
-2.48% |
-6.15% |
| Networking |
$NWX |
244.44 |
-4.82 |
-1.93% |
-12.87% |
| Internet |
$IIX |
295.40 |
-8.16 |
-2.69% |
-4.01% |
| Broker/Dealer |
$XBD |
90.89 |
-4.81 |
-5.03% |
-25.20% |
| Retail |
$RLX |
534.53 |
-7.36 |
-1.36% |
+5.14% |
| Gold & Silver |
$XAU |
201.24 |
-6.74 |
-3.24% |
-11.18% |
| Bank |
$BKX |
40.09 |
-1.73 |
-4.14% |
-23.21% |
| Biotech |
$BTK |
1,171.49 |
-40.07 |
-3.31% |
-9.72% |
|
|
|
 |
Perched Near Highs Working on Base-On-Base Type Pattern
Kenneth J. Gruneisen - Passed the CAN SLIM® Master's Exam
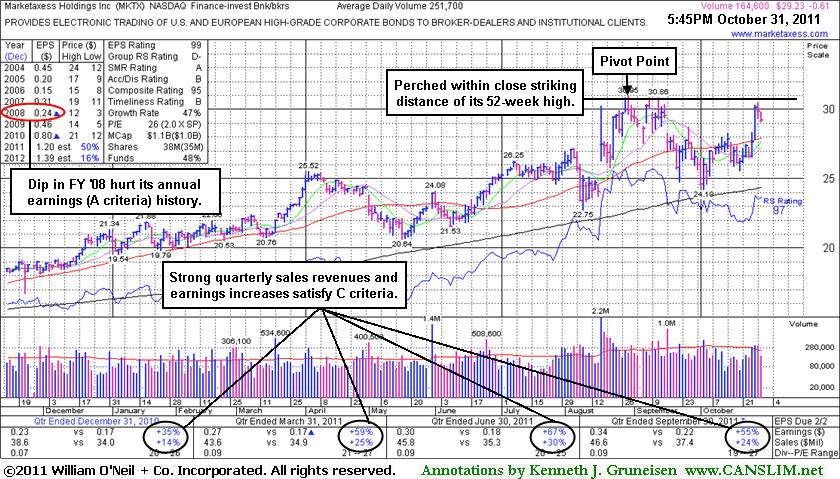
Marketaxess Holdings Inc (MKTX -$0.61 or -2.04% to $29.23) is perched near its 52-week high today after an 8-week base-on-base type consolidation. Its rebound above its 50-day moving average (DMA) line last week helped its outlook, and its color code was changed to yellow in the 10/28/11 mid-day report (read here) as a new pivot point cited was based on its 52-week high plus 10 cents. A subsequent breakout would trigger a new technical buy signal. Fundamentals remain strong and it just reported earnings +55% on +24% sales revenues for the quarter ended September 30, 2011 versus the year ago period.
Its last appearance in this FSU section was on 9/27/11 with an annotated graph under the headline, "Holding its Ground Following News of Small Secondary Offering". Based on weak action it was then dropped from the Featured Stocks list on 10/03/11, yet it found impressive support and stayed well above its 200 DMA line. MKTX has earned high ranks and reasonably satisfies the guidelines concerning quarterly and annual earnings (C and A criteria), however a downturn in FY '08 (see red oval) was previously noted as a flaw. Additionally, the Finance - Investment Bankers industry group currently has a Group Relative Strength rating of D- which indicates the group has been a poor performer rather than a strong leader (L criteria). The number of top-rated funds owning its shares rose from 195 in Dec '10 to 225 in Sep '11, a reassuring sign concerning the I criteria.
All prior notes can be reviewed on the Company Profile page under the "View All Notes" tab. The "Featured Articles and Daily Graphs" tab on the Company Profile page allows members to view all of the previous detailed analysis and annotated graphs published on any stocks we have covered.
 |
|
|
Color Codes Explained :
Y - Better candidates highlighted by our
staff of experts.
G - Previously featured
in past reports as yellow but may no longer be buyable under the
guidelines.
***Last / Change / Volume data in this table is the closing quote data***
Symbol/Exchange
Company Name
Industry Group |
PRICE |
CHANGE
(%Change) |
Day High |
Volume
(% DAV)
(% 50 day avg vol) |
52 Wk Hi
% From Hi |
Featured
Date |
Price
Featured |
Pivot Featured |
|
Max Buy |
AAPL
-
NASDAQ
Apple Inc
COMPUTER HARDWARE - Personal Computers
|
$404.78
|
-0.17
-0.04% |
$409.33
|
13,767,839
62.76% of 50 DAV
50 DAV is 21,937,700
|
$426.70
-5.14%
|
9/16/2011
|
$399.14
|
PP = $404.60
|
|
MB = $424.83
|
 Most Recent Note - 10/31/2011 6:07:50 PM
G - Volume totals have recently been cooling while consolidating above its 50 DMA line and it is now perched just -5.1% off its all-time high. It has not formed a sound base pattern and ownership by top-rated funds has fallen some.
>>> The latest Featured Stock Update with an annotated graph appeared on 10/20/2011. Click here.
View all notes |
Alert me of new notes |
CANSLIM.net Company Profile |
SEC |
Zacks Reports |
StockTalk |
News |
Chart |
Request a new note
C
A N
S L
I M


|
ADS
-
NYSE
Alliance Data Sys Corp
COMPUTER SOFTWARE and SERVICES - Information and Delivery Service
|
$102.44
|
-2.53
-2.41% |
$104.79
|
964,837
99.82% of 50 DAV
50 DAV is 966,600
|
$105.67
-3.06%
|
10/21/2011
|
$97.94
|
PP = $101.15
|
|
MB = $106.21
|
Most Recent Note - 10/31/2011 6:10:34 PM
Y - Pulled back today on near average volume. Its considerable volume-driven gap up gain on 10/27/11 confirmed a technical buy signal. Prior chart highs near $101 define initial support to watch above its 50 DMA line.
>>> The latest Featured Stock Update with an annotated graph appeared on 10/21/2011. Click here.
View all notes |
Alert me of new notes |
CANSLIM.net Company Profile |
SEC |
Zacks Reports |
StockTalk |
News |
Chart |
Request a new note
C
A N
S L
I M
|
ALXN
-
NASDAQ
Alexion Pharmaceuticals
DRUGS - Drug Manufacturers - Other
|
$67.51
|
-0.42
-0.62% |
$68.98
|
1,477,069
95.26% of 50 DAV
50 DAV is 1,550,500
|
$70.42
-4.13%
|
9/15/2011
|
$63.20
|
PP = $60.81
|
|
MB = $63.85
|
Most Recent Note - 10/31/2011 6:13:22 PM
G - Holding its ground today perched near its all-time high. Consolidating in a tight trading range for the past few weeks with no overhead supply remaining to act as resistance. Its 50 DMA line defines chart support to watch on pullbacks.
>>> The latest Featured Stock Update with an annotated graph appeared on 10/18/2011. Click here.
View all notes |
Alert me of new notes |
CANSLIM.net Company Profile |
SEC |
Zacks Reports |
StockTalk |
News |
Chart |
Request a new note
C
A N
S L
I M
|
CELG
-
NASDAQ
Celgene Corp
DRUGS - Drug Manufacturers - Major
|
$64.83
|
-1.36
-2.05% |
$65.76
|
2,973,612
76.20% of 50 DAV
50 DAV is 3,902,400
|
$68.25
-5.01%
|
9/16/2011
|
$61.21
|
PP = $62.59
|
|
MB = $65.72
|
Most Recent Note - 10/31/2011 6:15:16 PM
Y - Pulled back today with a small gap down on below average volume, dipping under its "max buy" level, and its color code is changed to yellow. Reported earnings +36% on +37% sales revenues for the quarter ended September 30, 2011 versus the year ago period.
>>> The latest Featured Stock Update with an annotated graph appeared on 10/14/2011. Click here.
View all notes |
Alert me of new notes |
CANSLIM.net Company Profile |
SEC |
Zacks Reports |
StockTalk |
News |
Chart |
Request a new note
C
A N
S L
I M
|
CEVA
-
NASDAQ
Ceva Inc
ELECTRONICS - Semiconductor - Specialized
|
$31.07
|
-1.95
-5.91% |
$34.00
|
432,596
193.12% of 50 DAV
50 DAV is 224,000
|
$35.60
-12.72%
|
10/28/2011
|
$34.38
|
PP = $35.70
|
|
MB = $37.49
|
Most Recent Note - 10/31/2011 6:18:08 PM
Y - Pulled back today with a loss on above average volume following 2 consecutive volume-driven gains. It gapped up on 10/27/11 and broke out of a "double bottom" base pattern after reporting earnings +86% on +39% sales revenues for the quarter ended September 30, 2011 versus the year ago period. It had slumped below its 200 DMA line during its consolidation since dropped from the Featured Stocks list on 6/17/11. In the 10/28/11 mid-day report (read here) it was featured again in yellow with pivot point based on its 52-week high plus 10 cents while rallying "straight up from the bottom" of a 22-week cup shaped base. No overhead supply remains to act as resistance, and volume-driven gains above its pivot point may trigger a new technical buy signal.
>>> The latest Featured Stock Update with an annotated graph appeared on 5/25/2011. Click here.
View all notes |
Alert me of new notes |
CANSLIM.net Company Profile |
SEC |
Zacks Reports |
StockTalk |
News |
Chart |
Request a new note
C
A N
S L
I M
|
Symbol/Exchange
Company Name
Industry Group |
PRICE |
CHANGE
(%Change) |
Day High |
Volume
(% DAV)
(% 50 day avg vol) |
52 Wk Hi
% From Hi |
Featured
Date |
Price
Featured |
Pivot Featured |
|
Max Buy |
FEIC
-
NASDAQ
F E I Co
ELECTRONICS - Diversified Electronics
|
$39.76
|
-1.95
-4.68% |
$41.50
|
711,561
167.74% of 50 DAV
50 DAV is 424,200
|
$42.25
-5.89%
|
10/28/2011
|
$40.31
|
PP = $40.88
|
|
MB = $42.92
|
Most Recent Note - 10/31/2011 6:18:29 PM
Y - Pulled back today from the new 52-week high hit on the prior session as it triggered a technical buy signal with 4 times average volume while rallying straight up from the bottom of a 16-week cup shaped base. See the latest FSU analysis for more details and an annotated graph.
>>> The latest Featured Stock Update with an annotated graph appeared on 10/28/2011. Click here.
View all notes |
Alert me of new notes |
CANSLIM.net Company Profile |
SEC |
Zacks Reports |
StockTalk |
News |
Chart |
Request a new note
C
A N
S L
I M
|
GNC
-
NYSE
G N C Holdings Inc
RETAIL - Drug Stores
|
$24.75
|
+0.17
0.69% |
$25.28
|
1,843,364
164.56% of 50 DAV
50 DAV is 1,120,200
|
$26.48
-6.53%
|
10/26/2011
|
$24.60
|
PP = $24.80
|
|
MB = $26.04
|
Most Recent Note - 10/31/2011 6:18:56 PM
Y - Perched -6.5% off its 52-week high today. No overhead supply remains to act as resistance after 4 consecutive winning weeks with ever-increasing volume. On 10/25/11 it priced a Secondary Offering after the 10/24/11 gain with more than 4 times average volume triggered a technical buy signal. Strong quarterly and annual earnings history satisfies the C and A criteria.
>>> The latest Featured Stock Update with an annotated graph appeared on 10/26/2011. Click here.
View all notes |
Alert me of new notes |
CANSLIM.net Company Profile |
SEC |
Zacks Reports |
StockTalk |
News |
Chart |
Request a new note
C
A N
S L
I M
|
HMSY
-
NASDAQ
H M S Holdings Corp
COMPUTER SOFTWARE and SERVICES - Healthcare Information Service
|
$24.44
|
+0.84
3.56% |
$25.09
|
1,239,837
232.53% of 50 DAV
50 DAV is 533,200
|
$28.25
-13.47%
|
10/27/2011
|
$26.44
|
PP = $28.37
|
|
MB = $29.79
|
Most Recent Note - 10/31/2011 6:21:29 PM
G - Rebounded toward its 50 and 200 DMA lines with a volume-driven gain today. Last week it reported earnings +31% on +15% sales revenues for the quarter ended September 30, 2011 versus the year ago period, then it gapped down and violated its 50 and 200 DMA lines raising concerns and triggering technical sell signals. In the 10/27/11 mid-day report it was highlighted in yellow with pivot point based on its 52-week high plus 10 cents, however disciplined investors will note that it did not trigger a technical buy signal.
>>> The latest Featured Stock Update with an annotated graph appeared on 5/23/2011. Click here.
View all notes |
Alert me of new notes |
CANSLIM.net Company Profile |
SEC |
Zacks Reports |
StockTalk |
News |
Chart |
Request a new note
C
A N
S L
I M
|
ISRG
-
NASDAQ
Intuitive Surgical Inc
HEALTH SERVICES - Medical Appliances and Equipment
|
$433.86
|
-2.67
-0.61% |
$441.49
|
288,470
62.89% of 50 DAV
50 DAV is 458,700
|
$443.00
-2.06%
|
10/19/2011
|
$424.69
|
PP = $415.29
|
|
MB = $436.05
|
Most Recent Note - 10/31/2011 6:22:33 PM
G - Quietly hovering near its all-time high today after recently wedging above its "max buy" level, getting more extended from its prior base. Prior highs define important support to watch on pullbacks.
>>> The latest Featured Stock Update with an annotated graph appeared on 10/19/2011. Click here.
View all notes |
Alert me of new notes |
CANSLIM.net Company Profile |
SEC |
Zacks Reports |
StockTalk |
News |
Chart |
Request a new note
C
A N
S L
I M
|
LABL
-
NASDAQ
Multi Color Corp
CONSUMER NON-DURABLES - Packaging and Containers
|
$26.51
|
-0.43
-1.60% |
$27.33
|
34,110
61.46% of 50 DAV
50 DAV is 55,500
|
$28.00
-5.32%
|
10/17/2011
|
$27.81
|
PP = $28.10
|
|
MB = $29.51
|
Most Recent Note - 10/31/2011 6:25:08 PM
Y - Quietly perched only -5.3% off its 52-week high. Very little overhead supply remains to act as resistance. Subsequent volume-driven gains into new high ground may trigger a technical buy signal. Last week's low near its 50 DMA line defines near-term support to watch where any violation would raise concerns. Due to report earnings on Tuesday, November 8th before the opening bell.
>>> The latest Featured Stock Update with an annotated graph appeared on 10/17/2011. Click here.
View all notes |
Alert me of new notes |
CANSLIM.net Company Profile |
SEC |
Zacks Reports |
StockTalk |
News |
Chart |
Request a new note
C
A N
S L
I M
|
Symbol/Exchange
Company Name
Industry Group |
PRICE |
CHANGE
(%Change) |
Day High |
Volume
(% DAV)
(% 50 day avg vol) |
52 Wk Hi
% From Hi |
Featured
Date |
Price
Featured |
Pivot Featured |
|
Max Buy |
MG
-
NYSE
Mistras Group Inc
DIVERSIFIED SERVICES - Bulding and Faci;ity Management Services
|
$21.80
|
-0.69
-3.07% |
$22.42
|
142,135
63.60% of 50 DAV
50 DAV is 223,500
|
$23.51
-7.27%
|
10/28/2011
|
$22.49
|
PP = $23.61
|
|
MB = $24.79
|
Most Recent Note - 10/31/2011 6:27:32 PM
Y - Pulled back today on light volume. Near its all-time high, its orderly consolidation was identified as an advanced "3-weeks tight" base. Color code was changed to yellow with new pivot point cited based on its 52-week high plus 10 cents. A subsequent breakout on heavy volume may trigger a new (or add-on) buy signal. Prior highs in the $20-21 area define initial chart support to watch above its 50 DMA line.
>>> The latest Featured Stock Update with an annotated graph appeared on 10/12/2011. Click here.
View all notes |
Alert me of new notes |
CANSLIM.net Company Profile |
SEC |
Zacks Reports |
StockTalk |
News |
Chart |
Request a new note
C
A N
S L
I M
|
MKTX
-
NASDAQ
Marketaxess Holdings Inc
FINANCIAL SERVICES - Investment Brokerage - Nationa
|
$29.23
|
-0.61
-2.04% |
$29.79
|
173,039
66.02% of 50 DAV
50 DAV is 262,100
|
$30.95
-5.55%
|
10/28/2011
|
$29.79
|
PP = $31.05
|
|
MB = $32.60
|
Most Recent Note - 10/31/2011 6:29:42 PM
Y - Perched near its 52-week high today after an 8-week base-on-base pattern. Color code was changed to yellow in the 10/28/11 mid-day report (read here) and new pivot point cited was based on its 52-week high plus 10 cents. A subsequent breakout would trigger a new technical buy signal. Its rebound above its 50 DMA line last week helped its outlook. Fundamentals remain strong and it just reported earnings +55% on +24% sales revenues for the quarter ended September 30, 2011 versus the year ago period. See the latest FSU analysis for more details and a new annotated graph.
>>> The latest Featured Stock Update with an annotated graph appeared on 10/31/2011. Click here.
View all notes |
Alert me of new notes |
CANSLIM.net Company Profile |
SEC |
Zacks Reports |
StockTalk |
News |
Chart |
Request a new note
C
A N
S L
I M
|
OPNT
-
NASDAQ
Opnet Technologies
INTERNET - Internet Software and Services
|
$43.74
|
-0.91
-2.04% |
$44.99
|
141,327
78.04% of 50 DAV
50 DAV is 181,100
|
$45.92
-4.74%
|
10/11/2011
|
$38.45
|
PP = $42.02
|
|
MB = $44.12
|
Most Recent Note - 10/31/2011 6:31:29 PM
Y - Pullback today with below average volume led to a close below its "max buy" level and its color code is changed to yellow again. Prior highs in the $41 area define near-term chart support to watch. Due to report earnings on Wednesday, November 9th.
>>> The latest Featured Stock Update with an annotated graph appeared on 10/25/2011. Click here.
View all notes |
Alert me of new notes |
CANSLIM.net Company Profile |
SEC |
Zacks Reports |
StockTalk |
News |
Chart |
Request a new note
C
A N
S L
I M
|
SWI
-
NYSE
Solarwinds Inc
COMPUTER SOFTWARE and SERVICES - Application Software
|
$28.86
|
+0.43
1.51% |
$29.50
|
2,840,145
274.94% of 50 DAV
50 DAV is 1,033,000
|
$28.60
0.91%
|
10/27/2011
|
$27.78
|
PP = $25.62
|
|
MB = $26.90
|
Most Recent Note - 10/31/2011 6:33:02 PM
G - Up today for a 3rd consecutive volume-driven gain and another new all-time high. Prior highs in the $25-26 area define initial chart support to watch on pullbacks.
>>> The latest Featured Stock Update with an annotated graph appeared on 10/27/2011. Click here.
View all notes |
Alert me of new notes |
CANSLIM.net Company Profile |
SEC |
Zacks Reports |
StockTalk |
News |
Chart |
Request a new note
C
A N
S L
I M
|
UA
-
NYSE
Under Armour Inc Cl A
CONSUMER NON-DURABLES - Textile - Apparel Clothing
|
$84.41
|
-1.42
-1.65% |
$87.40
|
1,262,895
85.07% of 50 DAV
50 DAV is 1,484,500
|
$86.15
-2.02%
|
10/25/2011
|
$82.43
|
PP = $80.80
|
|
MB = $84.84
|
Most Recent Note - 10/31/2011 6:37:35 PM
Y - Touched another new all-time high today but reversed into the red for a small loss on light volume. Color code is changed to yellow after dipping under its "max buy" level. A streak of consecutive volume-driven gains had it slightly extended from the previous base.
>>> The latest Featured Stock Update with an annotated graph appeared on 7/26/2011. Click here.
View all notes |
Alert me of new notes |
CANSLIM.net Company Profile |
SEC |
Zacks Reports |
StockTalk |
News |
Chart |
Request a new note
C
A N
S L
I M
|
Symbol/Exchange
Company Name
Industry Group |
PRICE |
CHANGE
(%Change) |
Day High |
Volume
(% DAV)
(% 50 day avg vol) |
52 Wk Hi
% From Hi |
Featured
Date |
Price
Featured |
Pivot Featured |
|
Max Buy |
V
-
NYSE
Visa Inc Cl A
DIVERSIFIED SERVICES - Business/Management Services
|
$93.26
|
-1.84
-1.93% |
$95.87
|
4,456,429
81.20% of 50 DAV
50 DAV is 5,488,100
|
$95.75
-2.60%
|
10/24/2011
|
$94.21
|
PP = $94.85
|
|
MB = $99.59
|
Most Recent Note - 10/31/2011 6:40:46 PM
Y - Reversed into the red again today after touching a new 52-week high and briefly trading above its pivot point. It did not trigger a proper new technical buy signal since recently highlighted in yellow as an ideal looking set-up. Reported earnings +34% on +13% sales revenues for the quarter ended September 30, 2011 versus the year ago period, beating earnings expectations while it missed on revenues.
>>> The latest Featured Stock Update with an annotated graph appeared on 10/24/2011. Click here.
View all notes |
Alert me of new notes |
CANSLIM.net Company Profile |
SEC |
Zacks Reports |
StockTalk |
News |
Chart |
Request a new note
C
A N
S L
I M
|
|
|
|
THESE ARE NOT BUY RECOMMENDATIONS!
Comments contained in the body of this report are technical
opinions only. The material herein has been obtained
from sources believed to be reliable and accurate, however,
its accuracy and completeness cannot be guaranteed.
This site is not an investment advisor, hence it does
not endorse or recommend any securities or other investments.
Any recommendation contained in this report may not
be suitable for all investors and it is not to be deemed
an offer or solicitation on our part with respect to
the purchase or sale of any securities. All trademarks,
service marks and trade names appearing in this report
are the property of their respective owners, and are
likewise used for identification purposes only.
This report is a service available
only to active Paid Premium Members.
You may opt-out of receiving report notifications
at any time. Questions or comments may be submitted
by writing to Premium Membership Services 665 S.E. 10 Street, Suite 201 Deerfield Beach, FL 33441-5634 or by calling 1-800-965-8307
or 954-785-1121.
|
|
|

