You are not logged in.
This means you
CAN ONLY VIEW reports that were published prior to Monday, February 26, 2024.
You
MUST UPGRADE YOUR MEMBERSHIP if you want to see any current reports.
AFTER MARKET UPDATE - TUESDAY, OCTOBER 30TH, 2018
Previous After Market Report Next After Market Report >>>
|
|
|
|
DOW |
+431.72 |
24,874.64 |
+1.77% |
|
Volume |
1,172,513,380 |
+9% |
|
Volume |
2,664,152,320 |
-1% |
|
NASDAQ |
+111.36 |
7,161.65 |
+1.58% |
|
Advancers |
2,098 |
70% |
|
Advancers |
2,080 |
68% |
|
S&P 500 |
+41.38 |
2,682.63 |
+1.57% |
|
Decliners |
899 |
30% |
|
Decliners |
996 |
32% |
|
Russell 2000 |
+29.33 |
1,506.64 |
+1.99% |
|
52 Wk Highs |
28 |
|
|
52 Wk Highs |
19 |
|
|
S&P 600 |
+20.81 |
950.90 |
+2.24% |
|
52 Wk Lows |
337 |
|
|
52 Wk Lows |
226 |
|
|
 |
Major Indices Posted Gains With Slight Increase in Leadership
Kenneth J. Gruneisen - Passed the CAN SLIM® Master's Exam
Stocks finished higher Tuesday. The Dow jumped 431 points to 24874, while the S&P 500 gained 41 points to 2682. The Nasdaq Composite advanced 111 points to 7161. The volume totals reported were higher on the NYSE and near the prior session on the Nasdaq exchange versus the prior session. Advancers led decliners by a 2-1 margin on the NYSE and on the Nasdaq exchange. There were 9 high-ranked companies from the Leaders List that made new 52-week highs and were listed on the BreakOuts Page, versus 4 on the prior session, as market leadership remained thin but improved. New 52-week lows totals easily outnumbered new 52-week highs on the NYSE and Nasdaq exchange. Recent reports have noted that the major indices (M criteria) have shown action indicative of a market correction while leadership disappeared. During market corrections investors should have a bias toward selling stocks on a case-by-case basis as technical sell signals occur, raising cash levels while reducing market exposure. The Featured Stocks Page provides the most timely analysis on high-ranked leaders. Charts used courtesy of www.stockcharts.com
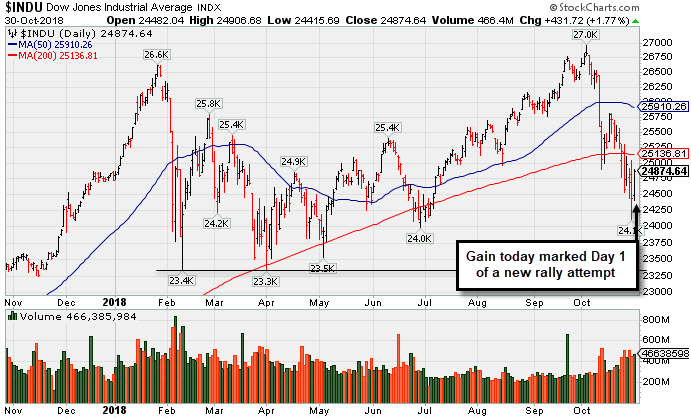
PICTURED: The Dow Jones Industrial Average and other major indices rose on Tuesday, marking Day 1 on a new rally attempt. Technically, the market remains in a "correction" under the fact-based investment system. Members have been reminded repeatedly that new buying efforts are against the rules until a convincing follow-through day occurs. A "follow-through day" of solid gains (at least +1%) from one or more of the major indices, backed by higher volume, and coupled with a leadership expansion (increase in new 52-week highs), are all of the necessary elements required to confirm a new rally. Until then, patience and discipline are paramount.
The major averages pared losses from the previous session as positive corporate earnings updates buoyed investor sentiment. On the data front, a release from the Conference Board revealed U.S. consumer confidence reached the highest level since 2000 in October after the prior month’s reading was revised downwards. Separately, the S&P CoreLogic Case-Shiller 20-city home price index rose at the slowest rate since 2016 during the month of August.
All 11 S&P 500 sectors finished in positive territory. Communication Services was up the most as shares of Facebook (FB +2.91%) rose. Consumer Staples also outperformed as Coca-Cola (KO +2.52%) rose after the beverage-maker topped analyst earnings estimates. Semi-conductors rebounded from recent weakness as Intel (INTC +5.20%) and NVIDIA (NVDA +9.36%) rose. In other earnings, General Electric (GE -8.78%) fell after the industrial conglomerate fell short of analyst projections and cut its dividend by 92% to $0.01. Under Armour (UA +27.75%) surged after the athletic apparel maker topped revenue forecasts.
Treasuries were weaker with the yield on the 10-year note up three basis points to 3.11%. In commodities, WTI crude slipped 1.3% to $66.15/barrel. COMEX gold fell 0.2% at $1,225.10/ounce amid a stronger dollar. |
 Kenneth J. Gruneisen started out as a licensed stockbroker in August 1987, a couple of months prior to the historic stock market crash that took the Dow Jones Industrial Average down -22.6% in a single day. He has published daily fact-based fundamental and technical analysis on high-ranked stocks online for two decades. Through FACTBASEDINVESTING.COM, Kenneth provides educational articles, news, market commentary, and other information regarding proven investment systems that work in good times and bad.
Comments contained in the body of this report are technical opinions only and are not necessarily those of Gruneisen Growth Corp. The material herein has been obtained from sources believed to be reliable and accurate, however, its accuracy and completeness cannot be guaranteed. Our firm, employees, and customers may effect transactions, including transactions contrary to any recommendation herein, or have positions in the securities mentioned herein or options with respect thereto. Any recommendation contained in this report may not be suitable for all investors and it is not to be deemed an offer or solicitation on our part with respect to the purchase or sale of any securities. |
|
 |
Financial, Tech, Retail, and Commodity-Linked Groups Rose
Kenneth J. Gruneisen - Passed the CAN SLIM® Master's Exam
The Bank Index ($BKX +1.38%) and Broker/Dealer Index ($XBD +2.11%) both posted solid gains and the Retail Index ($RLX +0.69%) also edged higher. The tech sector had a positive bias as the Semiconductor Index ($SOX +4.16%) and the Networking Index ($NWX +2.28%) posted solid gains and Biotech Index ($BTK +1.12%) also rose. Commodity-linked groups also had a positive bias as the Integrated Oil Index ($XOI +2.43%) and the Oil Services Index ($OSX +1.56%) both outpaced the Gold & Silver Index ($XAU +1.14%).
Charts courtesy of www.stockcharts.com
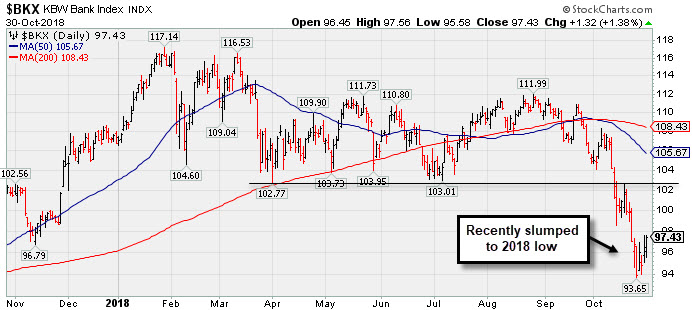 PICTURED: The Bank Index ($BKX +1.38%) recently slumped to new 2018 lows.
| Oil Services |
$OSX |
119.34 |
+1.83 |
+1.56% |
-20.20% |
| Integrated Oil |
$XOI |
1,355.14 |
+32.09 |
+2.43% |
+1.47% |
| Semiconductor |
$SOX |
1,187.57 |
+47.42 |
+4.16% |
-5.23% |
| Networking |
$NWX |
504.17 |
+11.26 |
+2.28% |
+2.78% |
| Broker/Dealer |
$XBD |
255.71 |
+5.28 |
+2.11% |
-3.59% |
| Retail |
$RLX |
2,052.89 |
+14.03 |
+0.69% |
+18.41% |
| Gold & Silver |
$XAU |
65.44 |
+0.74 |
+1.14% |
-23.26% |
| Bank |
$BKX |
97.43 |
+1.33 |
+1.38% |
-8.70% |
| Biotech |
$BTK |
4,505.87 |
+49.95 |
+1.12% |
+6.72% |
|
|
|
 |
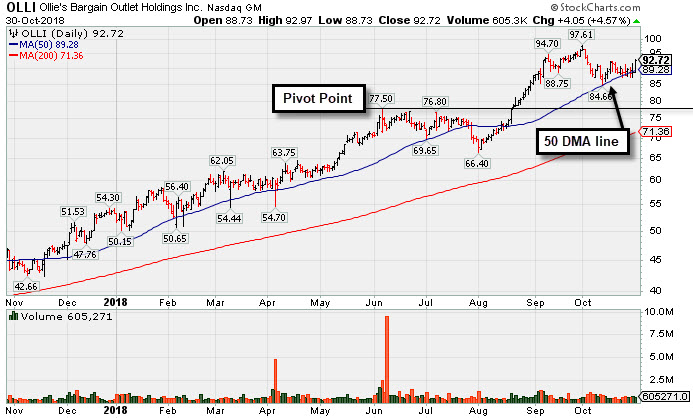
Finding Support Near its 50-Day Moving Average
Kenneth J. Gruneisen - Passed the CAN SLIM® Master's Exam
Ollie's Bargain Outlet (OLLI +$4.05 or +4.57% to $92.72) found support recently near its 50-day moving average (DMA) line ($89.28). It has not formed a sound new base of sufficient length. Fundamentals remain strong. OLLI was last shown in this FSU section on 10/09/18 with an annotated graph under the headline, "Encountered Distributional Pressure After a Great Rally".
Recently it reported earnings +48% on +13% sales revenues for the Jul '18 quarter, continuing its strong earnings track record and meeting the +25% minimum earnings guideline (C criteria). It has earned a very strong 98 Earnings Per Share (EPS) rating.
The Retail - Discount & Variety firm traded up as much as +269.5% since highlighted in yellow with a pivot point based on its 4/28/16 high plus 10 cents in 7/19/16 mid-day report (read here). OLLI completed its $16 IPO on 7/16/15. It completed a Secondary Offerings on 6/06/16 and 2/18/16.
The number of top-rated funds owning its shares rose from 98 in Sep '15 to 510 in Sep '18, a reassuring sign concerning the I criteria. Its current Up/Down Volume ratio of 1.3 is an unbiased indication its shares have been neutral concerning accumulation or distributional pressure over the past 50 days. The small supply of only 62.7 million shares outstanding (S criteria) can contribute to greater price volatility in the event of institutional buying or selling.
|
|
|
Color Codes Explained :
Y - Better candidates highlighted by our
staff of experts.
G - Previously featured
in past reports as yellow but may no longer be buyable under the
guidelines.
***Last / Change / Volume data in this table is the closing quote data***
Symbol/Exchange
Company Name
Industry Group |
PRICE |
CHANGE
(%Change) |
Day High |
Volume
(% DAV)
(% 50 day avg vol) |
52 Wk Hi
% From Hi |
Featured
Date |
Price
Featured |
Pivot Featured |
|
Max Buy |
MPX
-
NYSE
Marine Products Corp
AUTOMOTIVE - Recreational Vehicles
|
$21.01
|
+0.60
2.94% |
$21.28
|
32,682
83.80% of 50 DAV
50 DAV is 39,000
|
$24.82
-15.35%
|
10/24/2018
|
$23.00
|
PP = $24.92
|
|
MB = $26.17
|
Most Recent Note - 10/26/2018 5:44:01 PM
G - Color code is changed to green after slumping further below its 50 DMA line ($21.50) today with a 3rd volume-driven loss in the span of 4 sessions. A prompt rebound above the 50 DMA line is needed for its outlook to improve. Finished weak after highlighted in yellow with pivot point cited based on its 9/12/18 high plus 10 cents in the 10/24/18 mid-day report. See the latest FSU analysis for more details and an annotated graph.
>>> FEATURED STOCK ARTICLE : Weak Finish Amid Widely Negative Market Environment - 10/24/2018 |
View all notes |
Set NEW NOTE alert |
Company Profile |
SEC
News |
Chart |
Request a new note
C
A
S
I |
GMED
-
NYSE
Globus Medical Inc Cl A
CHEMICALS - Specialty Chemicals
|
$52.42
|
+0.06
0.11% |
$53.23
|
466,696
71.14% of 50 DAV
50 DAV is 656,000
|
$57.55
-8.91%
|
9/26/2018
|
$56.11
|
PP = $57.65
|
|
MB = $60.53
|
Most Recent Note - 10/25/2018 5:54:22 PM
G - Sputtering below its 50 DMA line ($52.91) after recent volume-driven losses hurt its outlook. A rebound and subsequent gains above the pivot point backed by more than +40% above average volume are needed to trigger a proper technical buy signal.
>>> FEATURED STOCK ARTICLE : Consolidating After Rally at 200-Day Moving Average Line - 10/22/2018 |
View all notes |
Set NEW NOTE alert |
Company Profile |
SEC
News |
Chart |
Request a new note
C
A
S
I |
ZBRA
-
NASDAQ
Zebra Tech Corp Cl A
COMPUTER HARDWARE - Computer Peripherals
|
$163.42
|
+7.94
5.11% |
$163.68
|
397,057
103.40% of 50 DAV
50 DAV is 384,000
|
$179.47
-8.94%
|
8/7/2018
|
$164.26
|
PP = $161.82
|
|
MB = $169.91
|
 Most Recent Note - 10/30/2018 5:12:03 PM
G - Rebounded toward its 50 DMA line ($168). Overhead supply remains up to the $179 level. Found support in recent weeks after a pullback near its 200 DMA line.
>>> FEATURED STOCK ARTICLE : Zebra Tech Sputtering Near 50-Day Moving Average - 10/23/2018 |
View all notes |
Set NEW NOTE alert |
Company Profile |
SEC
News |
Chart |
Request a new note
C
A
S
I |
CME
-
NASDAQ
C M E Group Inc
DIVERSIFIED SERVICES - Business/Management Services
|
$182.47
|
+3.08
1.72% |
$182.71
|
1,730,747
116.31% of 50 DAV
50 DAV is 1,488,000
|
$183.79
-0.72%
|
10/4/2018
|
$179.29
|
PP = $177.45
|
|
MB = $186.32
|
Most Recent Note - 10/26/2018 5:40:14 PM
Y - Remains above its 50 DMA line ($174.79) after recently reporting earnings +22% on +2% sales revenues for the Sep '18 quarter, below the +25% minimum earnings guideline (C criteria), raising fundamental concerns. Broad market weakness (M criteria) is also a serious concern. The 50 DMA line and prior low ($170.04 on 9/28/18) define important near-term support. See the latest FSU analysis for more details and a new annotated graph.
>>> FEATURED STOCK ARTICLE : Perched Near High After Latest Earnings Report Below +25% Minimum - 10/26/2018 |
View all notes |
Set NEW NOTE alert |
Company Profile |
SEC
News |
Chart |
Request a new note
C
A
S
I |
DPZ
-
NYSE
Dominos Pizza Inc
Retail-Restaurants
|
$266.23
|
+9.74
3.80% |
$266.79
|
769,871
137.23% of 50 DAV
50 DAV is 561,000
|
$305.34
-12.81%
|
8/13/2018
|
$288.60
|
PP = $293.91
|
|
MB = $308.61
|
Most Recent Note - 10/29/2018 6:01:35 PM
G - Reversed early gains and suffered another loss today on near average volume testing its 200 DMA line ($256.20). A subsequent rebound above the 50 DMA line ($282.42) is needed for its outlook to improve. The prior low ($253.63 on 7/31/18) and 200 DMA line define important near-term support to watch. Reported earnings +54% on +22% sales revenues for the Sep '18 quarter, continuing its strong earnings track record.
>>> FEATURED STOCK ARTICLE : Sank Below 50 DMA Line Ahead of Earnings News - 10/15/2018 |
View all notes |
Set NEW NOTE alert |
Company Profile |
SEC
News |
Chart |
Request a new note
C
A
S
I |
Symbol/Exchange
Company Name
Industry Group |
PRICE |
CHANGE
(%Change) |
Day High |
Volume
(% DAV)
(% 50 day avg vol) |
52 Wk Hi
% From Hi |
Featured
Date |
Price
Featured |
Pivot Featured |
|
Max Buy |
FIVE
-
NASDAQ
Five Below Inc
Retail-DiscountandVariety
|
$115.32
|
+3.47
3.10% |
$115.61
|
637,987
65.17% of 50 DAV
50 DAV is 979,000
|
$136.13
-15.29%
|
7/6/2018
|
$98.90
|
PP = $104.09
|
|
MB = $109.29
|
Most Recent Note - 10/25/2018 5:59:33 PM
G - A rebound above the 50 DMA line ($120) still is needed for its outlook to improve. Sputtering above the prior high ($109.09 on 7/19/18) which defines the next important support level to watch. See the latest FSU analysis for more details and a new annotated graph.
>>> FEATURED STOCK ARTICLE : Sputtering Below 50-Day Moving Average Near Prior High - 10/25/2018 |
View all notes |
Set NEW NOTE alert |
Company Profile |
SEC
News |
Chart |
Request a new note
C
A
S
I |
HQY
-
NASDAQ
Healthequity Inc
COMPUTER SOFTWARE and SERVICES - Healthcare Information Service
|
$87.52
|
+2.59
3.05% |
$87.69
|
642,284
77.20% of 50 DAV
50 DAV is 832,000
|
$99.99
-12.47%
|
8/13/2018
|
$82.39
|
PP = $83.44
|
|
MB = $87.61
|
Most Recent Note - 10/25/2018 6:00:53 PM
G - Posted a big gain today with higher (but still below average) volume. A rebound above the 50 DMA line ($90.36) is needed for its outlook to improve.
>>> FEATURED STOCK ARTICLE : Below 50-Day Moving Average Which May Act as Resistance - 10/16/2018 |
View all notes |
Set NEW NOTE alert |
Company Profile |
SEC
News |
Chart |
Request a new note
C
A
S
I |
OLLI
-
NASDAQ
Ollie's Bargain Outlet
Retail-DiscountandVariety
|
$92.72
|
+4.05
4.57% |
$92.97
|
605,595
89.59% of 50 DAV
50 DAV is 676,000
|
$97.61
-5.01%
|
7/12/2018
|
$74.43
|
PP = $77.60
|
|
MB = $81.48
|
Most Recent Note - 10/30/2018 5:14:09 PM
G - Found support near the 50 DMA line ($89.28). The recent low ($84.66 on 10/11/18) defines the next important support to watch. Fundamentals remain strong. See the latest FSU analysis for more details and a new annotated graph.
>>> FEATURED STOCK ARTICLE : Finding Support Near its 50-Day Moving Average - 10/30/2018 |
View all notes |
Set NEW NOTE alert |
Company Profile |
SEC
News |
Chart |
Request a new note
C
A
S
I |
|
|
|
THESE ARE NOT BUY RECOMMENDATIONS!
Comments contained in the body of this report are technical
opinions only. The material herein has been obtained
from sources believed to be reliable and accurate, however,
its accuracy and completeness cannot be guaranteed.
This site is not an investment advisor, hence it does
not endorse or recommend any securities or other investments.
Any recommendation contained in this report may not
be suitable for all investors and it is not to be deemed
an offer or solicitation on our part with respect to
the purchase or sale of any securities. All trademarks,
service marks and trade names appearing in this report
are the property of their respective owners, and are
likewise used for identification purposes only.
This report is a service available
only to active Paid Premium Members.
You may opt-out of receiving report notifications
at any time. Questions or comments may be submitted
by writing to Premium Membership Services 665 S.E. 10 Street, Suite 201 Deerfield Beach, FL 33441-5634 or by calling 1-800-965-8307
or 954-785-1121.
|
|
|