You are not logged in.
This means you
CAN ONLY VIEW reports that were published prior to Monday, April 14, 2025.
You
MUST UPGRADE YOUR MEMBERSHIP if you want to see any current reports.
AFTER MARKET UPDATE - FRIDAY, OCTOBER 30TH, 2009
Previous After Market Report Next After Market Report >>>
|
|
|
|
DOW |
-249.85 |
9,712.73 |
-2.51% |
|
Volume |
1,654,782,130 |
+14% |
|
Volume |
2,859,609,030 |
+20% |
|
NASDAQ |
-52.44 |
2,045.11 |
-2.50% |
|
Advancers |
404 |
13% |
|
Advancers |
521 |
18% |
|
S&P 500 |
-29.92 |
1,036.19 |
-2.81% |
|
Decliners |
2,652 |
85% |
|
Decliners |
2,222 |
78% |
|
Russell 2000 |
-17.45 |
562.77 |
-3.01% |
|
52 Wk Highs |
31 |
|
|
52 Wk Highs |
21 |
|
|
S&P 600 |
-8.84 |
299.07 |
-2.87% |
|
52 Wk Lows |
15 |
|
|
52 Wk Lows |
35 |
|
|
 |
Market Correction Takes Hold As Heavy Distribution Hits Virtually All Groups
Adam Sarhan, Contributing Writer,
The major averages ended October on a very weak tick as the 7-month rally in equities came to an abrupt end. Volume was reported higher on the NYSE and Nasdaq exchange, indicating large institutional investors were aggressively selling stocks while the indices lost ground. Decliners trumped advancers by a 6-to-1 ratio on the NYSE and by a 4-to-1 ratio on the Nasdaq exchange. There were 3 high-ranked companies from the CANSLIM.net Leaders List making a new 52-week high and appearing on the CANSLIM.net BreakOuts Page, higher than the 1 issue that appeared on the prior session. In terms of new leadership, the week's action was a sign that there is none showing up. New 52-week highs still outnumbered new 52-week lows on the NYSE, however new lows outnumbered new highs on Nasdaq exchange for a third consecutive day.
The sell off began on Wednesday October 21, 2009 when all the major averages had a "negative reversal" after hitting a fresh 2009 high. The market spent the next couple trading sessions tracing out negative reversals as the distribution day count began to rise. By Monday, the 7-month rally was under serious pressure as the major averages and a bunch of leading stocks began to fail. On Tuesday, stocks ended mixed but the Small cap Russell 2000 index sliced below support (50 DMA line & 7-month upward trendline). On Wednesday, October 28, 2009 the market clearly slid into a correction when the S&P 500, Nasdaq 100, Nasdaq Composite and NYSE Composite indexes collectively closed below support. This marked the end of the 34-week rally which began on the March 12, 2009 follow-through day and helped send the major averages to one of their strongest 7-month rallies in history!
Stocks bounced back on Thursday but volume, an important indicator of institutional sponsorship, was lighter than the prior session which suggested the bulls were getting tired. Thursday's rally marked Day 1 of a new rally attempt. However, the bears showed up on Friday and smacked stocks sending all of the major averages below Thursday's lows which negated the rally attempt and reset the Day count. The sell-off was so intense that it sent the S&P 500, Nasdaq Composite, Nasdaq 100, NYSE Composite and small cap Russell 2000 Index collectively below their respective 50 DMA lines and 7-month upward trendlines. In addition, all these popular averages turned negative for the month which snapped a 7-month winning streak.
Right now the market is in a correction, which means adopting a strong defensive stance is paramount. Avoid new buys, since history shows us 3 out of 4 growth stocks follow the major averages, and tighten your stops to protect your capital. Remember to always keep your losses small and never argue with the tape. Looking forward, a new rally will be confirmed only when the market manages to produce a sound follow-through day. Until then, patience is king.
PICTURED: The Nasdaq Composite snapped a 7-month winning streak by ending lower in October.
|
|
|
 |
Weakness In Financial Groups Hurts Broader Market Outlook
Kenneth J. Gruneisen - Passed the CAN SLIM® Master's Exam
Financial stocks, retail stocks, tech stocks and commodity-linked stocks collectively fell for large loss on Friday, closing out a very ugly week for the overall market. Energy shares faced pressure and drove the Oil Services Index ($OSX -4.37%) and Integrated Oil Index ($XOI -3.37%) lower, meanwhile the Gold & Silver Index ($XAU -3.33%) was a nonconstructive safe haven area once again. The tech sector slumped badly too as the Networking Index ($NWX -4.03%), Semiconductor Index ($SOX -3.47%), Internet Index ($IIX -2.88%), and Biotechnology Index ($BTK -2.11%) each fell more than -2%. The Retail Index ($RLX -2.73%) dove toward its 50-day moving average (DMA) line, closing near its session low along with the majority of groups. The Healthcare Index ($HMO -2.64%) encountered resistance near its 50 DMA line and reversed an early gain.
Charts courtesy www.stockcharts.com

PICTURED 1: The Bank Index ($BKX -4.95%) ended -14.3% of its October high after undercutting its September - October chart lows.
Charts courtesy www.stockcharts.com
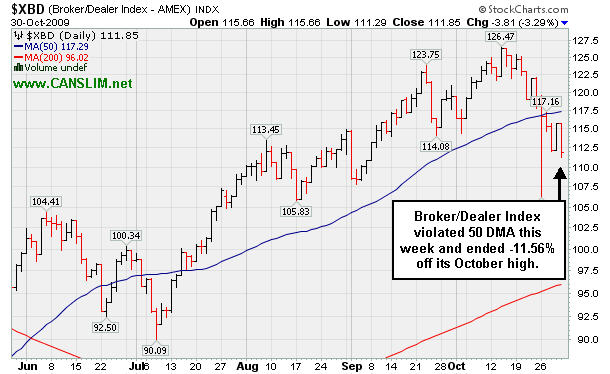
PICTURED 2: The Broker/Dealer Index ($XBD -3.29%) has also undercut its 50 DMA line for the first time in a few months, raising concerns. In recent reports we have illustrated repeatedly how the financial group is faltering, which longtime members should know bodes poorly for the overall market outlook.
| Oil Services |
$OSX |
187.30 |
-8.56 |
-4.37% |
+54.30% |
| Healthcare |
$HMO |
1,144.48 |
-30.98 |
-2.64% |
+19.19% |
| Integrated Oil |
$XOI |
1,052.80 |
-36.76 |
-3.37% |
+7.46% |
| Semiconductor |
$SOX |
296.61 |
-10.65 |
-3.47% |
+39.80% |
| Networking |
$NWX |
218.30 |
-9.17 |
-4.03% |
+51.71% |
| Internet |
$IIX |
212.34 |
-6.29 |
-2.88% |
+58.74% |
| Broker/Dealer |
$XBD |
111.85 |
-3.81 |
-3.29% |
+44.38% |
| Retail |
$RLX |
380.39 |
-10.67 |
-2.73% |
+36.21% |
| Gold & Silver |
$XAU |
156.64 |
-5.40 |
-3.33% |
+26.48% |
| Bank |
$BKX |
42.23 |
-2.20 |
-4.95% |
-4.72% |
| Biotech |
$BTK |
820.99 |
-17.71 |
-2.11% |
+26.86% |
|
|
|
 |
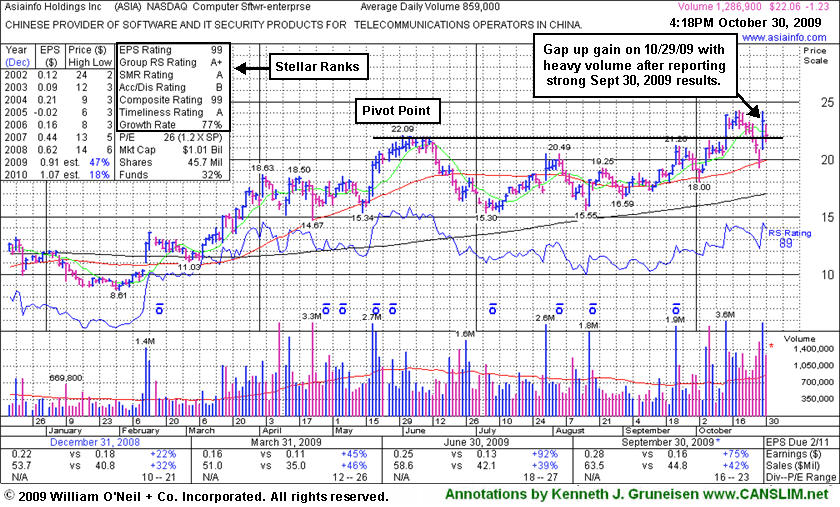
Failed Breakout Followed By Bullish Gap Up On Strong Earnings and Guidance
Kenneth J. Gruneisen - Passed the CAN SLIM® Master's Exam
AsiaInfo Holdings, Inc. (ASIA -$1.23 or -5.28% to $22.06) fell for another considerable loss with above average volume today, consolidating following a 10/29/09 gap up for a big gain after reporting solid earnings for the period ended Sept 30, 2009 that beat expectations as it also raised guidance. It found prompt support near its 50-day moving average (DMA) line, a textbook chart support level, after a 7 session losing streak with losses on high volume triggered technical sell signals and briefly negated its latest breakout. Its color code was changed to yellow based on its impressive fundamentals and technical strength. However, market conditions (M criteria) are arguing against new buying efforts, and an overriding concern for disciplined investors until a new follow-through-day occurs.
Disciplined entries and exits are critical to investors' success with the investment system. ASIA was featured in the August 2009 CANSLIM.net News (read here).
|
|
|
Color Codes Explained :
Y - Better candidates highlighted by our
staff of experts.
G - Previously featured
in past reports as yellow but may no longer be buyable under the
guidelines.
***Last / Change / Volume quote data in this table corresponds with the timestamp on the note***
Symbol/Exchange
Company Name
Industry Group |
Last |
Chg. |
Vol
% DAV |
Date Featured |
Price Featured |
Latest Pivot Point
Featured |
Status |
| Latest Max Buy Price |
ARO
- NYSE
Aeropostale Inc
RETAIL - Apparel Stores
|
$37.53
|
-1.43
|
4,003,579
153% DAV
2,609,200
|
8/21/2009
(Date
Featured) |
$39.21
(Price
Featured) |
PP = $44.95 |
G |
| MB = $47.20 |
Most Recent Note - 10/30/2009 4:43:17 PM
G - It is -16% off its 9/22/09 all-time high of $44.85. Down considerably on very heavy volume today following the week's previously noted technical sell signals. The deterioration raises concerns, putting it squarely back in its prior base, negating its 8/21/09 technical breakout with a close below July's high close.
>>> The latest Featured Stock Update with an annotated graph appeared on 10/22/2009. click here.
|
|
C
A
S
I |
News |
Chart |
SEC
View all notes Alert
me of new notes
Company
Profile
|
ARST
-
|
$24.72
|
-0.49
|
436,331
65% DAV
670,900
|
9/1/2009
(Date
Featured) |
$19.91
(Price
Featured) |
PP = $20.90 |
G |
| MB = $21.95 |
Most Recent Note - 10/30/2009 4:45:42 PM
G - Small loss today on lighter volume, hovering quietly near all-time highs. ARST is up +24% since it was first featured in yellow at $19.91 in the 9/01/09 mid-day report with an annotated daily graph (read here).
>>> The latest Featured Stock Update with an annotated graph appeared on 10/21/2009. click here.
|
|
C
A
S
I |
News |
Chart |
SEC
View all notes Alert
me of new notes
Company
Profile
|
ASIA
-
|
$22.06
|
-1.23
|
1,292,215
160% DAV
805,700
|
10/14/2009
(Date
Featured) |
$23.05
(Price
Featured) |
PP = $22.19 |
Y |
| MB = $23.30 |
Most Recent Note - 10/30/2009 4:47:27 PM
Y - Big loss today with above average volume, consolidating following a 10/29/09 gap up after reporting solid earnings for the period ended Sept 30, 2009 that beat expectations as it also raised guidance. It found prompt support near its 50 DMA line (a textbook chart support level) after a 7 session losing streak with losses on high volume briefly negated its latest breakout. Color code was changed to yellow based on impressive fundamentals and technical strength, however market conditions (M criteria) are a concern until a new follow-through-day occurs. Featured 10/14/09 in the mid-day report (read here) as it gapped up for a new 52-week high with 5 times average volume, triggering a technical buy signal by blasting above its pivot point. First featured in the August 2009 CANSLIM.net News (read here).
>>> The latest Featured Stock Update with an annotated graph appeared on 10/30/2009. click here.
|
|
C
A
S
I |
News |
Chart |
SEC
View all notes Alert
me of new notes
Company
Profile
|
BIDU
- NASDAQ
Baidu Inc Ads
INTERNET - Internet Information Providers
|
$377.92
|
-15.48
|
2,661,245
138% DAV
1,932,400
|
9/8/2009
(Date
Featured) |
$351.80
(Price
Featured) |
PP = $368.59 |
G |
| MB = $387.02 |
Most Recent Note - 10/30/2009 4:50:05 PM
G - Down today on slightly higher than average volume for a close below its 50 DMA line, ending a tough week near its lowest close since early October. Volume spiked to 5 times normal on 10/27/09 as it gapped down for a considerable loss following its latest earnings report. As recently noted, "Choppy action has not allowed it to form a sound base in recent weeks." BIDU traded up as much as +23% from its price when featured in yellow in the 9/08/09 Mid-Day BreakOuts Report (read here).
>>> The latest Featured Stock Update with an annotated graph appeared on 10/28/2009. click here.
|
|
C
A
S
I |
News |
Chart |
SEC
View all notes Alert
me of new notes
Company
Profile
|
CACC
- NASDAQ
Credit Acceptance Corp
FINANCIAL SERVICES - Credit Services
|
$34.37
|
-0.59
|
38,547
101% DAV
38,200
|
9/29/2009
(Date
Featured) |
$33.48
(Price
Featured) |
PP = $32.60 |
Y |
| MB = $34.23 |
Most Recent Note - 10/30/2009 4:53:59 PM
Y - Loss today on light volume, sinking quietly under its "max buy" level. Color code is changed to yellow, however market conditions (M criteria) are an overriding concern suggesting that investors hold off on any new buying efforts until a new rally with follow through day occurs. Prior chart highs and its 50 DMA line coincide in the $32 area, an important level to watch on pullbacks. The Finance - Consumer/Commercial Loans firm has maintained a great track record of annual and quarterly sales revenues and earnings increases. It was featured on 9/29/09 in yellow in the mid-day report (read here).
>>> The latest Featured Stock Update with an annotated graph appeared on 10/15/2009. click here.
|
|
C
A
S
I |
News |
Chart |
SEC
View all notes Alert
me of new notes
Company
Profile
|
CRM
- NYSE
Salesforce.com Inc
INTERNET - Internet Software & Services
|
$56.75
|
-2.91
|
1,642,182
82% DAV
2,012,800
|
8/16/2009
(Date
Featured) |
$47.12
(Price
Featured) |
PP = $45.59 |
G |
| MB = $47.87 |
Most Recent Note - 10/30/2009 4:56:30 PM
G - Continued weakness today led to a close under its 50 DMA line while the volume total was light. The deterioration this week led to technical sell signals as it violated prior chart highs in the $59 area and an upward trendline connecting its July, August and October chart lows.
>>> The latest Featured Stock Update with an annotated graph appeared on 10/27/2009. click here.
|
|
C
A
S
I |
News |
Chart |
SEC
View all notes Alert
me of new notes
Company
Profile
|
EBIX
- NASDAQ
Ebix Inc
COMPUTER SOFTWARE & SERVICES - Business Software & Services
|
$61.60
|
-2.26
|
235,185
105% DAV
223,700
|
8/28/2009
(Date
Featured) |
$45.86
(Price
Featured) |
PP = $45.35 |
G |
| MB = $47.62 |
Most Recent Note - 10/30/2009 4:58:24 PM
G - Small loss on light volume today. Its negative reversal from all-time highs on 10/26/09 has been followed by more worrisome distributional pressure. Prior chart highs and its 50 DMA line now coincide in the $54 area as the next important support level to watch.
>>> The latest Featured Stock Update with an annotated graph appeared on 10/13/2009. click here.
|
|
C
A
S
I |
News |
Chart |
SEC
View all notes Alert
me of new notes
Company
Profile
|
GMCR
- NASDAQ
Green Mtn Coffee Roastrs
FOOD & BEVERAGE - Processed & Packaged Goods
|
$66.55
|
-1.93
|
1,089,897
90% DAV
1,213,500
|
10/5/2009
(Date
Featured) |
$71.11
(Price
Featured) |
PP = $75.89 |
G |
| MB = $79.68 |
Most Recent Note - 10/30/2009 5:00:05 PM
G - Small loss on average volume led to a close just below its 50 DMA line ($67.34) which was previously noted as an important support level to watch.
>>> The latest Featured Stock Update with an annotated graph appeared on 10/29/2009. click here.
|
|
C
A
S
I |
News |
Chart |
SEC
View all notes Alert
me of new notes
Company
Profile
|
PEGA
- NASDAQ
Pegasystems Inc
COMPUTER SOFTWARE & SERVICES - Business Software & Services
|
$28.67
|
-0.63
|
270,801
85% DAV
318,600
|
9/9/2009
(Date
Featured) |
$31.14
(Price
Featured) |
PP = $33.35 |
G |
| MB = $35.02 |
Most Recent Note - 10/30/2009 5:00:47 PM
G - This week's violations of its 50 DMA line and upward trendline were previously noted as technical sell signals. Disciplined investors always limit losses when a stock falls more than 7% from their buy price. Its June highs, which were once resistance in the $27-28 area, are now being put to the test as a chart support level.
>>> The latest Featured Stock Update with an annotated graph appeared on 10/23/2009. click here.
|
|
C
A
S
I |
News |
Chart |
SEC
View all notes Alert
me of new notes
Company
Profile
|
|
|
|
THESE ARE NOT BUY RECOMMENDATIONS!
Comments contained in the body of this report are technical
opinions only. The material herein has been obtained
from sources believed to be reliable and accurate, however,
its accuracy and completeness cannot be guaranteed.
This site is not an investment advisor, hence it does
not endorse or recommend any securities or other investments.
Any recommendation contained in this report may not
be suitable for all investors and it is not to be deemed
an offer or solicitation on our part with respect to
the purchase or sale of any securities. All trademarks,
service marks and trade names appearing in this report
are the property of their respective owners, and are
likewise used for identification purposes only.
This report is a service available
only to active Paid Premium Members.
You may opt-out of receiving report notifications
at any time. Questions or comments may be submitted
by writing to Premium Membership Services 665 S.E. 10 Street, Suite 201 Deerfield Beach, FL 33441-5634 or by calling 1-800-965-8307
or 954-785-1121.
|
|
|


