You are not logged in.
This means you
CAN ONLY VIEW reports that were published prior to Monday, April 14, 2025.
You
MUST UPGRADE YOUR MEMBERSHIP if you want to see any current reports.
AFTER MARKET UPDATE - TUESDAY, OCTOBER 28TH, 2014
Previous After Market Report Next After Market Report >>>
|
|
|
|
DOW |
+187.81 |
17,005.75 |
+1.12% |
|
Volume |
778,834,280 |
+5% |
|
Volume |
1,774,566,190 |
+23% |
|
NASDAQ |
+78.36 |
4,564.29 |
+1.75% |
|
Advancers |
2,606 |
82% |
|
Advancers |
2,314 |
79% |
|
S&P 500 |
+23.42 |
1,985.05 |
+1.19% |
|
Decliners |
501 |
16% |
|
Decliners |
536 |
18% |
|
Russell 2000 |
+31.98 |
1,149.45 |
+2.86% |
|
52 Wk Highs |
187 |
|
|
52 Wk Highs |
131 |
|
|
S&P 600 |
+19.05 |
664.26 |
+2.95% |
|
52 Wk Lows |
29 |
|
|
52 Wk Lows |
44 |
|
|
 |
Volume Totals Were Higher and Leadership Expanded as Major Averages Rallied
Kenneth J. Gruneisen - Passed the CAN SLIM® Master's Exam
The major averages rallied for solid gains on Tuesday. The Dow climbed 188 points to close above 17,000 at 17,005. The S&P 500 advanced 23 points to 1,985. The NASDAQ Composite surged 78 points to 4,564. The volume totals were reported higher than the prior session totals on the NYSE and on the Nasdaq exchange, an encouraging sign of institutional accumulation. Breadth was positive as advancers led decliners by more than a 5-1 margin on the NYSE and by more than a 4-1 margin on the Nasdaq exchange. Leadership expanded considerably as there were 91 high-ranked companies from the CANSLIM.net Leaders List that made new 52-week highs and appeared on the CANSLIM.net BreakOuts Page, more than doubling the prior session total of 44 stocks. The new 52-week highs totals expanded and easily outnumbered new 52-week lows on the NYSE and on the Nasdaq exchange. There were gains for 8 of the 9 high-ranked companies currently on the Featured Stocks Page, a list which gained a few new companies as broader market conditions improved. Disciplined investors know that new buying efforts may be made under the fact-based investment system only in stocks meeting all key criteria.
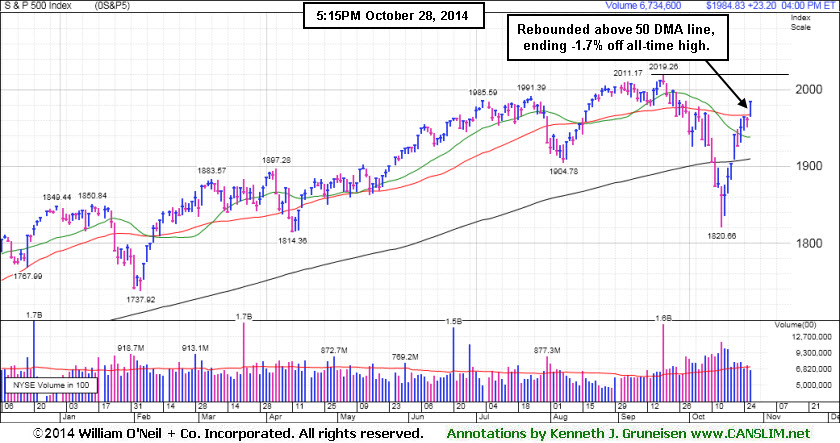
PICTURED: The S&P 500 Index rebounded above its 50-day moving average (DMA) line with Tuesday's big gain, helping its technical stance improve. The benchmark index finished -1.7% off its all-time high.
The major averages rallied attributed to generally positive corporate earnings and economic reports. Attention was also on the Fed as it began its two-day policy meeting. Along with an expected end to its bond-buying program, investors will look for commentary in the statement released tomorrow afternoon for the central bank's outlook on interest rates.
Amgen (AMGN +6.07%) rose after the biotech company's profits topped projections. Whirlpool (WHR +6.77%) rallied following its quarterly release. Twitter (TWTR -9.84%) slumped on its lowered sales guidance. On the data front, a report showed consumer confidence rose to a seven year high in October. A separate release revealed durable goods orders unexpectedly fell in September.
All 10 sectors in the S&P 500 were up on the session with energy the best performing group. Shares of Exxon (XOM +1.48%) rose as crude oil advanced. Madison Square Garden (MSG +10.96%) was a notable gainer after saying it is considering splitting into two separate companies.
Treasuries declined with the 10-year note falling 9/32 to yield 2.29%. In commodities, WTI crude gained +0.3% to $81.23/barrel on the NYMEX. COMEX gold futures were essentially flat at $1229.20/ounce.
Large gains last Tuesday backed by higher volume totals while leadership (stocks hitting new 52-week highs) expanded met the definition of a "follow-through day" confirming a new uptrend for the market (M criteria). The S&P 500 Index, Nasdaq Composite Index, and the Dow Jones Industrial Average have collectively rebounded above their respective 200-day moving average (DMA) lines, technically putting the market in a "healthier" stance.
The CANSLIM.net Featured Stocks Page shows the most action-worthy candidates and their latest notes and a Headline Link directs members to the latest detailed analysis with data-packed graphs annotated by a Certified expert along with links to additional resources. The Premium Member Homepage includes "dynamic archives" to all prior pay reports published.
|
 Kenneth J. Gruneisen started out as a licensed stockbroker in August 1987, a couple of months prior to the historic stock market crash that took the Dow Jones Industrial Average down -22.6% in a single day. He has published daily fact-based fundamental and technical analysis on high-ranked stocks online for two decades. Through FACTBASEDINVESTING.COM, Kenneth provides educational articles, news, market commentary, and other information regarding proven investment systems that work in good times and bad.
Comments contained in the body of this report are technical opinions only and are not necessarily those of Gruneisen Growth Corp. The material herein has been obtained from sources believed to be reliable and accurate, however, its accuracy and completeness cannot be guaranteed. Our firm, employees, and customers may effect transactions, including transactions contrary to any recommendation herein, or have positions in the securities mentioned herein or options with respect thereto. Any recommendation contained in this report may not be suitable for all investors and it is not to be deemed an offer or solicitation on our part with respect to the purchase or sale of any securities. |
|
 |
Commodity-Linked Groups Outpaced Tech, Retail, Financial Group Gains
Kenneth J. Gruneisen - Passed the CAN SLIM® Master's Exam
A big gain from the Broker/Dealer Index ($XBD +2.27%) was a positive influence on the major averages on Tuesday while the Bank Index ($BKX +0.12%) edged higher and the Retail Index ($RLX +0.77%) posted a modest gain. The tech sector saw a solid gain from the Networking Index ($NWX +2.88%) while the Biotechnology Index ($BTK +1.08%) and the Semiconductor Index ($SOX +1.50%) also tallied gains of more than +1%. Commodity-linked groups also posted considerable gains as the Integrated Oil Index ($XOI +2.42%) and the Oil Services Index ($OSX +3.36%) out[paced the Gold & Silver Index ($XAU +1.68%).
Charts courtesy www.stockcharts.com
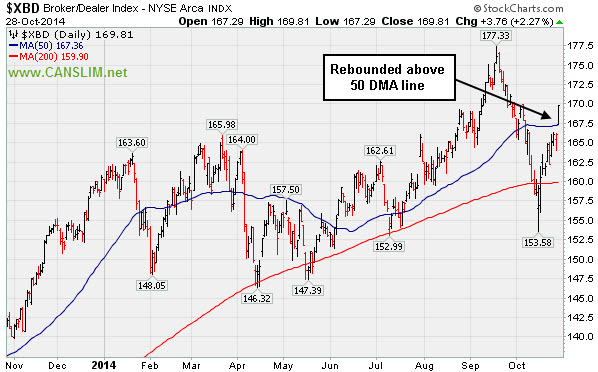
PICTURED: The Broker/Dealer Index ($XBD +2.27%) rebounded above its 50-day moving average (DMA line with Tuesday's solid gain.
| Oil Services |
$OSX |
244.83 |
+7.95 |
+3.36% |
-12.88% |
| Integrated Oil |
$XOI |
1,461.89 |
+34.61 |
+2.42% |
-2.74% |
| Semiconductor |
$SOX |
623.46 |
+9.23 |
+1.50% |
+16.53% |
| Networking |
$NWX |
319.61 |
+8.96 |
+2.88% |
-1.34% |
| Broker/Dealer |
$XBD |
169.81 |
+3.76 |
+2.27% |
+5.76% |
| Retail |
$RLX |
936.20 |
+7.11 |
+0.77% |
-0.38% |
| Gold & Silver |
$XAU |
75.83 |
+1.25 |
+1.68% |
-9.89% |
| Bank |
$BKX |
70.50 |
+1.02 |
+1.47% |
+1.79% |
| Biotech |
$BTK |
3,314.11 |
+35.45 |
+1.08% |
+42.21% |
|
|
|
 |
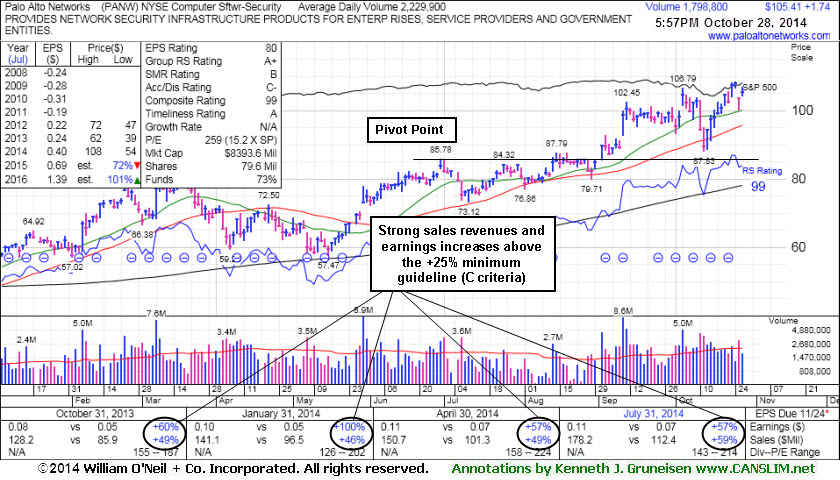
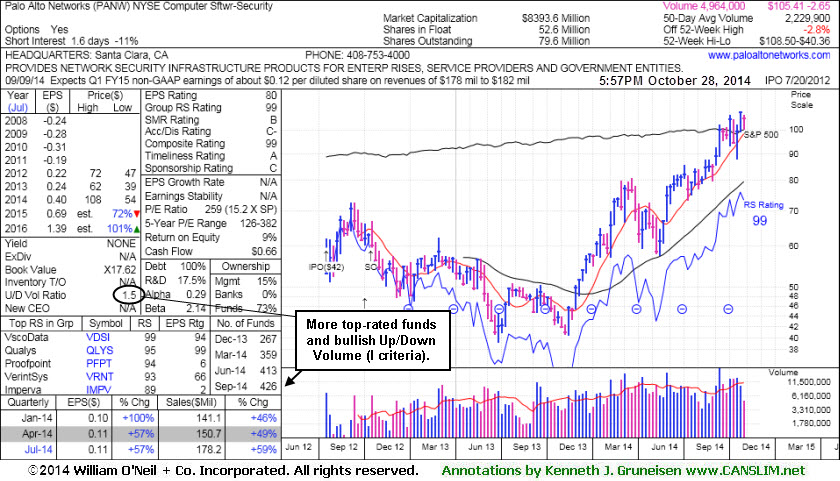
Rebound and Rally Leaves Tech Firm Extended From Base
Kenneth J. Gruneisen - Passed the CAN SLIM® Master's Exam
Palo Alto Networks (PANW +$1.74 or +1.68% to $105.41) is perched near its 52-week high, extended from any sound base. Its 50-day moving average (DMA) line ($95.67) and recent low ($87.83 on 10/13/14) define important near-term support where subsequent violations would trigger technical sell signals.
PANW was last shown in this FSU section with annotated graphs on 10/14/14 under the headline, "Prompt Rebound Above 50-Day Average an Encouraging Sign of Support". It was then noted - "The rebound was an encouraging sign that the institutional crowd stepped in to provide support after the pullback." Market strength (M criteria) of late has helped investors have confidence to maintain or increase market exposure. Disciplined investors avoid chasing extended stocks more the +5% above prior highs and they always limit losses by selling any stock that falls more than -7% from their purchase price.
The high-ranked leader hailing from the Computer Software - Security industry group reported earnings +57% on +59% sales revenues for the Jul '14 quarter continuing its record of strong sales revenues increases and earnings above the +25% minimum guideline satisfying the C criteria. Its annual earnings (A criteria) history is a bit limited, but growth has been strong since its July 2012 IPO at $42. The number of top-rated funds owning its shares rose from 246 in Jun '13 to 426 in Sep '14, a reassuring sign concerning the I criteria. Its small supply (S criteria) of only 52.6 million shares in the public float is another favorable characteristic. Its current Up/Down Volume Ratio of 1.5 is an unbiased indication its shares have been under accumulation over the past 50 days.
|
|
|
Color Codes Explained :
Y - Better candidates highlighted by our
staff of experts.
G - Previously featured
in past reports as yellow but may no longer be buyable under the
guidelines.
***Last / Change / Volume data in this table is the closing quote data***
Symbol/Exchange
Company Name
Industry Group |
PRICE |
CHANGE
(%Change) |
Day High |
Volume
(% DAV)
(% 50 day avg vol) |
52 Wk Hi
% From Hi |
Featured
Date |
Price
Featured |
Pivot Featured |
|
Max Buy |
ACT
-
NYSE
Actavis plc
Medical-Generic Drugs
|
$239.03
|
+0.60
0.25% |
$240.87
|
1,707,001
79.36% of 50 DAV
50 DAV is 2,151,000
|
$249.94
-4.37%
|
6/20/2014
|
$216.53
|
PP = $230.87
|
|
MB = $242.41
|
 Most Recent Note - 10/28/2014 6:32:07 PM
Y - Quietly holding its ground after rebounding above its 50 DMA line helping its outlook improve. Found support at its 200 DMA line following damaging losses marked by volume.
>>> FEATURED STOCK ARTICLE : Quiet Gains Help Generic Drug Firm Rise Above 50-Day Average - 10/21/2014
View all notes |
Set NEW NOTE alert |
CANSLIM.net Company Profile |
SEC
News |
Chart |
Request a new note
C
A N
S L
I M


|
AFSI
-
NASDAQ
Amtrust Financial Svcs
INSURANCE - Property and; Casualty Insurance
|
$53.03
|
+2.05
4.02% |
$53.50
|
1,236,131
162.22% of 50 DAV
50 DAV is 762,000
|
$51.86
2.26%
|
10/17/2014
|
$45.24
|
PP = $46.02
|
|
MB = $48.32
|
Most Recent Note - 10/28/2014 6:32:47 PM
G - Rallied even further above its "max buy" level today with yet another volume-driven gain. Prior highs in the $46-47 area define initial support to watch on pullbacks.
>>> FEATURED STOCK ARTICLE : Perched Near High After Rebounding From 200-Day Average - 10/17/2014
View all notes |
Set NEW NOTE alert |
CANSLIM.net Company Profile |
SEC
News |
Chart |
Request a new note
C
A N
S L
I M
|
ALXN
-
NASDAQ
Alexion Pharmaceuticals
DRUGS - Drug Manufacturers - Other
|
$192.20
|
+1.65
0.87% |
$193.90
|
1,060,019
88.93% of 50 DAV
50 DAV is 1,192,000
|
$191.00
0.63%
|
10/23/2014
|
$184.01
|
PP = $185.53
|
|
MB = $194.81
|
Most Recent Note - 10/28/2014 6:34:35 PM
Y - Inched higher for another new 52-week high with today's 4th consecutive gain backed by lighter volume. Prior highs in the $180 area define initial support to watch on pullbacks.
>>> FEATURED STOCK ARTICLE : Finished Strong After Gapping Up Above Prior High - 10/23/2014
View all notes |
Set NEW NOTE alert |
CANSLIM.net Company Profile |
SEC
News |
Chart |
Request a new note
C
A N
S L
I M
|
EPAM
-
NYSE
Epam Systems Inc
COMPUTER SOFTWARE and SERVICES - Information Technology Service
|
$47.11
|
+0.20
0.43% |
$47.27
|
848,477
206.44% of 50 DAV
50 DAV is 411,000
|
$47.47
-0.76%
|
10/23/2014
|
$45.21
|
PP = $46.09
|
|
MB = $48.39
|
Most Recent Note - 10/28/2014 6:36:48 PM
Y - Posted a 3rd gain with above average volume in the span of 4 sessions and ended at a best-ever close. Near term support to watch is at prior highs in the $44 area. Considerable gain on the prior session with more than 3 times average volume cleared the pivot point cited triggering a technical buy signal.
>>> FEATURED STOCK ARTICLE : Pulled Back After Challenging Prior Highs - 10/24/2014
View all notes |
Set NEW NOTE alert |
CANSLIM.net Company Profile |
SEC
News |
Chart |
Request a new note
C
A N
S L
I M
|
FB
-
NASDAQ
Facebook Inc Cl A
INTERNET
|
$80.77
|
+0.49
0.61% |
$81.16
|
71,433,586
205.35% of 50 DAV
50 DAV is 34,787,000
|
$80.82
-0.06%
|
9/9/2014
|
$76.67
|
PP = $76.84
|
|
MB = $80.68
|
Most Recent Note - 10/28/2014 6:43:22 PM
G - Color code is changed to green after rising above its "max buy" level with 2 times average volume behind today's gain. Reported earnings +59% on +59% sales for the Sep '14 quarter following the close and it warned of rising costs. Disciplined investors avoid chasing stocks more than +5% above their pivot point and always limit losses by selling any stock that falls more than -7% from their purchase price.
>>> FEATURED STOCK ARTICLE : Volume-Driven Losses Triggered Sell Signals After Slumping Into Prior Base - 10/16/2014
View all notes |
Set NEW NOTE alert |
CANSLIM.net Company Profile |
SEC
News |
Chart |
Request a new note
C
A N
S L
I M
|
Symbol/Exchange
Company Name
Industry Group |
PRICE |
CHANGE
(%Change) |
Day High |
Volume
(% DAV)
(% 50 day avg vol) |
52 Wk Hi
% From Hi |
Featured
Date |
Price
Featured |
Pivot Featured |
|
Max Buy |
ILMN
-
NASDAQ
Illumina Inc
DRUGS - Biotechnology
|
$190.65
|
-0.66
-0.34% |
$192.87
|
1,040,584
83.38% of 50 DAV
50 DAV is 1,248,000
|
$192.49
-0.96%
|
10/22/2014
|
$188.77
|
PP = $182.27
|
|
MB = $191.38
|
Most Recent Note - 10/28/2014 6:45:02 PM
Y - Paused quietly at its 52-week high and near its "max buy" level today following 4 consecutive gains on higher volume. Prior highs near $182 define near-term support to watch on pullbacks.
>>> FEATURED STOCK ARTICLE : Breakout Cleared "Double Bottom" Base Pattern - 10/22/2014
View all notes |
Set NEW NOTE alert |
CANSLIM.net Company Profile |
SEC
News |
Chart |
Request a new note
C
A N
S L
I M
|
PANW
-
NYSE
Palo Alto Networks
Computer Sftwr-Security
|
$105.41
|
+1.74
1.68% |
$107.00
|
1,800,852
80.79% of 50 DAV
50 DAV is 2,229,000
|
$108.50
-2.85%
|
7/30/2014
|
$84.21
|
PP = $85.88
|
|
MB = $90.17
|
Most Recent Note - 10/28/2014 6:47:07 PM
G - Perched near its 52-week high, extended from any sound base. Its 50 DMA line ($95.67) defines important near-term support where a violation would trigger a technical sell signal. See the latest FSU analysis for more details and new annotated graphs.
>>> FEATURED STOCK ARTICLE : Rebound and Rally Leaves Tech Firm Extended From Base - 10/28/2014
View all notes |
Set NEW NOTE alert |
CANSLIM.net Company Profile |
SEC
News |
Chart |
Request a new note
C
A N
S L
I M
|
SNCR
-
NASDAQ
Synchronoss Technologies
COMPUTER SOFTWARE andamp; SERVICES - Application Software
|
$51.95
|
+5.36
11.50% |
$52.39
|
2,000,700
416.81% of 50 DAV
50 DAV is 480,000
|
$47.81
8.66%
|
10/27/2014
|
$46.40
|
PP = $47.81
|
|
MB = $50.20
|
Most Recent Note - 10/28/2014 6:29:01 PM
G - Hit new all-time highs and rallied beyond its "max buy" level and its color code is changed to green. Today's considerable gain was backed by more than 4 times average volume after reporting earnings +35% on +40% sales revenues for the Sep '14 quarter. See the latest FSU analysis for more details and an annotated daily graph. Highlighted in yellow in the 10/27/14 mid-day report (read here) with the following annotated weekly graph while noted - "In the Certification they teach that a valid secondary buy point exists under the fact-based system up to +5% above the latest high following the first successful test of a stock's 10-week moving average (WMA) line after an earlier technical breakout. Volume and volatility often increase near earnings news."

>>> FEATURED STOCK ARTICLE : No Resistance Remains; Perched at Secondary Buy Point - 10/27/2014
View all notes |
Set NEW NOTE alert |
CANSLIM.net Company Profile |
SEC
News |
Chart |
Request a new note
C
A N
S L
I M
|
STRT
-
NASDAQ
Strattec Security Corp
AUTOMOTIVE - Auto Parts
|
$105.97
|
+5.95
5.95% |
$109.44
|
49,535
190.52% of 50 DAV
50 DAV is 26,000
|
$101.53
4.37%
|
9/19/2014
|
$86.06
|
PP = $89.97
|
|
MB = $94.47
|
Most Recent Note - 10/28/2014 6:30:49 PM
G - Hit another new 52-week high with today's 4th consecutive volume-driven gain, getting more extended beyond its "max buy" level. Its 50 DMA line and prior highs in the $88 area define important near-term support to watch on pullbacks.
>>> FEATURED STOCK ARTICLE : Building Base-On-Base Pattern Ahead of Earnings News - 10/20/2014
View all notes |
Set NEW NOTE alert |
CANSLIM.net Company Profile |
SEC
News |
Chart |
Request a new note
C
A N
S L
I M
|
|
|
|
THESE ARE NOT BUY RECOMMENDATIONS!
Comments contained in the body of this report are technical
opinions only. The material herein has been obtained
from sources believed to be reliable and accurate, however,
its accuracy and completeness cannot be guaranteed.
This site is not an investment advisor, hence it does
not endorse or recommend any securities or other investments.
Any recommendation contained in this report may not
be suitable for all investors and it is not to be deemed
an offer or solicitation on our part with respect to
the purchase or sale of any securities. All trademarks,
service marks and trade names appearing in this report
are the property of their respective owners, and are
likewise used for identification purposes only.
This report is a service available
only to active Paid Premium Members.
You may opt-out of receiving report notifications
at any time. Questions or comments may be submitted
by writing to Premium Membership Services 665 S.E. 10 Street, Suite 201 Deerfield Beach, FL 33441-5634 or by calling 1-800-965-8307
or 954-785-1121.
|
|
|

