You are not logged in.
This means you
CAN ONLY VIEW reports that were published prior to Wednesday, March 26, 2025.
You
MUST UPGRADE YOUR MEMBERSHIP if you want to see any current reports.
AFTER MARKET UPDATE - WEDNESDAY, OCTOBER 29TH, 2014
Previous After Market Report Next After Market Report >>>
|
|
|
|
DOW |
-31.44 |
16,974.31 |
-0.18% |
|
Volume |
799,141,760 |
+3% |
|
Volume |
2,010,839,540 |
+13% |
|
NASDAQ |
-15.06 |
4,549.23 |
-0.33% |
|
Advancers |
1,335 |
42% |
|
Advancers |
1,281 |
44% |
|
S&P 500 |
-2.75 |
1,982.30 |
-0.14% |
|
Decliners |
1,773 |
55% |
|
Decliners |
1,552 |
53% |
|
Russell 2000 |
-3.08 |
1,146.37 |
-0.27% |
|
52 Wk Highs |
186 |
|
|
52 Wk Highs |
114 |
|
|
S&P 600 |
-0.68 |
663.58 |
-0.10% |
|
52 Wk Lows |
35 |
|
|
52 Wk Lows |
37 |
|
|
 |
Major Averages Encountered Distributional Pressure
Kenneth J. Gruneisen - Passed the CAN SLIM® Master's Exam
The major averages closed lower on Wednesday. The Dow fell 31 points to 16,974. The S&P 500 lost 3 points to 1,982. The NASDAQ Composite declined 15 points to 4,549. The volume totals were reported higher than the prior session totals on the NYSE and on the Nasdaq exchange, amounting to a day of institutional distribution. Breadth was just slightly negative as decliners led advancers by about a 4-3 margin on the NYSE and a 5-4 margin on the Nasdaq exchange. Leadership remained strong as there were 78 high-ranked companies from the CANSLIM.net Leaders List that made new 52-week highs and appeared on the CANSLIM.net BreakOuts Page, down from the prior session total of 91 stocks. The new 52-week highs totals easily outnumbered new 52-week lows on the NYSE and on the Nasdaq exchange. There were losses for 8 of the 9 high-ranked companies currently on the Featured Stocks Page, a list which recently gained a few new companies as broader market conditions improved. Disciplined investors know that new buying efforts may be made under the fact-based investment system only in stocks meeting all key criteria.
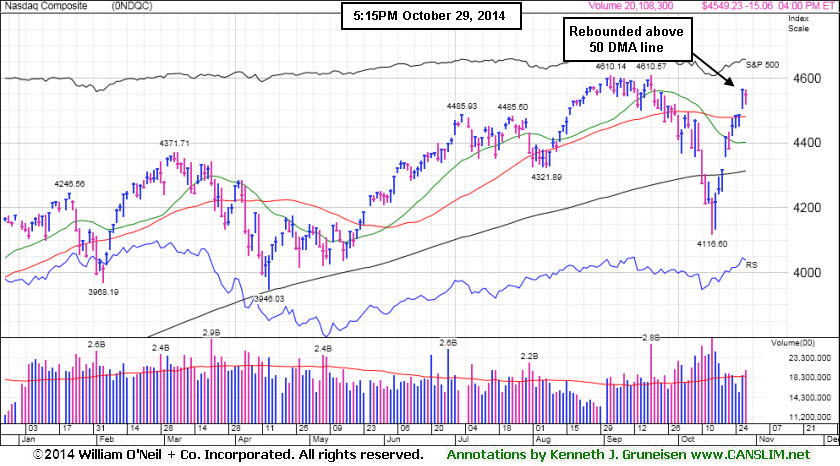
PICTURED: The Nasdaq Composite Index has rebounded above its 50-day moving average (DMA) line helping its technical stance improve.
The major averages finished a choppy session down following the conclusion of the Fed's policy meeting. As expected the central bank ended its monthly asset purchase program and indicated it will maintain interest rates low for a "considerable time."
On the earnings front, Facebook (FB -6.1%) fell after tempering its revenue growth forecast. Hershey (HSY -1.5%) edged lower as results missed estimates and while cutting its full-year guidance. U.S. Steel (X +5.1%) rose after profits beat expectations. In other news, Orbital Sciences (ORB -16.8%) fell after an unmanned rocket headed to the International Space Station exploded yesterday.
Seven of 10 sectors in the S&P 500 ended the session in negative territory. Materials were down the most with an index of companies falling -1.3%. Shares of Newmont Mining (NEM -4.8%) fell. Energy was the best performing sector paced by Newfield Exploration (NFX +10.9%) jumping after earnings topped projections.
Treasuries were mostly lower on the session. Benchmark 10-year notes were down 7/32 to yield 2.32%. In commodity trading, WTI crude oil rose +1% to $82.30/barrel on the NYMEX. COMEX gold futures fell -0.4% to $1,224.30/ounce.
Large gains on 10/21/14 backed by higher volume totals while leadership (stocks hitting new 52-week highs) expanded met the definition of a "follow-through day" confirming a new uptrend for the market (M criteria). The S&P 500 Index, Nasdaq Composite Index, and the Dow Jones Industrial Average have collectively rebounded above their respective 50-day and 200-day moving average (DMA) lines, technically putting the market in a healthier stance.
The CANSLIM.net Featured Stocks Page shows the most action-worthy candidates and their latest notes and a Headline Link directs members to the latest detailed analysis with data-packed graphs annotated by a Certified expert along with links to additional resources. The Premium Member Homepage includes "dynamic archives" to all prior pay reports published.
|
 Kenneth J. Gruneisen started out as a licensed stockbroker in August 1987, a couple of months prior to the historic stock market crash that took the Dow Jones Industrial Average down -22.6% in a single day. He has published daily fact-based fundamental and technical analysis on high-ranked stocks online for two decades. Through FACTBASEDINVESTING.COM, Kenneth provides educational articles, news, market commentary, and other information regarding proven investment systems that work in good times and bad.
Comments contained in the body of this report are technical opinions only and are not necessarily those of Gruneisen Growth Corp. The material herein has been obtained from sources believed to be reliable and accurate, however, its accuracy and completeness cannot be guaranteed. Our firm, employees, and customers may effect transactions, including transactions contrary to any recommendation herein, or have positions in the securities mentioned herein or options with respect thereto. Any recommendation contained in this report may not be suitable for all investors and it is not to be deemed an offer or solicitation on our part with respect to the purchase or sale of any securities. |
|
 |
Financial Edged Higher; XAU Slumped For Another Big Loss
Kenneth J. Gruneisen - Passed the CAN SLIM® Master's Exam
A positive influence from financial stocks on Wednesday helped as the Broker/Dealer Index ($XBD +0.61%) and Bank Index ($BKX +0.74%) both posted modest gains, however, the gains were offset by losses elsewhere and the major averages ended lower. The Biotechnology Index ($BTK -0.63%) and Networking Index ($NWX -0.31%) both edged lower while the Semiconductor Index ($SOX +0.12%) eked out a tiny gain. energy related had a slightky positive bias as the Oil Services Index ($OSX +0.24%) inched higher and the Integrated Oil Index ($XOI +0.04%) held its ground.
Charts courtesy www.stockcharts.com
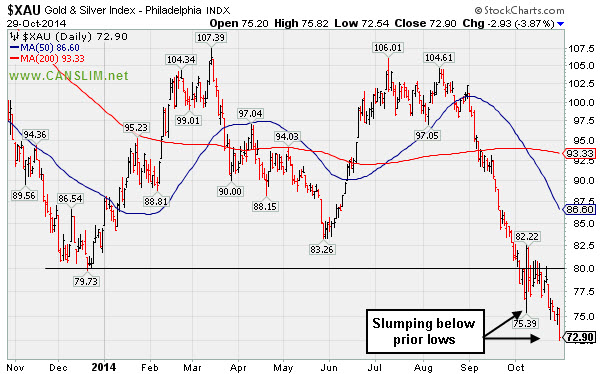
PICTURED: The Gold & Silver Index ($XAU -3.86%) was a standout decliner while slumping below prior lows.
| Oil Services |
$OSX |
245.42 |
+0.59 |
+0.24% |
-12.67% |
| Integrated Oil |
$XOI |
1,462.52 |
+0.63 |
+0.04% |
-2.70% |
| Semiconductor |
$SOX |
624.19 |
+0.73 |
+0.12% |
+16.66% |
| Networking |
$NWX |
318.61 |
-1.00 |
-0.31% |
-1.64% |
| Broker/Dealer |
$XBD |
170.84 |
+1.03 |
+0.61% |
+6.40% |
| Retail |
$RLX |
932.82 |
-3.38 |
-0.36% |
-0.74% |
| Gold & Silver |
$XAU |
72.90 |
-2.93 |
-3.86% |
-13.37% |
| Bank |
$BKX |
71.02 |
+0.52 |
+0.74% |
+2.54% |
| Biotech |
$BTK |
3,293.18 |
-20.92 |
-0.63% |
+41.31% |
|
|
|
 |
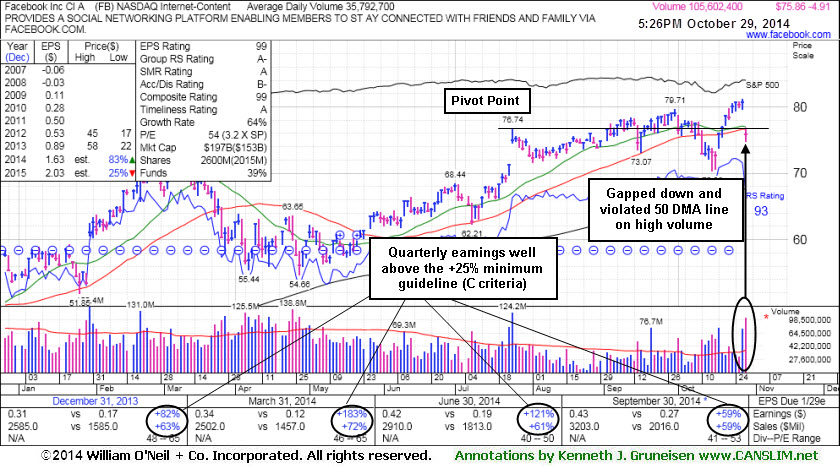
Gapped Down Following Latest Strong Earnings Report
Kenneth J. Gruneisen - Passed the CAN SLIM® Master's Exam
Facebook Inc (FB -$4.91 or -6.08% to $75.86) gapped down for a loss today with 3 times average volume and violated its 50-day moving average (DMA) line raising concerns and triggering a technical sell signal. Volume and volatility often increase near earnings news. The company reported earnings +59% on +59% sales revenues for the Sep '14 quarter but warned of rising costs. That marked its 6th consecutive quarterly comparison with earnings increasing well above the +25% minimum (C criteria).
Keep in mind that historic studies show that investors have a far better chance of success when buying as a stock is breaking out, not buying on pullbacks. Disciplined investors avoid chasing stocks more than +5% above their pivot point and always limit losses by selling any stock that falls more than -7% from their purchase price.
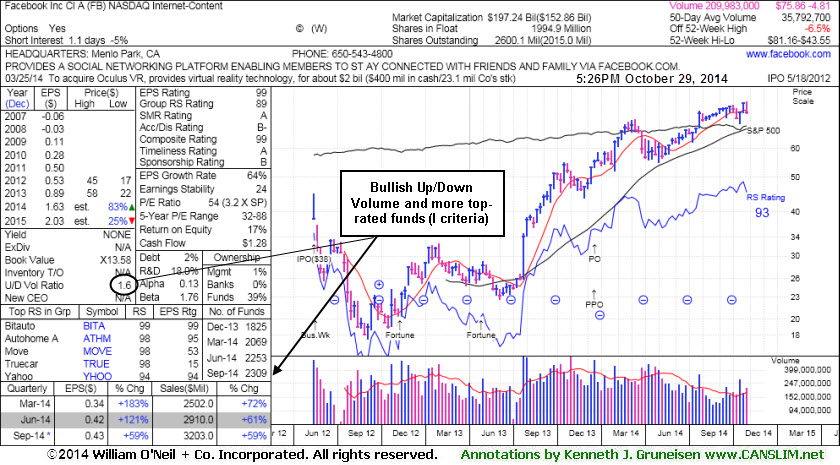
The high-ranked Internet - Content firm was last shown in this FSU section on 10/16/14 with annotated graphs under the headline, "Volume-Driven Losses Triggered Sell Signals After Slumping Into Prior Base". A subsequent rebound above the 50 DMA line helped its outlook to improve. Its current Up/Down Volume Ratio of 1.6 is still an unbiased indication its shares have been under accumulation over the past 50 days.
The high-ranked Internet - Content group leader has seen the number of top-rated funds owning its shares rise from 1,116 in Dec '12 to 2,309 in Sep '14, a reassuring sign concerning the I criteria. Members were previously warned - "Keep in mind that its large supply of 2.54 billion shares in the public float makes it an unlikely sprinter, especially as it is already well known by the institutional crowd and the general public."
|
|
|
Color Codes Explained :
Y - Better candidates highlighted by our
staff of experts.
G - Previously featured
in past reports as yellow but may no longer be buyable under the
guidelines.
***Last / Change / Volume data in this table is the closing quote data***
Symbol/Exchange
Company Name
Industry Group |
PRICE |
CHANGE
(%Change) |
Day High |
Volume
(% DAV)
(% 50 day avg vol) |
52 Wk Hi
% From Hi |
Featured
Date |
Price
Featured |
Pivot Featured |
|
Max Buy |
ACT
-
NYSE
Actavis plc
Medical-Generic Drugs
|
$238.78
|
-0.25
-0.10% |
$240.71
|
1,592,290
73.96% of 50 DAV
50 DAV is 2,153,000
|
$249.94
-4.47%
|
6/20/2014
|
$216.53
|
PP = $230.87
|
|
MB = $242.41
|
Most Recent Note - 10/28/2014 6:32:07 PM
Y - Quietly holding its ground after rebounding above its 50 DMA line helping its outlook improve. Found support at its 200 DMA line following damaging losses marked by volume.
>>> FEATURED STOCK ARTICLE : Quiet Gains Help Generic Drug Firm Rise Above 50-Day Average - 10/21/2014
View all notes |
Set NEW NOTE alert |
CANSLIM.net Company Profile |
SEC
News |
Chart |
Request a new note
C
A N
S L
I M


|
AFSI
-
NASDAQ
Amtrust Financial Svcs
INSURANCE - Property and; Casualty Insurance
|
$46.04
|
-6.99
-13.18% |
$52.21
|
3,262,144
422.01% of 50 DAV
50 DAV is 773,000
|
$53.50
-13.94%
|
10/17/2014
|
$45.24
|
PP = $46.02
|
|
MB = $48.32
|
 Most Recent Note - 10/29/2014 12:06:28 PM
G - Abruptly retreated from its 52-week high today following an analyst downgrade. A spurt of volume-driven gains helped it recently rally beyond its "max buy" level. Prior highs in the $46-47 area define initial support to watch on pullbacks.
>>> FEATURED STOCK ARTICLE : Perched Near High After Rebounding From 200-Day Average - 10/17/2014
View all notes |
Set NEW NOTE alert |
CANSLIM.net Company Profile |
SEC
News |
Chart |
Request a new note
C
A N
S L
I M
|
ALXN
-
NASDAQ
Alexion Pharmaceuticals
DRUGS - Drug Manufacturers - Other
|
$190.49
|
-1.71
-0.89% |
$193.39
|
985,728
82.83% of 50 DAV
50 DAV is 1,190,000
|
$193.90
-1.76%
|
10/23/2014
|
$184.01
|
PP = $185.53
|
|
MB = $194.81
|
Most Recent Note - 10/28/2014 6:34:35 PM
Y - Inched higher for another new 52-week high with today's 4th consecutive gain backed by lighter volume. Prior highs in the $180 area define initial support to watch on pullbacks.
>>> FEATURED STOCK ARTICLE : Finished Strong After Gapping Up Above Prior High - 10/23/2014
View all notes |
Set NEW NOTE alert |
CANSLIM.net Company Profile |
SEC
News |
Chart |
Request a new note
C
A N
S L
I M
|
EPAM
-
NYSE
Epam Systems Inc
COMPUTER SOFTWARE and SERVICES - Information Technology Service
|
$47.22
|
+0.11
0.23% |
$47.47
|
321,220
76.12% of 50 DAV
50 DAV is 422,000
|
$47.47
-0.53%
|
10/23/2014
|
$45.21
|
PP = $46.09
|
|
MB = $48.39
|
Most Recent Note - 10/28/2014 6:36:48 PM
Y - Posted a 3rd gain with above average volume in the span of 4 sessions and ended at a best-ever close. Near term support to watch is at prior highs in the $44 area. Considerable gain on the prior session with more than 3 times average volume cleared the pivot point cited triggering a technical buy signal.
>>> FEATURED STOCK ARTICLE : Pulled Back After Challenging Prior Highs - 10/24/2014
View all notes |
Set NEW NOTE alert |
CANSLIM.net Company Profile |
SEC
News |
Chart |
Request a new note
C
A N
S L
I M
|
FB
-
NASDAQ
Facebook Inc Cl A
INTERNET
|
$75.86
|
-4.91
-6.08% |
$76.88
|
105,579,668
294.98% of 50 DAV
50 DAV is 35,792,000
|
$81.16
-6.53%
|
9/9/2014
|
$76.67
|
PP = $76.84
|
|
MB = $80.68
|
Most Recent Note - 10/29/2014 5:48:52 PM
G - Gapped down today and violated its 50 DMA line with a damaging loss on 3 times average volume raising concerns and triggering a technical sell signal. Volume and volatility often increase near earnings news. The company reported earnings +59% on +59% sales for the Sep '14 quarter but warned of rising costs. Historic studies show that investors have a far better chance of success when buying as a stock is breaking out, not buying on pullbacks. See the latest FSU analysis for more details and new annotated graphs.
>>> FEATURED STOCK ARTICLE : Gapped Down Following Latest Strong Earnings Report - 10/29/2014
View all notes |
Set NEW NOTE alert |
CANSLIM.net Company Profile |
SEC
News |
Chart |
Request a new note
C
A N
S L
I M
|
Symbol/Exchange
Company Name
Industry Group |
PRICE |
CHANGE
(%Change) |
Day High |
Volume
(% DAV)
(% 50 day avg vol) |
52 Wk Hi
% From Hi |
Featured
Date |
Price
Featured |
Pivot Featured |
|
Max Buy |
ILMN
-
NASDAQ
Illumina Inc
DRUGS - Biotechnology
|
$188.88
|
-1.77
-0.93% |
$191.84
|
830,069
66.25% of 50 DAV
50 DAV is 1,253,000
|
$192.87
-2.07%
|
10/22/2014
|
$188.77
|
PP = $182.27
|
|
MB = $191.38
|
Most Recent Note - 10/28/2014 6:45:02 PM
Y - Paused quietly at its 52-week high and near its "max buy" level today following 4 consecutive gains on higher volume. Prior highs near $182 define near-term support to watch on pullbacks.
>>> FEATURED STOCK ARTICLE : Breakout Cleared "Double Bottom" Base Pattern - 10/22/2014
View all notes |
Set NEW NOTE alert |
CANSLIM.net Company Profile |
SEC
News |
Chart |
Request a new note
C
A N
S L
I M
|
PANW
-
NYSE
Palo Alto Networks
Computer Sftwr-Security
|
$103.56
|
-1.85
-1.76% |
$105.32
|
2,032,109
90.60% of 50 DAV
50 DAV is 2,243,000
|
$108.50
-4.55%
|
7/30/2014
|
$84.21
|
PP = $85.88
|
|
MB = $90.17
|
Most Recent Note - 10/28/2014 6:47:07 PM
G - Perched near its 52-week high, extended from any sound base. Its 50 DMA line ($95.67) defines important near-term support where a violation would trigger a technical sell signal. See the latest FSU analysis for more details and new annotated graphs.
>>> FEATURED STOCK ARTICLE : Rebound and Rally Leaves Tech Firm Extended From Base - 10/28/2014
View all notes |
Set NEW NOTE alert |
CANSLIM.net Company Profile |
SEC
News |
Chart |
Request a new note
C
A N
S L
I M
|
SNCR
-
NASDAQ
Synchronoss Technologies
COMPUTER SOFTWARE andamp; SERVICES - Application Software
|
$50.88
|
-1.07
-2.06% |
$53.47
|
885,180
173.23% of 50 DAV
50 DAV is 511,000
|
$52.39
-2.88%
|
10/27/2014
|
$46.40
|
PP = $47.81
|
|
MB = $50.20
|
Most Recent Note - 10/29/2014 1:05:57 PM
Y - Reversed into the red after early gains today, pulling back below the "max buy" level cited. Considerable gain on the prior session was backed by more than 4 times average volume after reporting earnings +35% on +40% sales revenues for the Sep '14 quarter. See the latest FSU analysis for more details and an annotated daily graph. The 10/27/14 mid-day report included the following annotated weekly graph while noted - "In the Certification they teach that a valid secondary buy point exists under the fact-based system up to +5% above the latest high following the first successful test of a stock's 10-week moving average (WMA) line after an earlier technical breakout. Volume and volatility often increase near earnings news."

>>> FEATURED STOCK ARTICLE : No Resistance Remains; Perched at Secondary Buy Point - 10/27/2014
View all notes |
Set NEW NOTE alert |
CANSLIM.net Company Profile |
SEC
News |
Chart |
Request a new note
C
A N
S L
I M
|
STRT
-
NASDAQ
Strattec Security Corp
AUTOMOTIVE - Auto Parts
|
$102.62
|
-3.35
-3.16% |
$108.01
|
26,243
97.20% of 50 DAV
50 DAV is 27,000
|
$109.44
-6.23%
|
9/19/2014
|
$86.06
|
PP = $89.97
|
|
MB = $94.47
|
Most Recent Note - 10/29/2014 5:51:31 PM
G - Pulled back from its 52-week high today following 4 consecutive volume-driven gains. It is very extended beyond its "max buy" level. Prior highs in the $88 area define important near-term support to watch above its 50 DMA line.
>>> FEATURED STOCK ARTICLE : Building Base-On-Base Pattern Ahead of Earnings News - 10/20/2014
View all notes |
Set NEW NOTE alert |
CANSLIM.net Company Profile |
SEC
News |
Chart |
Request a new note
C
A N
S L
I M
|
|
|
|
THESE ARE NOT BUY RECOMMENDATIONS!
Comments contained in the body of this report are technical
opinions only. The material herein has been obtained
from sources believed to be reliable and accurate, however,
its accuracy and completeness cannot be guaranteed.
This site is not an investment advisor, hence it does
not endorse or recommend any securities or other investments.
Any recommendation contained in this report may not
be suitable for all investors and it is not to be deemed
an offer or solicitation on our part with respect to
the purchase or sale of any securities. All trademarks,
service marks and trade names appearing in this report
are the property of their respective owners, and are
likewise used for identification purposes only.
This report is a service available
only to active Paid Premium Members.
You may opt-out of receiving report notifications
at any time. Questions or comments may be submitted
by writing to Premium Membership Services 665 S.E. 10 Street, Suite 201 Deerfield Beach, FL 33441-5634 or by calling 1-800-965-8307
or 954-785-1121.
|
|
|

