You are not logged in.
This means you
CAN ONLY VIEW reports that were published prior to Wednesday, April 30, 2025.
You
MUST UPGRADE YOUR MEMBERSHIP if you want to see any current reports.
AFTER MARKET UPDATE - FRIDAY, OCTOBER 28TH, 2011
Previous After Market Report Next After Market Report >>>
|
|
|
|
DOW |
+22.56 |
12,231.11 |
+0.18% |
|
Volume |
1,009,044,020 |
-29% |
|
Volume |
1,779,653,350 |
-35% |
|
NASDAQ |
-1.48 |
2,737.15 |
-0.05% |
|
Advancers |
1,465 |
47% |
|
Advancers |
1,124 |
42% |
|
S&P 500 |
+0.50 |
1,285.09 |
+0.04% |
|
Decliners |
1,531 |
49% |
|
Decliners |
1,434 |
54% |
|
Russell 2000 |
-4.43 |
761.00 |
-0.58% |
|
52 Wk Highs |
63 |
|
|
52 Wk Highs |
62 |
|
|
S&P 600 |
-2.65 |
418.56 |
-0.63% |
|
52 Wk Lows |
11 |
|
|
52 Wk Lows |
23 |
|
|
 |
Indices Rallied Above Their 200-Day Moving Averages This Week
Kenneth J. Gruneisen - Passed the CAN SLIM® Master's Exam
The major averages were mixed and little changed as there was a quiet end to a wild week on Wall Street. Friday's trading volume totals reported on the NYSE and on the Nasdaq exchange were much lighter than the prior session, cooling after a big surge in buying demand from the institutional crowd. For the week, the Dow Jones Industrial Average rose +3.6%, S&P 500 Index gained +3.7%, and the Nasdaq Composite Index rallied +3.8%. On Friday decliners narrowly led advancers on the NYSE and on the Nasdaq exchange. New 52-week highs still easily outnumbered new 52-week lows on the NYSE and on the Nasdaq exchange. There were 53 high-ranked companies from the CANSLIM.net Leaders List that made new 52-week highs and appeared on the CANSLIM.net BreakOuts Page, down from the prior session total of 99 stocks. There were gains for 10 of the 16 high-ranked companies currently included on the Featured Stocks Page, a list that has recently been growing again.
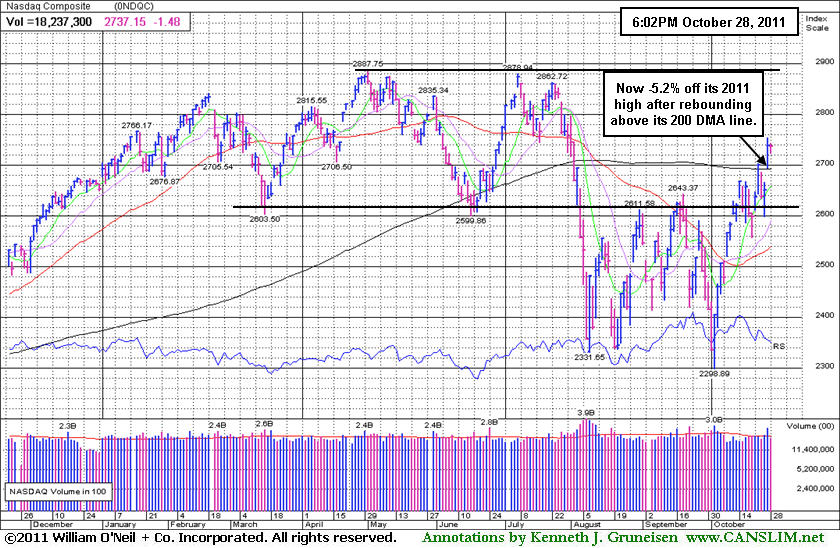
Investors digested Thursday's rally on Europe's plan to contain its debt crisis. The indices' gains for the week helped them collectively rally above their respective 200-day moving average lines. For the year, the Dow is up +5.6%. The S&P is up +2.2% while the Nasdaq is up +3.2%.
The latest economic reports suggested consumers are feeling better about the economy. The University of Michigan sentiment reading for September was unexpectedly revised higher to 60.9 from its initial reading of 57.5. Personal spending accelerated in September; however income increased less than projected.
Telecom stocks were among Friday's leaders while consumer discretionary underperformed the broader market. Gainers in the Dow included Hewlett-Packard (HPQ +3.14%) and Merck & Co (MRK +2.33%). Hewlett-Packard rose after the company said will keep its PC unit. Merck rose after its quarterly profits exceeded analyst expectations. Meanwhile, Whirlpool Corp (WHR -14.34%) slumped after the appliance giant posted disappointing earnings, cut its 2011 earnings guidance and said it would cut 5,000 jobs.
The October 2011 issue of our monthly newsletter CANSLIM.net News will be published soon with an informative review of current market conditions, leading groups, and best buy candidates. Via the Premium Member Homepage links to all prior reports and webcasts are always available.
PICTURED: The Nasdaq Composite Index finished -5.2% off its 2011 high after rebounding above its 200-day moving average (DMA) line.
|
 Kenneth J. Gruneisen started out as a licensed stockbroker in August 1987, a couple of months prior to the historic stock market crash that took the Dow Jones Industrial Average down -22.6% in a single day. He has published daily fact-based fundamental and technical analysis on high-ranked stocks online for two decades. Through FACTBASEDINVESTING.COM, Kenneth provides educational articles, news, market commentary, and other information regarding proven investment systems that work in good times and bad.
Comments contained in the body of this report are technical opinions only and are not necessarily those of Gruneisen Growth Corp. The material herein has been obtained from sources believed to be reliable and accurate, however, its accuracy and completeness cannot be guaranteed. Our firm, employees, and customers may effect transactions, including transactions contrary to any recommendation herein, or have positions in the securities mentioned herein or options with respect thereto. Any recommendation contained in this report may not be suitable for all investors and it is not to be deemed an offer or solicitation on our part with respect to the purchase or sale of any securities. |
|
 |
Tech and Commodity-Linked Groups Drift Higher
Kenneth J. Gruneisen - Passed the CAN SLIM® Master's Exam
The Broker/Dealer Index ($XBD -0.85%) and Bank Index ($BKX -0.36%) backpedaled, and the Retail Index ($RLX -0.31%) also edged lower, yet each influential index gave up only a small part of Thursday's big gains. The tech sector finished with a positive bias as the Networking Index ($NWX +1.80%), Biotechnology Index ($BTK +1.22%), and Internet Index ($IIX +0.99%) outpaced the Semiconductor Index ($SOX +0.15%). Energy-related shares had a positive drift as the Oil Services Index ($OSX +0.34%) and Integrated Oil Index ($XOI +0.49%) posted small gains. The Healthcare Index ($HMO +0.39%) edged higher while the Gold & Silver Index ($XAU +2.27%) was a standout gainer.
Charts courtesy www.stockcharts.com
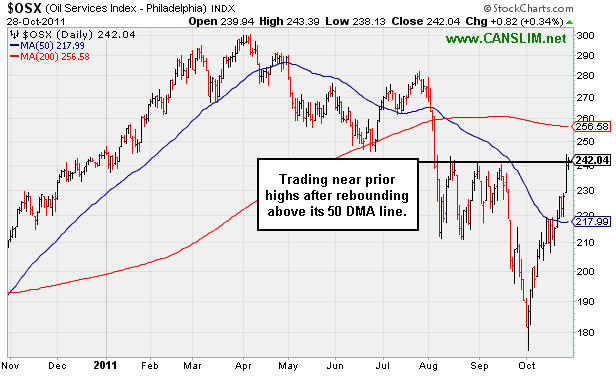
PICTURED: The Oil Services Index ($OSX +0.34%) is trading near prior highs after rebounding above its 50-day moving average (DMA) line.
| Oil Services |
$OSX |
242.04 |
+0.82 |
+0.34% |
-1.26% |
| Healthcare |
$HMO |
2,210.99 |
+8.56 |
+0.39% |
+30.67% |
| Integrated Oil |
$XOI |
1,276.90 |
+6.18 |
+0.49% |
+5.25% |
| Semiconductor |
$SOX |
396.33 |
+0.59 |
+0.15% |
-3.76% |
| Networking |
$NWX |
249.26 |
+4.41 |
+1.80% |
-11.15% |
| Internet |
$IIX |
303.57 |
+2.96 |
+0.99% |
-1.35% |
| Broker/Dealer |
$XBD |
95.70 |
-0.82 |
-0.85% |
-21.24% |
| Retail |
$RLX |
541.89 |
-1.69 |
-0.31% |
+6.59% |
| Gold & Silver |
$XAU |
207.98 |
+4.62 |
+2.27% |
-8.21% |
| Bank |
$BKX |
41.82 |
-0.15 |
-0.36% |
-19.90% |
| Biotech |
$BTK |
1,211.56 |
+14.62 |
+1.22% |
-6.63% |
|
|
|
 |
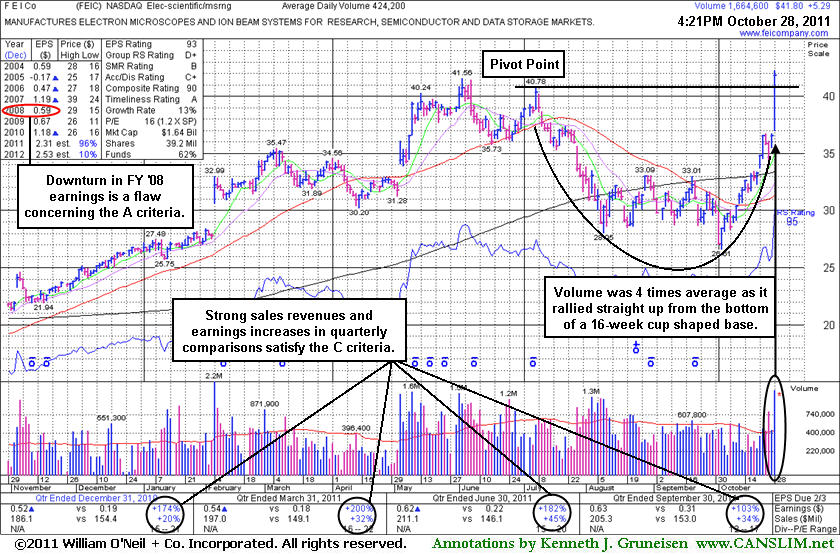
Sprinting Straight Up From Bottom of 16-Week Cup Shaped Base
Kenneth J. Gruneisen - Passed the CAN SLIM® Master's Exam
F E I Co (FEIC +$5.20 or +14.24% to $41.71) was highlighted in yellow in the mid-day report with a pivot point based on its 7/07/11 high plus 10 cents. It finished strong after a considerable gap up gain, rallying straight up from the bottom of a 16-week cup shaped base and triggering a technical buy signal. It hit a new all-time high while volume was four times average behind the gain. The strong action came after reporting earnings +103% on +34% sales revenues for the quarter ended September 30, 2011 versus the year ago period. Sales revenues and earnings increases (C criteria) have been strong in recent quarterly comparisons. Concern was previously noted because its annual earnings (A criteria) history was up and down, yet recent fundamental and technical action has been a better match for winning models of the fact-based investment system.
The number of top-rated funds owning its shares rose from 327 in Dec '10 to 385 in Sep '11, a reassuring sign concerning the I criteria. Although its Group RS Rating is only a D+ leadership provided by other companies in the Electronics - Scientific Measuring industry group has been a reassuring sign concerning the L criteria. Its small supply of only 39.2 million shares outstanding is a favorable characteristic concerning the S criteria. Disciplined investors avoid chasing stocks more than +5% above a prior chart high, and they always limit losses at -7% by selling if a stock falls that much from their purchase price.
|
|
|
Color Codes Explained :
Y - Better candidates highlighted by our
staff of experts.
G - Previously featured
in past reports as yellow but may no longer be buyable under the
guidelines.
***Last / Change / Volume data in this table is the closing quote data***
Symbol/Exchange
Company Name
Industry Group |
PRICE |
CHANGE
(%Change) |
Day High |
Volume
(% DAV)
(% 50 day avg vol) |
52 Wk Hi
% From Hi |
Featured
Date |
Price
Featured |
Pivot Featured |
|
Max Buy |
AAPL
-
NASDAQ
Apple Inc
COMPUTER HARDWARE - Personal Computers
|
$404.95
|
+0.26
0.06% |
$406.35
|
11,515,029
52.49% of 50 DAV
50 DAV is 21,937,700
|
$426.70
-5.10%
|
9/16/2011
|
$399.14
|
PP = $404.60
|
|
MB = $424.83
|
 Most Recent Note - 10/28/2011 6:18:52 PM
G - Volume totals have been cooling while consolidating above its 50 DMA line and it is now perched just -5.1% off its all-time high. It has not formed a sound base pattern and ownership by top-rated funds has fallen some.
>>> The latest Featured Stock Update with an annotated graph appeared on 10/20/2011. Click here.
View all notes |
Alert me of new notes |
CANSLIM.net Company Profile |
SEC |
Zacks Reports |
StockTalk |
News |
Chart |
Request a new note
C
A N
S L
I M


|
ADS
-
NYSE
Alliance Data Sys Corp
COMPUTER SOFTWARE and SERVICES - Information and Delivery Service
|
$104.97
|
+0.45
0.43% |
$105.19
|
1,086,841
112.44% of 50 DAV
50 DAV is 966,600
|
$105.67
-0.66%
|
10/21/2011
|
$97.94
|
PP = $101.15
|
|
MB = $106.21
|
Most Recent Note - 10/28/2011 6:21:02 PM
Y - Held its ground today after its considerable volume-driven gap up gain on 10/27/11 confirmed a technical buy signal. Its 50 DMA line and recent chart lows define near-term support to watch on pullbacks.
>>> The latest Featured Stock Update with an annotated graph appeared on 10/21/2011. Click here.
View all notes |
Alert me of new notes |
CANSLIM.net Company Profile |
SEC |
Zacks Reports |
StockTalk |
News |
Chart |
Request a new note
C
A N
S L
I M
|
ALXN
-
NASDAQ
Alexion Pharmaceuticals
DRUGS - Drug Manufacturers - Other
|
$67.93
|
+0.39
0.58% |
$68.49
|
906,145
58.44% of 50 DAV
50 DAV is 1,550,500
|
$70.42
-3.54%
|
9/15/2011
|
$63.20
|
PP = $60.81
|
|
MB = $63.85
|
Most Recent Note - 10/28/2011 6:23:46 PM
G - Hovering near its all-time high with volume totals cooling while stubbornly holding its ground. Its 50 DMA line defines chart support to watch on pullbacks.
>>> The latest Featured Stock Update with an annotated graph appeared on 10/18/2011. Click here.
View all notes |
Alert me of new notes |
CANSLIM.net Company Profile |
SEC |
Zacks Reports |
StockTalk |
News |
Chart |
Request a new note
C
A N
S L
I M
|
CELG
-
NASDAQ
Celgene Corp
DRUGS - Drug Manufacturers - Major
|
$66.19
|
+0.90
1.38% |
$66.29
|
3,231,552
82.81% of 50 DAV
50 DAV is 3,902,400
|
$68.25
-3.02%
|
9/16/2011
|
$61.21
|
PP = $62.59
|
|
MB = $65.72
|
Most Recent Note - 10/28/2011 6:25:42 PM
G - Hovering near its all-time high, slightly extended from its latest sound base pattern. Reported earnings +36% on +37% sales revenues for the quarter ended September 30, 2011 versus the year ago period.
>>> The latest Featured Stock Update with an annotated graph appeared on 10/14/2011. Click here.
View all notes |
Alert me of new notes |
CANSLIM.net Company Profile |
SEC |
Zacks Reports |
StockTalk |
News |
Chart |
Request a new note
C
A N
S L
I M
|
CEVA
-
NASDAQ
Ceva Inc
ELECTRONICS - Semiconductor - Specialized
|
$33.02
|
+1.51
4.79% |
$34.50
|
491,342
219.35% of 50 DAV
50 DAV is 224,000
|
$35.60
-7.25%
|
10/28/2011
|
$34.38
|
PP = $35.70
|
|
MB = $37.49
|
Most Recent Note - 10/28/2011 6:30:08 PM
Y - Challenged its 52-week high today while posting a 2nd consecutive considerable volume-driven gain. It gapped up on the prior session and broke out of a "double bottom" base pattern after reporting earnings +86% on +39% sales revenues for the quarter ended September 30, 2011 versus the year ago period. It had slumped below its 200 DMA line during its consolidation since dropped from the Featured Stocks list on 6/17/11. Volume-driven gains this week are indicative of institutional accumulation. In today's mid-day report (read here) it was featured in yellow with pivot point based on its 52-week high plus 10 cents while rallying "straight up from the bottom" of a 22-week cup shaped base. No overhead supply remains to act as resistance, and volume-driven gains above its pivot point may trigger a new technical buy signal.
>>> The latest Featured Stock Update with an annotated graph appeared on 5/25/2011. Click here.
View all notes |
Alert me of new notes |
CANSLIM.net Company Profile |
SEC |
Zacks Reports |
StockTalk |
News |
Chart |
Request a new note
C
A N
S L
I M
|
Symbol/Exchange
Company Name
Industry Group |
PRICE |
CHANGE
(%Change) |
Day High |
Volume
(% DAV)
(% 50 day avg vol) |
52 Wk Hi
% From Hi |
Featured
Date |
Price
Featured |
Pivot Featured |
|
Max Buy |
FEIC
-
NASDAQ
F E I Co
ELECTRONICS - Diversified Electronics
|
$41.71
|
+5.20
14.24% |
$42.25
|
1,737,399
409.57% of 50 DAV
50 DAV is 424,200
|
$41.56
0.36%
|
10/28/2011
|
$40.31
|
PP = $40.88
|
|
MB = $42.92
|
Most Recent Note - 10/28/2011 6:33:53 PM
Y - Hit a new 52-week high and finished strong today after featured in yellow in the mid-day report (read here) with pivot point based on its 7/07/11 high plus 10 cents. It triggered a technical buy signal with 4 times average volume while rallying straight up from the bottom of a 16-week cup shaped base. Reported earnings +103% on +34% sales revenues for the quarter ended September 30, 2011 versus the year ago period. Sales revenues and earnings increases (C criteria) have been strong in recent quarterly comparisons. Concern was previously noted because its annual earnings (A criteria) history was up and down, yet recent fundamental and technical action has been a better match for winning models of the fact-based investment system. See the latest FSU analysis for more details and an annotated graph.
>>> The latest Featured Stock Update with an annotated graph appeared on 10/28/2011. Click here.
View all notes |
Alert me of new notes |
CANSLIM.net Company Profile |
SEC |
Zacks Reports |
StockTalk |
News |
Chart |
Request a new note
C
A N
S L
I M
|
GNC
-
NYSE
G N C Holdings Inc
RETAIL - Drug Stores
|
$24.58
|
-0.09
-0.36% |
$24.84
|
1,403,847
125.32% of 50 DAV
50 DAV is 1,120,200
|
$26.48
-7.18%
|
10/26/2011
|
$24.60
|
PP = $24.80
|
|
MB = $26.04
|
Most Recent Note - 10/28/2011 6:35:36 PM
Y - Perched only -7.2% off its 52-week high after 4 consecutive winning weeks with ever-increasing volume. On 10/25/11 it priced a Secondary Offering after the 10/24/11 gain with more than 4 times average volume triggered a technical buy signal. Strong quarterly and annual earnings history satisfies the C and A criteria.
>>> The latest Featured Stock Update with an annotated graph appeared on 10/26/2011. Click here.
View all notes |
Alert me of new notes |
CANSLIM.net Company Profile |
SEC |
Zacks Reports |
StockTalk |
News |
Chart |
Request a new note
C
A N
S L
I M
|
HMSY
-
NASDAQ
H M S Holdings Corp
COMPUTER SOFTWARE and SERVICES - Healthcare Information Service
|
$23.60
|
-3.53
-13.01% |
$25.97
|
3,709,697
695.74% of 50 DAV
50 DAV is 533,200
|
$28.25
-16.45%
|
10/27/2011
|
$26.44
|
PP = $28.37
|
|
MB = $29.79
|
Most Recent Note - 10/28/2011 6:36:31 PM
G - Reported earnings +31% on +15% sales revenues for the quarter ended September 30, 2011 versus the year ago period. Gapped down today and violated its 50 and 200 DMA lines. The damaging loss raised concerns and triggered technical sell signals, and its color code was changed to green. In the prior mid-day report it was highlighted in yellow with pivot point based on its 52-week high plus 10 cents, however disciplined investors will note that it did not trigger a technical buy signal.
>>> The latest Featured Stock Update with an annotated graph appeared on 5/23/2011. Click here.
View all notes |
Alert me of new notes |
CANSLIM.net Company Profile |
SEC |
Zacks Reports |
StockTalk |
News |
Chart |
Request a new note
C
A N
S L
I M
|
ISRG
-
NASDAQ
Intuitive Surgical Inc
HEALTH SERVICES - Medical Appliances and Equipment
|
$436.53
|
+1.22
0.28% |
$443.00
|
369,971
80.66% of 50 DAV
50 DAV is 458,700
|
$440.68
-0.94%
|
10/19/2011
|
$424.69
|
PP = $415.29
|
|
MB = $436.05
|
Most Recent Note - 10/28/2011 6:37:33 PM
G - Recently wedging further above its "max buy" level, getting more extended from its prior base. Prior highs define important support to watch on pullbacks.
>>> The latest Featured Stock Update with an annotated graph appeared on 10/19/2011. Click here.
View all notes |
Alert me of new notes |
CANSLIM.net Company Profile |
SEC |
Zacks Reports |
StockTalk |
News |
Chart |
Request a new note
C
A N
S L
I M
|
LABL
-
NASDAQ
Multi Color Corp
CONSUMER NON-DURABLES - Packaging and Containers
|
$26.94
|
-0.71
-2.57% |
$27.98
|
31,303
56.40% of 50 DAV
50 DAV is 55,500
|
$28.00
-3.79%
|
10/17/2011
|
$27.81
|
PP = $28.10
|
|
MB = $29.51
|
Most Recent Note - 10/28/2011 6:38:40 PM
Y - Quietly perched only -3.8% off its 52-week high. Very little overhead supply remains to act as resistance. Subsequent volume-driven gains into new high ground may trigger a technical buy signal. Last week's low near its 50 DMA line defines near-term support to watch where any violation would raise concerns.
>>> The latest Featured Stock Update with an annotated graph appeared on 10/17/2011. Click here.
View all notes |
Alert me of new notes |
CANSLIM.net Company Profile |
SEC |
Zacks Reports |
StockTalk |
News |
Chart |
Request a new note
C
A N
S L
I M
|
Symbol/Exchange
Company Name
Industry Group |
PRICE |
CHANGE
(%Change) |
Day High |
Volume
(% DAV)
(% 50 day avg vol) |
52 Wk Hi
% From Hi |
Featured
Date |
Price
Featured |
Pivot Featured |
|
Max Buy |
MG
-
NYSE
Mistras Group Inc
DIVERSIFIED SERVICES - Bulding and Faci;ity Management Services
|
$22.49
|
-0.37
-1.62% |
$23.00
|
162,276
72.61% of 50 DAV
50 DAV is 223,500
|
$23.51
-4.34%
|
10/28/2011
|
$22.49
|
PP = $23.61
|
|
MB = $24.79
|
Most Recent Note - 10/28/2011 6:42:48 PM
Y - Hovering near its all-time high, its orderly consolidation has formed an advanced "3-weeks tight" base. Color code is changed to yellow with new pivot point cited based on its 52-week high plus 10 cents. Prior highs in the $20-21 area define initial chart support to watch above its 50 DMA line.
>>> The latest Featured Stock Update with an annotated graph appeared on 10/12/2011. Click here.
View all notes |
Alert me of new notes |
CANSLIM.net Company Profile |
SEC |
Zacks Reports |
StockTalk |
News |
Chart |
Request a new note
C
A N
S L
I M
|
MKTX
-
NASDAQ
Marketaxess Holdings Inc
FINANCIAL SERVICES - Investment Brokerage - Nationa
|
$29.84
|
-0.30
-1.00% |
$30.50
|
326,999
124.76% of 50 DAV
50 DAV is 262,100
|
$30.95
-3.58%
|
10/28/2011
|
$29.79
|
PP = $31.05
|
|
MB = $32.60
|
Most Recent Note - 10/28/2011 6:44:56 PM
Y - Perched near its 52-week high today after an 8-week base-on-base type consolidation. Color code was changed to yellow in today's mid-day report (read here) and new pivot point cited was based on its 52-week high plus 10 cents. A subsequent breakout would trigger a new technical buy signal. Its rebound above its 50 DMA line this week helped its outlook. Fundamentals remain strong and it just reported earnings +55% on +24% sales revenues for the quarter ended September 30, 2011 versus the year ago period. Based on weak action it was dropped from the Featured Stocks list on 10/03/11, yet it found impressive support and stayed well above its 200 DMA line.
>>> The latest Featured Stock Update with an annotated graph appeared on 9/27/2011. Click here.
View all notes |
Alert me of new notes |
CANSLIM.net Company Profile |
SEC |
Zacks Reports |
StockTalk |
News |
Chart |
Request a new note
C
A N
S L
I M
|
OPNT
-
NASDAQ
Opnet Technologies
INTERNET - Internet Software and Services
|
$44.65
|
+1.51
3.50% |
$45.15
|
257,790
142.35% of 50 DAV
50 DAV is 181,100
|
$45.92
-2.76%
|
10/11/2011
|
$38.45
|
PP = $42.02
|
|
MB = $44.12
|
Most Recent Note - 10/28/2011 6:46:35 PM
G - Gain today with above average volume led to a close above its "max buy" level and its color code is changed to green. Prior highs in the $41 area define near-term chart support to watch. Due to report earnings on Wednesday, November 9th.
>>> The latest Featured Stock Update with an annotated graph appeared on 10/25/2011. Click here.
View all notes |
Alert me of new notes |
CANSLIM.net Company Profile |
SEC |
Zacks Reports |
StockTalk |
News |
Chart |
Request a new note
C
A N
S L
I M
|
SWI
-
NYSE
Solarwinds Inc
COMPUTER SOFTWARE and SERVICES - Application Software
|
$28.43
|
+0.53
1.90% |
$28.60
|
2,531,413
245.05% of 50 DAV
50 DAV is 1,033,000
|
$28.58
-0.52%
|
10/27/2011
|
$27.78
|
PP = $25.62
|
|
MB = $26.90
|
Most Recent Note - 10/28/2011 6:49:04 PM
Y - Posted a second consecutive volume-driven gain today for a new all-time high. Color code is changed to green after quickly getting extended from its latest base. See the latest FSU analysis for more details and an annotated graph.
>>> The latest Featured Stock Update with an annotated graph appeared on 10/27/2011. Click here.
View all notes |
Alert me of new notes |
CANSLIM.net Company Profile |
SEC |
Zacks Reports |
StockTalk |
News |
Chart |
Request a new note
C
A N
S L
I M
|
UA
-
NYSE
Under Armour Inc Cl A
CONSUMER NON-DURABLES - Textile - Apparel Clothing
|
$85.83
|
-0.17
-0.20% |
$86.00
|
1,174,980
79.15% of 50 DAV
50 DAV is 1,484,500
|
$86.15
-0.37%
|
10/25/2011
|
$82.43
|
PP = $80.80
|
|
MB = $84.84
|
Most Recent Note - 10/28/2011 6:50:40 PM
G - Paused near its all-time high after 6 consecutive gains. It is slightly extended from the reverse-head-and-shoulders base pattern recently highlighted in the 10/25/11 mid-day report.

>>> The latest Featured Stock Update with an annotated graph appeared on 7/26/2011. Click here.
View all notes |
Alert me of new notes |
CANSLIM.net Company Profile |
SEC |
Zacks Reports |
StockTalk |
News |
Chart |
Request a new note
C
A N
S L
I M
|
Symbol/Exchange
Company Name
Industry Group |
PRICE |
CHANGE
(%Change) |
Day High |
Volume
(% DAV)
(% 50 day avg vol) |
52 Wk Hi
% From Hi |
Featured
Date |
Price
Featured |
Pivot Featured |
|
Max Buy |
V
-
NYSE
Visa Inc Cl A
DIVERSIFIED SERVICES - Business/Management Services
|
$95.10
|
+0.70
0.74% |
$95.75
|
5,824,717
106.13% of 50 DAV
50 DAV is 5,488,100
|
$94.75
0.37%
|
10/24/2011
|
$94.21
|
PP = $94.85
|
|
MB = $99.59
|
Most Recent Note - 10/28/2011 6:52:24 PM
Y - Inched to a new 52-week high and traded above its pivot point today, however volume was near average, not heavy enough to trigger a proper new technical buy signal. Reported earnings +34% on +13% sales revenues for the quarter ended September 30, 2011 versus the year ago period, beating earnings expectations while it missed on revenues.
>>> The latest Featured Stock Update with an annotated graph appeared on 10/24/2011. Click here.
View all notes |
Alert me of new notes |
CANSLIM.net Company Profile |
SEC |
Zacks Reports |
StockTalk |
News |
Chart |
Request a new note
C
A N
S L
I M
|
|
|
|
THESE ARE NOT BUY RECOMMENDATIONS!
Comments contained in the body of this report are technical
opinions only. The material herein has been obtained
from sources believed to be reliable and accurate, however,
its accuracy and completeness cannot be guaranteed.
This site is not an investment advisor, hence it does
not endorse or recommend any securities or other investments.
Any recommendation contained in this report may not
be suitable for all investors and it is not to be deemed
an offer or solicitation on our part with respect to
the purchase or sale of any securities. All trademarks,
service marks and trade names appearing in this report
are the property of their respective owners, and are
likewise used for identification purposes only.
This report is a service available
only to active Paid Premium Members.
You may opt-out of receiving report notifications
at any time. Questions or comments may be submitted
by writing to Premium Membership Services 665 S.E. 10 Street, Suite 201 Deerfield Beach, FL 33441-5634 or by calling 1-800-965-8307
or 954-785-1121.
|
|
|

