You are not logged in.
This means you
CAN ONLY VIEW reports that were published prior to Wednesday, April 2, 2025.
You
MUST UPGRADE YOUR MEMBERSHIP if you want to see any current reports.
AFTER MARKET UPDATE - THURSDAY, OCTOBER 27TH, 2011
Previous After Market Report Next After Market Report >>>
|
|
|
|
DOW |
+339.51 |
12,208.55 |
+2.86% |
|
Volume |
1,430,602,290 |
+29% |
|
Volume |
2,728,657,100 |
+33% |
|
NASDAQ |
+87.96 |
2,738.63 |
+3.32% |
|
Advancers |
2,689 |
86% |
|
Advancers |
2,202 |
81% |
|
S&P 500 |
+42.59 |
1,284.59 |
+3.43% |
|
Decliners |
393 |
13% |
|
Decliners |
437 |
16% |
|
Russell 2000 |
+38.28 |
765.43 |
+5.26% |
|
52 Wk Highs |
172 |
|
|
52 Wk Highs |
110 |
|
|
S&P 600 |
+20.55 |
421.21 |
+5.13% |
|
52 Wk Lows |
6 |
|
|
52 Wk Lows |
25 |
|
|
 |
Stocks Surge With Higher Volume and Positive Breadth
Kenneth J. Gruneisen - Passed the CAN SLIM® Master's Exam
The major averages opened higher on Thursday with a clearly positive bias, then stocks built on their early gains. The Dow Jones Industrial Average, S&P 500 Index, and the Nasdaq Composite Index collectively rallied above their respective 200-day moving average lines. The trading volume totals reported on the NYSE and on the Nasdaq exchange were markedly higher than the prior session, a very encouraging sign of much better buying demand coming from the institutional crowd. Breadth was very positive as advancers led declining issues by almost 7-1 on the NYSE and 5-1 on the Nasdaq exchange. New 52-week highs easily outnumbered new 52-week lows on the NYSE and on the Nasdaq exchange. There were 99 high-ranked companies from the CANSLIM.net Leaders List that made new 52-week highs and appeared on the CANSLIM.net BreakOuts Page, up sharply from the prior session total of 26 stocks. There were gains for 11 of the 13 high-ranked companies currently included on the Featured Stocks Page, a list that has recently been growing again.
Stocks rallied, bolstered by Europe’s proposed bailout efforts and signs the economy is not headed for another recession. Asian markets rallied in the overnight session and European markets surged on the news. The futures were sharply higher this morning after Europe's leaders agreed to measures to stem the region's debt crisis. At yesterday’s summit in Brussels, euro zone policy makers agreed to an increase of the bailout fund to $1.4 trillion. Bondholders of Greek debt will have to take a 50% loss. The measures include a recapitalization of the region's banks, the IMF possibly taking a larger role in the bailout and commitment of more austerity measures by Italy.
Financials were the standouts of the impressive rally, paced by Morgan Stanley (MS +17%). Shares of Dow components Bank of America Corp (BAC +9.56%) and JP Morgan Chase & Co (JPM +8.3%) rose, and Citigroup Inc (C +9.70%) also posted a big gain. Ameriprise Financial Inc (AMP +13.23%) and AFLAC Inc (AFL +8.69%) rose after positive earnings releases
The latest GDP report also provided a tailwind to the major averages. An initial report on third-quarter GDP showed the economy grew an annualized 2.5%, driven by consumer spending and business investment. The weekly initial jobless claims were essentially in line with projections. Stocks tied to the economy rose with Alcoa Inc (AA +9.46%), Freeport McMoRan Copper & Gold Inc (FCX +8.78%) and Caterpillar Inc (CAT +5.20%) all advanced considerably. Crude oil prices rose +2.8% to $92.75 a barrel.
The 10-year note fell 1 15/32 to yield 2.38% as Europe's bailout plan increased demand for risk assets. The U.S. Treasury auctioned $29 billion of seven-year notes in the afternoon. In addition, the Fed is scheduled to purchase between $2.25 billion to $2.75 billion of government paper due from Feb 2036 and Aug 2041 as part of its "Operation Twist" program.
The October 2011 issue of our monthly newsletter CANSLIM.net News will be published soon with an informative review of current market conditions, leading groups, and best buy candidates. Via the Premium Member Homepage links to all prior reports and webcasts are always available.
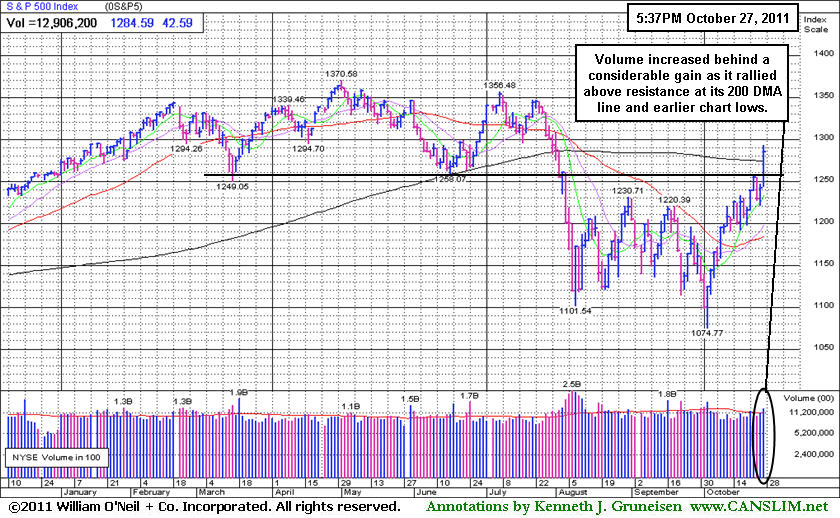
PICTURED: The day's gains lifted the S&P 500 Index above its 200-day moving average (DMA) line for the first time since the beginning of August, a sign of an improving trend for stocks after five straight months of losses. Volume increased behind the considerable gain as the benchmark index rallied above its 200 DMA line and earlier chart lows which had been violated with its early-August plunge. For the month of October, the S&P 500 is up +13.5%, the Nasdaq has gained +13.4%, and the Dow is up +11.9%.
|
 Kenneth J. Gruneisen started out as a licensed stockbroker in August 1987, a couple of months prior to the historic stock market crash that took the Dow Jones Industrial Average down -22.6% in a single day. He has published daily fact-based fundamental and technical analysis on high-ranked stocks online for two decades. Through FACTBASEDINVESTING.COM, Kenneth provides educational articles, news, market commentary, and other information regarding proven investment systems that work in good times and bad.
Comments contained in the body of this report are technical opinions only and are not necessarily those of Gruneisen Growth Corp. The material herein has been obtained from sources believed to be reliable and accurate, however, its accuracy and completeness cannot be guaranteed. Our firm, employees, and customers may effect transactions, including transactions contrary to any recommendation herein, or have positions in the securities mentioned herein or options with respect thereto. Any recommendation contained in this report may not be suitable for all investors and it is not to be deemed an offer or solicitation on our part with respect to the purchase or sale of any securities. |
|
 |
Financial, Tech, Energy, and Retailers Led Defensive Groups
Kenneth J. Gruneisen - Passed the CAN SLIM® Master's Exam
The Networking Index ($NWX +5.57%) and Semiconductor Index ($SOX +4.28%) led the tech sector higher while the Internet Index ($IIX +3.58%) and the Biotechnology Index ($BTK +3.78%) followed with big gains. The Retail Index ($RLX +3.13%) rallied, and strength in energy-related shares boosted the Integrated Oil Index ($XOI +3.98%) and Oil Services Index ($OSX +5.96%) to large gains. Defensive groups including the Gold & Silver Index ($XAU +2.88%) and Healthcare Index ($HMO +2.89%) also posted solid gains, although they lagged other groups typically considered "growth" areas.
Charts courtesy www.stockcharts.com
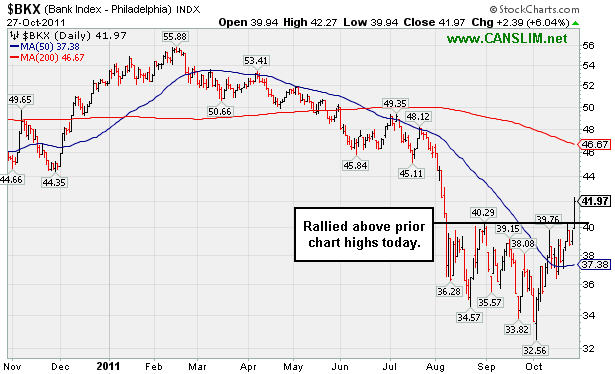
PICTURED 1: The Bank Index ($BKX +6.04%) rallied above prior chart highs today, clearing a technical hurdle that helps the overall outlook.
Charts courtesy www.stockcharts.com
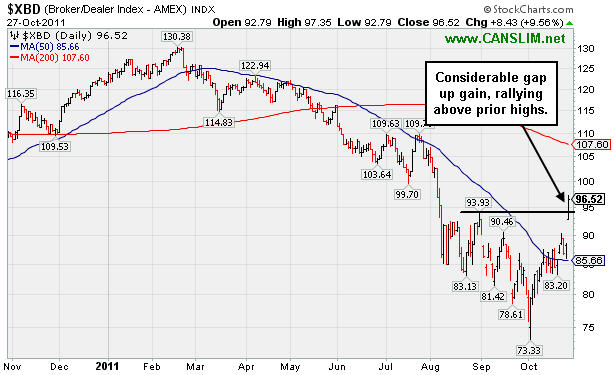
PICTURED 2: The Broker/Dealer Index ($XBD +9.56%) rallied above prior highs after a considerable gap up today.
| Oil Services |
$OSX |
241.22 |
+13.57 |
+5.96% |
-1.59% |
| Healthcare |
$HMO |
2,202.43 |
+61.81 |
+2.89% |
+30.17% |
| Integrated Oil |
$XOI |
1,270.72 |
+48.62 |
+3.98% |
+4.74% |
| Semiconductor |
$SOX |
395.74 |
+16.26 |
+4.28% |
-3.90% |
| Networking |
$NWX |
244.85 |
+12.92 |
+5.57% |
-12.73% |
| Internet |
$IIX |
300.59 |
+10.40 |
+3.58% |
-2.32% |
| Broker/Dealer |
$XBD |
96.52 |
+8.43 |
+9.56% |
-20.57% |
| Retail |
$RLX |
543.58 |
+16.48 |
+3.13% |
+6.92% |
| Gold & Silver |
$XAU |
203.36 |
+5.70 |
+2.88% |
-10.25% |
| Bank |
$BKX |
41.97 |
+2.39 |
+6.04% |
-19.61% |
| Biotech |
$BTK |
1,196.95 |
+43.64 |
+3.78% |
-7.76% |
|
|
|
 |
Breakaway Gap From Double Bottom Base Pattern
Kenneth J. Gruneisen - Passed the CAN SLIM® Master's Exam
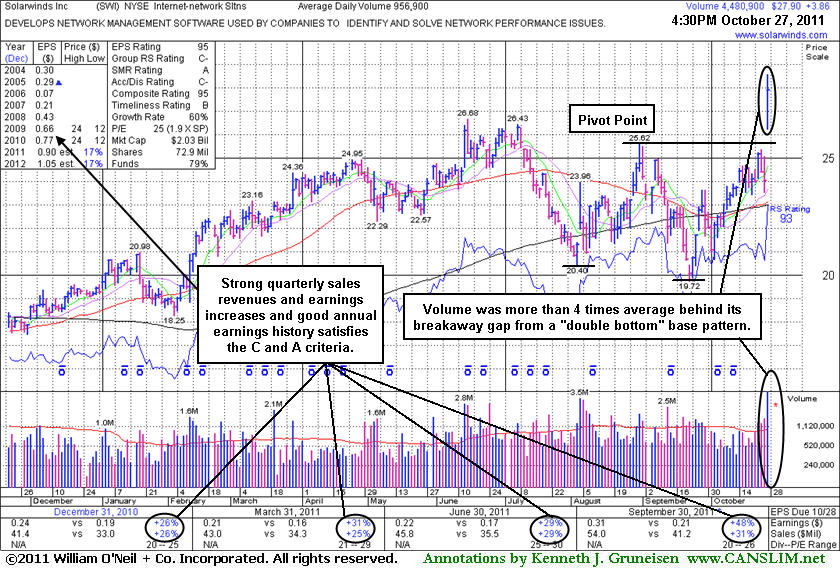
Solarwinds Inc (SWI +$3.86 or +16.06% to $27.90) gapped up today after reporting earnings +48% on +31% sales revenues for the quarter ended September 30, 2011 versus the year ago period. It was highlighted in yellow it the mid-day report (read here) with new pivot point cited based on the 8/31/11 high. Following its last appearance in this FSU section on 6/29/11 with an annotated graph included under the headline, "Prior Highs Acted As Support Following Powerful Breakout", it continued its consolidation and remained in good shape until a loss with above average volume on 7/14/11 triggered a technical sell signal that was noted. It was dropped from the Featured Stocks list on 7/21/11 and subsequently slumped below its 200-day moving average (DMA) line.
Today's "breakaway gap" helped SWI technically break out from a "double bottom" base formed over the past 5 months. Volume was more than 4 times average behind the considerable gain, a clear indication of institutional accumulation. A breakaway gap is the one noted exception where a stock may be bought more than +5% above its prior highs, however chasing a stock farther above prior highs increases the chance investors may be prompted to sell based on an ordinary pullback if they follow strict selling rules which say to always limit losses if a stock falls more than -7% from your purchase price.
Prior quarterly comparisons showed sales and earnings near the investment system guidelines, and the latest quarter showed even better increases which marked an acceleration in its growth rate. The number of top-rated funds owning its shares rose from 291 in June '10 to 404 in Sep '11, a reassuring sign concerning the I criteria of the fact-based investment system.
|
|
|
Color Codes Explained :
Y - Better candidates highlighted by our
staff of experts.
G - Previously featured
in past reports as yellow but may no longer be buyable under the
guidelines.
***Last / Change / Volume data in this table is the closing quote data***
Symbol/Exchange
Company Name
Industry Group |
PRICE |
CHANGE
(%Change) |
Day High |
Volume
(% DAV)
(% 50 day avg vol) |
52 Wk Hi
% From Hi |
Featured
Date |
Price
Featured |
Pivot Featured |
|
Max Buy |
AAPL
-
NASDAQ
Apple Inc
COMPUTER HARDWARE - Personal Computers
|
$404.69
|
+4.09
1.02% |
$409.00
|
17,662,369
80.65% of 50 DAV
50 DAV is 21,900,000
|
$426.70
-5.16%
|
9/16/2011
|
$399.14
|
PP = $404.60
|
|
MB = $424.83
|
Most Recent Note - 10/25/2011 6:42:53 PM
G - Quietly consolidating above its 50 DMA line with volume totals cooling following distributional losses last week. It has not formed a sound base pattern and ownership by top-rated funds has fallen some.
>>> The latest Featured Stock Update with an annotated graph appeared on 10/20/2011. Click here.
View all notes |
Alert me of new notes |
CANSLIM.net Company Profile |
SEC |
Zacks Reports |
StockTalk |
News |
Chart |
Request a new note
C
A N
S L
I M


|
ADS
-
NYSE
Alliance Data Sys Corp
COMPUTER SOFTWARE and SERVICES - Information and Delivery Service
|
$104.52
|
+3.66
3.63% |
$105.67
|
1,893,454
199.46% of 50 DAV
50 DAV is 949,300
|
$102.46
2.01%
|
10/21/2011
|
$97.94
|
PP = $101.15
|
|
MB = $106.21
|
 Most Recent Note - 10/27/2011 3:50:04 PM
Y - Gapped up today, and its considerable volume-driven gain has it rallying above its pivot point confirming a technical buy signal. Its 50 DMA line and recent chart lows define near-term support to watch on pullbacks.
>>> The latest Featured Stock Update with an annotated graph appeared on 10/21/2011. Click here.
View all notes |
Alert me of new notes |
CANSLIM.net Company Profile |
SEC |
Zacks Reports |
StockTalk |
News |
Chart |
Request a new note
C
A N
S L
I M
|
ALXN
-
NASDAQ
Alexion Pharmaceuticals
DRUGS - Drug Manufacturers - Other
|
$67.54
|
+0.69
1.03% |
$68.15
|
990,966
63.79% of 50 DAV
50 DAV is 1,553,500
|
$70.42
-4.09%
|
9/15/2011
|
$63.20
|
PP = $60.81
|
|
MB = $63.85
|
Most Recent Note - 10/25/2011 6:49:40 PM
G - Loss today on light volume followed 3 consecutive gains with better but mostly average volume conviction. Support to watch includes prior resistance in the $59-60 area and its upwardly tilted 50 DMA line.
>>> The latest Featured Stock Update with an annotated graph appeared on 10/18/2011. Click here.
View all notes |
Alert me of new notes |
CANSLIM.net Company Profile |
SEC |
Zacks Reports |
StockTalk |
News |
Chart |
Request a new note
C
A N
S L
I M
|
CELG
-
NASDAQ
Celgene Corp
DRUGS - Drug Manufacturers - Major
|
$65.29
|
-1.18
-1.78% |
$66.83
|
7,610,110
200.14% of 50 DAV
50 DAV is 3,802,400
|
$68.25
-4.34%
|
9/16/2011
|
$61.21
|
PP = $62.59
|
|
MB = $65.72
|
Most Recent Note - 10/27/2011 12:00:01 PM
G - Reported earnings +36% on +37% sales revenues for the quarter ended September 30, 2011 versus the year ago period. Encountering some distributional pressure today, slumping below its "max buy" level amid an otherwise strong broad-based rally.
>>> The latest Featured Stock Update with an annotated graph appeared on 10/14/2011. Click here.
View all notes |
Alert me of new notes |
CANSLIM.net Company Profile |
SEC |
Zacks Reports |
StockTalk |
News |
Chart |
Request a new note
C
A N
S L
I M
|
GNC
-
NYSE
G N C Holdings Inc
RETAIL - Drug Stores
|
$24.67
|
-0.08
-0.32% |
$25.24
|
3,376,860
319.81% of 50 DAV
50 DAV is 1,055,900
|
$26.48
-6.84%
|
10/26/2011
|
$24.60
|
PP = $24.80
|
|
MB = $26.04
|
Most Recent Note - 10/27/2011 12:24:46 PM
Y - Still perched near its 52-week high after volume-driven gains helped it rally from a "double bottom" base pattern. Following the close on 10/25/11 it priced a Secondary Offering. Color code was changed to yellow with pivot point based on its 9/01/11 high. The 10/24/11 gain with more than 4 times average volume triggered a technical buy signal. No resistance remains due to overhead supply. Strong quarterly and annual earnings history satisfies the C and A criteria.
>>> The latest Featured Stock Update with an annotated graph appeared on 10/26/2011. Click here.
View all notes |
Alert me of new notes |
CANSLIM.net Company Profile |
SEC |
Zacks Reports |
StockTalk |
News |
Chart |
Request a new note
C
A N
S L
I M
|
Symbol/Exchange
Company Name
Industry Group |
PRICE |
CHANGE
(%Change) |
Day High |
Volume
(% DAV)
(% 50 day avg vol) |
52 Wk Hi
% From Hi |
Featured
Date |
Price
Featured |
Pivot Featured |
|
Max Buy |
HMSY
-
NASDAQ
H M S Holdings Corp
COMPUTER SOFTWARE and SERVICES - Healthcare Information Service
|
$27.13
|
+0.87
3.31% |
$27.52
|
1,220,954
236.12% of 50 DAV
50 DAV is 517,100
|
$28.25
-3.95%
|
10/27/2011
|
$26.44
|
PP = $28.37
|
|
MB = $29.79
|
Most Recent Note - 10/27/2011 12:37:23 PM
Y - Color code is changed to yellow with pivot point based on its 52-week high plus 10 cents. Due to report earnings before the open tomorrow. No overhead supply remains after recently rebounding to within close striking distance of its 52-week high. It had slumped below its 200 DMA line and there was a 3:1 stock split (effective 8/17/11) since it was dropped from the Featured Stocks list on 6/06/11.
>>> The latest Featured Stock Update with an annotated graph appeared on 5/23/2011. Click here.
View all notes |
Alert me of new notes |
CANSLIM.net Company Profile |
SEC |
Zacks Reports |
StockTalk |
News |
Chart |
Request a new note
C
A N
S L
I M
|
ISRG
-
NASDAQ
Intuitive Surgical Inc
HEALTH SERVICES - Medical Appliances and Equipment
|
$435.31
|
+15.94
3.80% |
$440.68
|
600,677
132.72% of 50 DAV
50 DAV is 452,600
|
$429.44
1.37%
|
10/19/2011
|
$424.69
|
PP = $415.29
|
|
MB = $436.05
|
Most Recent Note - 10/27/2011 3:53:21 PM
G - Gap up gain today has it rallying above its "max buy" level, and its color code is changed to green while getting extended from its prior base. Prior highs define important support to watch on pullbacks.
>>> The latest Featured Stock Update with an annotated graph appeared on 10/19/2011. Click here.
View all notes |
Alert me of new notes |
CANSLIM.net Company Profile |
SEC |
Zacks Reports |
StockTalk |
News |
Chart |
Request a new note
C
A N
S L
I M
|
LABL
-
NASDAQ
Multi Color Corp
CONSUMER NON-DURABLES - Packaging and Containers
|
$27.65
|
+0.46
1.69% |
$28.00
|
83,943
154.31% of 50 DAV
50 DAV is 54,400
|
$28.00
-1.25%
|
10/17/2011
|
$27.81
|
PP = $28.10
|
|
MB = $29.51
|
Most Recent Note - 10/26/2011 5:43:10 PM
Y - Up today with light volume, finishing perched only -2.9% off its 52-week high. Very little overhead supply remains to act as resistance. Subsequent volume-driven gains into new high ground may trigger a technical buy signal. Last week's low near its 50 DMA line defines near-term support to watch where any violation would raise concerns.
>>> The latest Featured Stock Update with an annotated graph appeared on 10/17/2011. Click here.
View all notes |
Alert me of new notes |
CANSLIM.net Company Profile |
SEC |
Zacks Reports |
StockTalk |
News |
Chart |
Request a new note
C
A N
S L
I M
|
MG
-
NYSE
Mistras Group Inc
DIVERSIFIED SERVICES - Bulding and Faci;ity Management Services
|
$22.86
|
+1.15
5.30% |
$23.04
|
261,302
118.24% of 50 DAV
50 DAV is 221,000
|
$23.51
-2.76%
|
8/10/2011
|
$17.89
|
PP = $17.58
|
|
MB = $18.46
|
Most Recent Note - 10/27/2011 3:48:13 PM
G - Rallying today near its best-ever close. Prior highs in the $20-21 area define initial chart support to watch above its 50 DMA line.
>>> The latest Featured Stock Update with an annotated graph appeared on 10/12/2011. Click here.
View all notes |
Alert me of new notes |
CANSLIM.net Company Profile |
SEC |
Zacks Reports |
StockTalk |
News |
Chart |
Request a new note
C
A N
S L
I M
|
OPNT
-
NASDAQ
Opnet Technologies
INTERNET - Internet Software and Services
|
$43.14
|
+0.99
2.35% |
$44.59
|
279,361
154.60% of 50 DAV
50 DAV is 180,700
|
$45.92
-6.05%
|
10/11/2011
|
$38.45
|
PP = $42.02
|
|
MB = $44.12
|
Most Recent Note - 10/27/2011 3:55:40 PM
Y - Trading up near its "max buy" level again today. Prior highs in the $41 area define near-term chart support to watch. Due to report earnings on Wednesday, November 9th.
>>> The latest Featured Stock Update with an annotated graph appeared on 10/25/2011. Click here.
View all notes |
Alert me of new notes |
CANSLIM.net Company Profile |
SEC |
Zacks Reports |
StockTalk |
News |
Chart |
Request a new note
C
A N
S L
I M
|
Symbol/Exchange
Company Name
Industry Group |
PRICE |
CHANGE
(%Change) |
Day High |
Volume
(% DAV)
(% 50 day avg vol) |
52 Wk Hi
% From Hi |
Featured
Date |
Price
Featured |
Pivot Featured |
|
Max Buy |
SWI
-
NYSE
Solarwinds Inc
COMPUTER SOFTWARE and SERVICES - Application Software
|
$27.90
|
+3.86
16.06% |
$28.58
|
4,493,276
469.57% of 50 DAV
50 DAV is 956,900
|
$26.68
4.57%
|
10/27/2011
|
$27.78
|
PP = $25.62
|
|
MB = $26.90
|
Most Recent Note - 10/27/2011 1:42:34 PM
Y - Gapped up today after reporting earnings +48% on +31% sales revenues for the quarter ended September 30, 2011 versus the year ago period. Color code is changed to yellow with new pivot point cited based on the 8/31/11 high, and today's "breakaway gap" helped it technically break out from a "double bottom" base formed since 7/21/11 when it was dropped from the Featured Stocks list.
>>> The latest Featured Stock Update with an annotated graph appeared on 10/27/2011. Click here.
View all notes |
Alert me of new notes |
CANSLIM.net Company Profile |
SEC |
Zacks Reports |
StockTalk |
News |
Chart |
Request a new note
C
A N
S L
I M
|
UA
-
NYSE
Under Armour Inc Cl A
CONSUMER NON-DURABLES - Textile - Apparel Clothing
|
$86.00
|
+3.11
3.75% |
$86.15
|
2,026,018
136.93% of 50 DAV
50 DAV is 1,479,600
|
$83.69
2.76%
|
10/25/2011
|
$82.43
|
PP = $80.80
|
|
MB = $84.84
|
Most Recent Note - 10/27/2011 2:00:56 PM
G - Hitting new all-time highs with today's 6th consecutive gain, the 4th straight gain with above average volume. Color code is changed to green after getting extended from the reverse-head-and-shoulders base pattern recently highlighted in the 10/25/11 mid-day report.

>>> The latest Featured Stock Update with an annotated graph appeared on 7/26/2011. Click here.
View all notes |
Alert me of new notes |
CANSLIM.net Company Profile |
SEC |
Zacks Reports |
StockTalk |
News |
Chart |
Request a new note
C
A N
S L
I M
|
V
-
NYSE
Visa Inc Cl A
DIVERSIFIED SERVICES - Business/Management Services
|
$94.40
|
+2.38
2.59% |
$94.49
|
10,392,828
193.33% of 50 DAV
50 DAV is 5,375,700
|
$94.75
-0.37%
|
10/24/2011
|
$94.21
|
PP = $94.85
|
|
MB = $99.59
|
Most Recent Note - 10/27/2011 2:03:49 PM
Y - Reported earnings +34% on +13% sales revenues for the quarter ended September 30, 2011 versus the year ago period, beating earnings expectations while it missed on revenues. See the latest FSU analysis for more details and a new annotated weekly graph illustrating the latest base.
>>> The latest Featured Stock Update with an annotated graph appeared on 10/24/2011. Click here.
View all notes |
Alert me of new notes |
CANSLIM.net Company Profile |
SEC |
Zacks Reports |
StockTalk |
News |
Chart |
Request a new note
C
A N
S L
I M
|
|
|
|
THESE ARE NOT BUY RECOMMENDATIONS!
Comments contained in the body of this report are technical
opinions only. The material herein has been obtained
from sources believed to be reliable and accurate, however,
its accuracy and completeness cannot be guaranteed.
This site is not an investment advisor, hence it does
not endorse or recommend any securities or other investments.
Any recommendation contained in this report may not
be suitable for all investors and it is not to be deemed
an offer or solicitation on our part with respect to
the purchase or sale of any securities. All trademarks,
service marks and trade names appearing in this report
are the property of their respective owners, and are
likewise used for identification purposes only.
This report is a service available
only to active Paid Premium Members.
You may opt-out of receiving report notifications
at any time. Questions or comments may be submitted
by writing to Premium Membership Services 665 S.E. 10 Street, Suite 201 Deerfield Beach, FL 33441-5634 or by calling 1-800-965-8307
or 954-785-1121.
|
|
|

