You are not logged in.
This means you
CAN ONLY VIEW reports that were published prior to Monday, April 14, 2025.
You
MUST UPGRADE YOUR MEMBERSHIP if you want to see any current reports.
AFTER MARKET UPDATE - TUESDAY, OCTOBER 27TH, 2009
Previous After Market Report Next After Market Report >>>
|
|
|
|
DOW |
+14.21 |
9,882.17 |
+0.14% |
|
Volume |
1,396,267,040 |
+1% |
|
Volume |
2,417,701,520 |
+3% |
|
NASDAQ |
-25.76 |
2,116.09 |
-1.20% |
|
Advancers |
1,051 |
34% |
|
Advancers |
892 |
31% |
|
S&P 500 |
-3.54 |
1,063.41 |
-0.33% |
|
Decliners |
1,978 |
63% |
|
Decliners |
1,826 |
64% |
|
Russell 2000 |
-6.69 |
586.99 |
-1.13% |
|
52 Wk Highs |
62 |
|
|
52 Wk Highs |
29 |
|
|
S&P 600 |
-3.37 |
311.07 |
-1.07% |
|
52 Wk Lows |
11 |
|
|
52 Wk Lows |
24 |
|
|
 |
Negative Breadth Weighs On Market Yet Again
Adam Sarhan, Contributing Writer,
The major averages ended mixed to slightly lower as the bears continued flexing their strength. Decliners led advancers by nearly a 2-to-1 ratio on the NYSE and by over a 2-to-1 ratio on the Nasdaq exchange. Volume totals on the major stock exchanges were reported higher or near the prior session totals. This marked four "negative reversals" in the past five sessions for the S&P 500, Nasdaq Composite and Russell 2000 indexes. The recent action may be considered an ominous sign that suggests large institutions are heavily selling stocks. It puts serious pressure on the 34-week old rally.
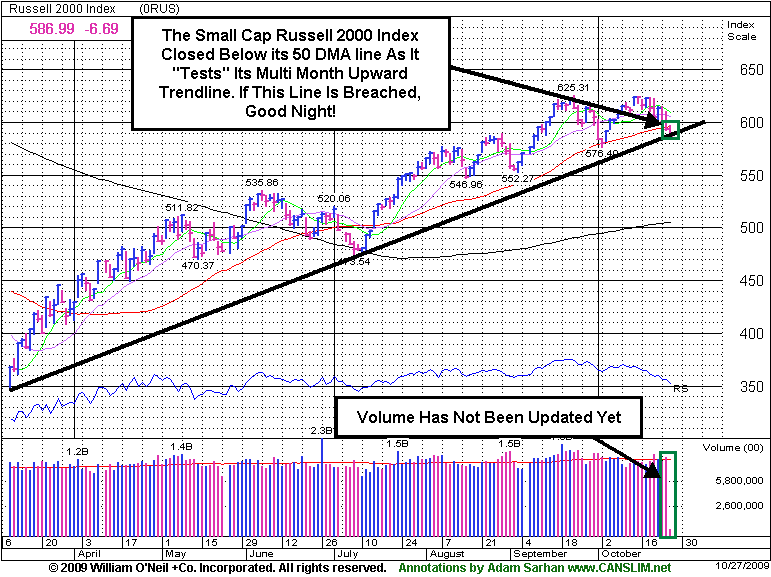
From our perspective, the current rally is under severe pressure, which bodes poorly concerning the M criteria. At least one encouraging sign to watch for is that the major averages continue trading above their respective 50-day moving average (DMA) lines and 8-month upward trendlines. Other important authorities on this subject might say that the rally is over and that we are in an official "market correction." We prefer not to argue over the semantics, the message is the same: play strong defense. We, however, shall continue giving the bulls the benefit of the doubt until one of the major averages (Dow Industrials, SP 500, or Nasdaq composite) slices and closes below its respective 50 DMA lines. Until then, a good defensive is still the best offensive as the bears continue to dominate the playing field.
On the economic front, consumer confidence unexpectedly dropped which sparked concern regarding the economic recovery. The Conference Board’s gauge of consumer sentiment fell short of estimates and its measure of employment availability slid to a 26-year low which hurt stocks on Tuesday. Bill Gross, manager of the world's largest bond fund, PIMCO said that "the six-month rally in riskier assets is likely at its pinnacle, with U.S. economic growth to lag behind historical averages." He went on to say that “Investors must recognize that if assets appreciate with nominal gross domestic product, a 4-5 percent return is about all they can expect even with abnormally low policy rates.” Gross wrote, “Rage, rage, against this conclusion if you wish, but the six-month rally in risk assets -- while still continuously supported by Fed and Treasury policy makers -- is likely at its pinnacle.” We have learned over the years to pay attention to Mr. Gross since his "outlook" tends to be spot on.
A slew of leading stocks continued to get smacked, which bodes poorly for this aging rally. The day's worst hit leaders among currently Featured Stocks included, Baidu Inc. (BIDU -11.39%) gapped down after reporting Q3 results after Monday's close. The Chinese search engine said profits rose +41% last quarter and sales jumped +40%, but that failed to entice buyers. After gapping down below its 50 DMA line it managed to rally back and close above that important level. Pegasystems Inc. (PEGA -7.05%) also got smacked and sliced below its multi-month upward trendline and 50 DMA line on heavy turnover. Remember to closely adhere to your stops and never fight the tape!
PICTURED: The Small Cap Russell 2000 Index closed below its 50 DMA line while testing a multi-month upward trendline. If this line is breached it would be even more compelling evidence that market conditions (M criteria) are deteriorating.
|
|
|
 |
Healthcare Group Posted A Standout Gain While Most Groups Pulled Back
Kenneth J. Gruneisen - Passed the CAN SLIM® Master's Exam
The Healthcare Index ($HMO +3.67%) group was a standout gainer, and the Biotechnology Index ($BTK +0.09%) held its ground amid widespread losses on Tuesday. The Retail Index ($RLX -1.58%) sank from the prior session's new 2009 high. The Semiconductor Index ($SOX -2.52%), Internet Index ($IIX -1.82%), and Networking Index ($NWX -1.37%) fell, collectively pressuring the tech-heavy Nasdaq Composite Index much worse than its peers. Financial shares created a drag on the market as the Broker/Dealer Index ($XBD -1.16%) slumped further below its 50-day moving average (DMA) line and the Bank Index ($BKX -1.01%) fell toward its recent chart lows. The influential finance sector indexes bear watching closely due to their great importance as a leading indicator, and both charts were shown in yesterday's report (read here). Energy-related shares were mixed as the Oil Services Index ($OSX -0.66%) rose slightly and the Integrated Oil Index ($XOI +0.75%) posted a small gain.
Charts courtesy www.stockcharts.com
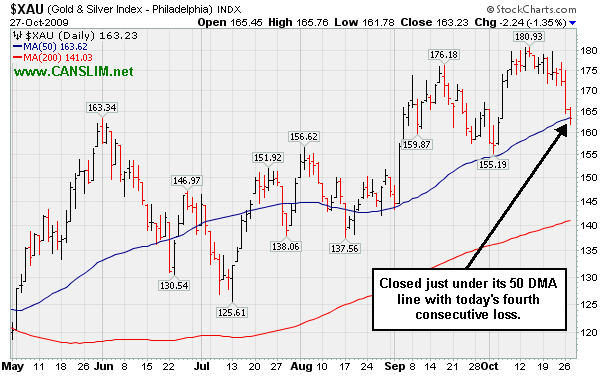
PICTURED: The Gold & Silver Index ($XAU -1.35%) proved to be an nonconstructive "safe haven" area for investors as it fell to a close just under its 50 DMA line with today's fourth consecutive loss.
| Oil Services |
$OSX |
198.61 |
-1.32 |
-0.66% |
+63.61% |
| Healthcare |
$HMO |
1,154.23 |
+40.90 |
+3.67% |
+20.21% |
| Integrated Oil |
$XOI |
1,094.61 |
+8.20 |
+0.75% |
+11.73% |
| Semiconductor |
$SOX |
309.44 |
-8.00 |
-2.52% |
+45.85% |
| Networking |
$NWX |
224.43 |
-3.11 |
-1.37% |
+55.97% |
| Internet |
$IIX |
218.43 |
-4.05 |
-1.82% |
+63.29% |
| Broker/Dealer |
$XBD |
115.31 |
-1.35 |
-1.16% |
+48.84% |
| Retail |
$RLX |
390.19 |
-6.27 |
-1.58% |
+39.72% |
| Gold & Silver |
$XAU |
163.23 |
-2.24 |
-1.35% |
+31.80% |
| Bank |
$BKX |
44.13 |
-0.45 |
-1.01% |
-0.43% |
| Biotech |
$BTK |
861.40 |
+0.77 |
+0.09% |
+33.10% |
|
|
|
 |
Profit Taking Pressures Mount As Distribution Troubles Market
Kenneth J. Gruneisen - Passed the CAN SLIM® Master's Exam
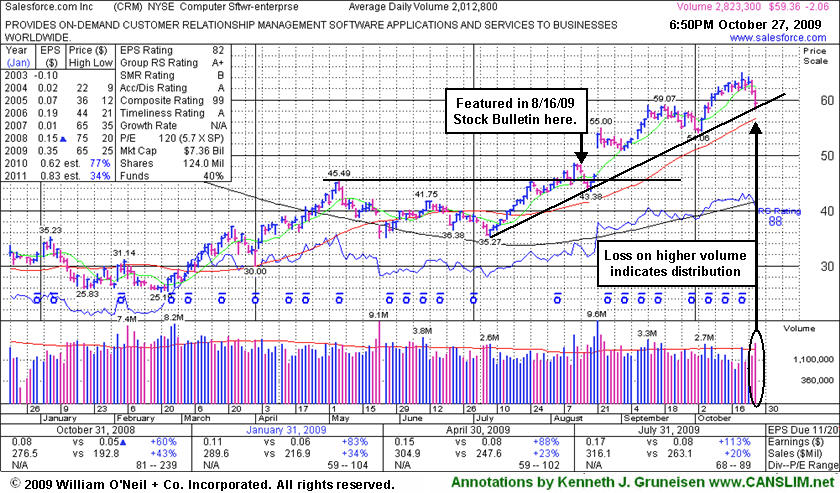
Salesforce.com, Inc. (CRM -$2.06 or -3.47% to $59.36) suffered a loss today with above average volume, raising some concerns. Prior chart highs in the $59 area coincide with an upward trendline connecting its July, August and October chart lows, helping define an important technical support level currently being tested. Its 50-day moving average (DMA) line is the next important support level to watch. The weak action in the stock coupled with the broader market deterioration (M criteria) suggests that it might be appropriate for investors to lock in profits under the investment system guidelines, especially if more worrisome losses lead to violations at the above mentioned levels.
CRM stubbornly held its ground and stayed well above its important short-term average since its "breakaway gap" for a considerable gain on 8/21/09 with more than 5 times average volume. The number of top-rated funds owning its shares rose from 269 in Sept '08 to 294 in Jun '09, which is reassuring news concerning the I criteria. Additional weakness may lead to more definitive technical sell signals, while it otherwise needs more time to possibly form a new sound base. Market action will largely dictate the outcome, since 3 out of 4 stocks typically follow the direction of the broader market averages.
|
|
|
Color Codes Explained :
Y - Better candidates highlighted by our
staff of experts.
G - Previously featured
in past reports as yellow but may no longer be buyable under the
guidelines.
***Last / Change / Volume quote data in this table corresponds with the timestamp on the note***
Symbol/Exchange
Company Name
Industry Group |
Last |
Chg. |
Vol
% DAV |
Date Featured |
Price Featured |
Latest Pivot Point
Featured |
Status |
| Latest Max Buy Price |
ARO
- NYSE
Aeropostale Inc
RETAIL - Apparel Stores
|
$40.29
|
-2.04
|
3,188,216
122% DAV
2,607,600
|
8/21/2009
(Date
Featured) |
$39.21
(Price
Featured) |
PP = $44.95 |
G |
| MB = $47.20 |
Most Recent Note - 10/27/2009 6:13:42 PM
G - Raised concerns with today's considerable loss on higher volume, indicative of distributional pressure, and violations of its 50 DMA line and recent chart lows triggered technical sell signals. Color code was changed to green based on the weak action. Additional analysis (in response to a member inquiry) was included in the "Ken's Mailbag" section of the 10/21/09 After-Market Update (read here). Two months earlier, ARO was featured in yellow in the 8/21/09 Mid-Day BreakOuts Report (read here).
>>> The latest Featured Stock Update with an annotated graph appeared on 10/22/2009. click here.
|
|
C
A
S
I |
News |
Chart |
SEC
View all notes Alert
me of new notes
Company
Profile
|
ARST
-
|
$24.76
|
-0.31
|
649,848
97% DAV
672,000
|
9/1/2009
(Date
Featured) |
$19.91
(Price
Featured) |
PP = $20.90 |
G |
| MB = $21.95 |
Most Recent Note - 10/27/2009 6:15:18 PM
G - Loss today on near average volume, still consolidating in a tight range above prior chart highs. It has been noted as "extended from its 9/04/09 'late stage' breakout." ARST was first featured in yellow at $19.91 in the 9/01/09 mid-day report with an annotated daily graph (read here).
>>> The latest Featured Stock Update with an annotated graph appeared on 10/21/2009. click here.
|
|
C
A
S
I |
News |
Chart |
SEC
View all notes Alert
me of new notes
Company
Profile
|
ASIA
-
|
$21.20
|
-0.59
|
1,268,528
159% DAV
795,400
|
10/14/2009
(Date
Featured) |
$23.05
(Price
Featured) |
PP = $22.19 |
G |
| MB = $23.30 |
Most Recent Note - 10/27/2009 6:17:32 PM
G - Down today on higher volume for a 6th consecutive loss, raising concerns while sinking further below its pivot point and negating its latest breakout. Color code was changed to green based on the weak action, and the next important support to watch is its 50 DMA line. It was highlighted in yellow in the 10/14/09 mid-day report (read here) as it gapped up for a new 52-week high with 5 times average volume, triggering a technical buy signal by blasting above its pivot point. First featured in the August 2009 CANSLIM.net News (read here).
>>> The latest Featured Stock Update with an annotated graph appeared on 10/14/2009. click here.
|
|
C
A
S
I |
News |
Chart |
SEC
View all notes Alert
me of new notes
Company
Profile
|
BIDU
- NASDAQ
Baidu Inc Ads
INTERNET - Internet Information Providers
|
$383.66
|
-49.31
|
10,747,553
569% DAV
1,889,400
|
9/8/2009
(Date
Featured) |
$351.80
(Price
Featured) |
PP = $368.59 |
G |
| MB = $387.02 |
Most Recent Note - 10/27/2009 6:26:03 PM
G - Considerable gap down today after its latest strong earnings report but lowered guidance on future revenues, triggering a technical sell signal. It violated its 50 DMA line yet rallied back to close just above it and finished near the session high. As recently noted, "Choppy action has not allowed it to form a sound base in recent weeks." BIDU traded up as much as +23% from its price when featured in yellow in the 9/08/09 Mid-Day BreakOuts Report (read here).
>>> The latest Featured Stock Update with an annotated graph appeared on 10/7/2009. click here.
|
|
C
A
S
I |
News |
Chart |
SEC
View all notes Alert
me of new notes
Company
Profile
|
CACC
- NASDAQ
Credit Acceptance Corp
FINANCIAL SERVICES - Credit Services
|
$35.00
|
-1.10
|
34,228
87% DAV
39,200
|
9/29/2009
(Date
Featured) |
$33.48
(Price
Featured) |
PP = $32.60 |
G |
| MB = $34.23 |
Most Recent Note - 10/27/2009 6:27:39 PM
G - Volume picked up to near average today as it pulled back from all-time highs. It is extended from prior chart highs and its 50 DMA line which now coincide in the $32 area, an important level to watch on pullbacks. The Finance - Consumer/Commercial Loans firm has maintained a great track record of annual and quarterly sales revenues and earnings increases. It was featured on 9/29/09 in yellow in the mid-day report (read here).
>>> The latest Featured Stock Update with an annotated graph appeared on 10/15/2009. click here.
|
|
C
A
S
I |
News |
Chart |
SEC
View all notes Alert
me of new notes
Company
Profile
|
CRM
- NYSE
Salesforce.com Inc
INTERNET - Internet Software & Services
|
$59.36
|
-2.06
|
2,830,805
141% DAV
2,008,900
|
8/16/2009
(Date
Featured) |
$47.12
(Price
Featured) |
PP = $45.59 |
G |
| MB = $47.87 |
Most Recent Note - 10/27/2009 6:28:58 PM
G - Considerable loss today with above average volume, raising some concern while falling sharply toward prior chart highs in the $59 area which coincide with an upward trendline connecting its July, August and October chart lows. The next important support level to watch is its 50 DMA line (now $56.56).
>>> The latest Featured Stock Update with an annotated graph appeared on 10/27/2009. click here.
|
|
C
A
S
I |
News |
Chart |
SEC
View all notes Alert
me of new notes
Company
Profile
|
EBIX
- NASDAQ
Ebix Inc
COMPUTER SOFTWARE & SERVICES - Business Software & Services
|
$62.50
|
-3.00
|
408,902
187% DAV
219,200
|
8/28/2009
(Date
Featured) |
$45.86
(Price
Featured) |
PP = $45.35 |
G |
| MB = $47.62 |
Most Recent Note - 10/27/2009 6:31:33 PM
G - Loss today came on higher volume, indicating distribution, following a negative reversal from all-time highs on the prior session. It is now very extended from any sound base, well above support at its 50 DMA line, and more than +80% above its 200 DMA line - all of which are reminders to be watchful for sell signals.
>>> The latest Featured Stock Update with an annotated graph appeared on 10/13/2009. click here.
|
|
C
A
S
I |
News |
Chart |
SEC
View all notes Alert
me of new notes
Company
Profile
|
GMCR
- NASDAQ
Green Mtn Coffee Roastrs
FOOD & BEVERAGE - Processed & Packaged Goods
|
$70.92
|
-2.86
|
1,329,321
108% DAV
1,228,200
|
10/5/2009
(Date
Featured) |
$71.11
(Price
Featured) |
PP = $75.89 |
G |
| MB = $79.68 |
Most Recent Note - 10/27/2009 6:33:39 PM
G - Considerable loss today on higher volume (near average), slumping further below its pivot point, raising concerns. Color code was changed to green based on weak action. It would need to rally back above its pivot point powerfully for its outlook to improve, meanwhile its 50 DMA line (now $66.91) is an important support level to watch.
>>> The latest Featured Stock Update with an annotated graph appeared on 10/12/2009. click here.
|
|
C
A
S
I |
News |
Chart |
SEC
View all notes Alert
me of new notes
Company
Profile
|
PEGA
- NASDAQ
Pegasystems Inc
COMPUTER SOFTWARE & SERVICES - Business Software & Services
|
$30.70
|
-2.33
|
712,862
222% DAV
321,300
|
9/9/2009
(Date
Featured) |
$31.14
(Price
Featured) |
PP = $33.35 |
G |
| MB = $35.02 |
Most Recent Note - 10/27/2009 6:34:29 PM
G - Considerable loss today on more than 2 times average volume, violating its 50 DMA line and its upward trendline, triggering technical sell signals. Color code was changed to green based on the weak action.
>>> The latest Featured Stock Update with an annotated graph appeared on 10/23/2009. click here.
|
|
C
A
S
I |
News |
Chart |
SEC
View all notes Alert
me of new notes
Company
Profile
|
SWI
- NYSE
Solarwinds Inc
COMPUTER SOFTWARE & SERVICES - Application Software
|
$19.26
|
-0.04
|
359,123
66% DAV
544,400
|
9/30/2029
(Date
Featured) |
$22.03
(Price
Featured) |
PP = $21.72 |
G |
| MB = $22.81 |
Most Recent Note - 10/27/2009 6:37:42 PM
G - Holding its ground in the $19-20 area for the past 4 sessions with volume generally cooling off, yet it has failed to rebound following gaps down on 10/20 & 10/21 for considerable losses with heavy volume. It violated its 50 DMA line and recent chart lows in the $20.50 area, triggering technical sell signals. It would need to promptly repair its 50 DMA violation for its outlook to improve. This high-ranked Computer Software - Enterprise firm was featured in the October 2009 issue of CANSLIM.net News (read here).
>>> The latest Featured Stock Update with an annotated graph appeared on 10/20/2009. click here.
|
|
C
A
S
I |
News |
Chart |
SEC
View all notes Alert
me of new notes
Company
Profile
|
WNS
- NYSE
W N S Holdings Ltd Ads
DIVERSIFIED SERVICES - Business/Management Services
|
$13.51
|
-0.65
|
339,475
N/A
|
9/28/2009
(Date
Featured) |
$15.28
(Price
Featured) |
PP = $16.10 |
|
| MB = $16.91 |
Most Recent Note - 10/27/2009
Considerable loss today with higher volume, however it found some support and rebounded to close in the upper third of its intra-day trading range. Based on weak action it will be dropped from the Featured Stocks list tonight. The prior session's loss with above average volume, violating its 50 DMA line and recent chart lows, triggered technical sell signals. As noted last week, "distributional pressure raised concerns and technically negated its 10/16/09 breakout." Featured in yellow in the 9/28/09 mid-day report (read here). Quarterly earnings have been above the +25% guideline and its annual earnings history has been great, satisfying the C & A criteria. However, sales revenues growth has decelerated.
>>> The latest Featured Stock Update with an annotated graph appeared on 10/26/2009. click here.
|
|
C
A
S
I |
News |
Chart |
SEC
View all notes Alert
me of new notes
Company
Profile
|
|
|
|
THESE ARE NOT BUY RECOMMENDATIONS!
Comments contained in the body of this report are technical
opinions only. The material herein has been obtained
from sources believed to be reliable and accurate, however,
its accuracy and completeness cannot be guaranteed.
This site is not an investment advisor, hence it does
not endorse or recommend any securities or other investments.
Any recommendation contained in this report may not
be suitable for all investors and it is not to be deemed
an offer or solicitation on our part with respect to
the purchase or sale of any securities. All trademarks,
service marks and trade names appearing in this report
are the property of their respective owners, and are
likewise used for identification purposes only.
This report is a service available
only to active Paid Premium Members.
You may opt-out of receiving report notifications
at any time. Questions or comments may be submitted
by writing to Premium Membership Services 665 S.E. 10 Street, Suite 201 Deerfield Beach, FL 33441-5634 or by calling 1-800-965-8307
or 954-785-1121.
|
|
|


