You are not logged in.
This means you
CAN ONLY VIEW reports that were published prior to Monday, April 14, 2025.
You
MUST UPGRADE YOUR MEMBERSHIP if you want to see any current reports.
AFTER MARKET UPDATE - WEDNESDAY, OCTOBER 21ST, 2009
Previous After Market Report Next After Market Report >>>
|
|
|
|
DOW |
-92.12 |
9,949.36 |
-0.92% |
|
Volume |
1,405,813,360 |
+14% |
|
Volume |
2,637,939,510 |
+22% |
|
NASDAQ |
-12.74 |
2,150.73 |
-0.59% |
|
Advancers |
995 |
32% |
|
Advancers |
895 |
31% |
|
S&P 500 |
-9.66 |
1,081.40 |
-0.89% |
|
Decliners |
2,034 |
65% |
|
Decliners |
1,826 |
64% |
|
Russell 2000 |
-8.30 |
605.11 |
-1.35% |
|
52 Wk Highs |
333 |
|
|
52 Wk Highs |
144 |
|
|
S&P 600 |
-4.35 |
319.97 |
-1.34% |
|
52 Wk Lows |
5 |
|
|
52 Wk Lows |
14 |
|
|
 |
Outside Reversal Day For Major Averages
Adam Sarhan, Contributing Writer,
The major averages negatively reversed (opened higher and closed lower) after the bears showed up and sent stocks tumbling in the afternoon. Volume was heavier than the prior session on the NYSE and on the Nasdaq exchange, which marked another distribution day for the popular averages. Decliners trumped advancers by about a 2-to-1 ratio on the NYSE and by over a 2-to-1 ratio on the Nasdaq exchange. There were 38 high-ranked companies from the CANSLIM.net Leaders List, making a new 52-week high and appearing on the CANSLIM.net BreakOuts Page, one lower than the 39 issues that appeared on the prior session. New 52-week highs substantially outnumbered new 52-week lows on both major exchanges.
The major averages turned lower in the final hour of trading after analyst Dick Bove downgraded Wells Fargo & Co. (WFC -5.12%). Stocks spent the majority of the session trading in positive territory after Morgan Stanley (MS +4.80%) and Yahoo Inc. (YHOO +2.85%) topped analysts estimates. Wells Fargo, the largest US home lender this year, negatively reversed after Bove of Rochdale Securities cut the shares to “sell” and said earnings were boosted by mortgage-servicing fees rather than improving business trends.
Timothy Geithner the current US Treasury Secretary said the bank capital-purchase program in last year's $700 billion bailout will be allowed to expire later this year because parts of the economy and the markets are stabilizing. Geithner told Reuters that “We are now at the point where we can begin to wind down the programs that really defined TARP in its initial stages,” referring to the Troubled Asset Relief Program. Elsewhere, the Federal Reserve released its Beige Book which surveyed its 12 districts. The report showed that the 12 regions believe that many sectors of the economy have stabilized or are modestly improving. The report also showed that all regions showed a waning real estate market.
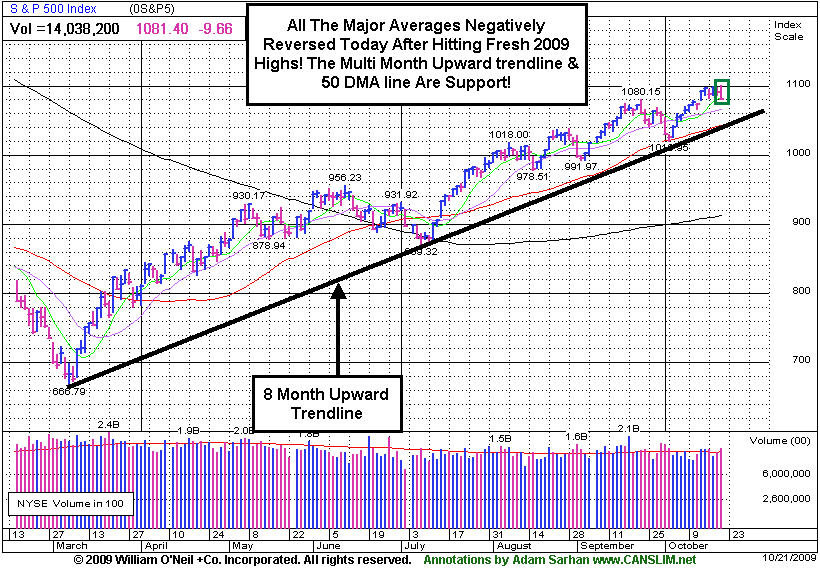
The Dow Jones Industrial Average, Nasdaq Composite, and S&P 500 indexes all suffered an "outside reversal" day which means today's range eclipsed yesterday's range. Chart readers view outside reversal days as very significant since historically they have often marked a meaningful change in trend. The fact that all of the major averages traded to fresh 2009 highs before turning lower on heavier volume than the prior session suggests a near term pullback may be in the cards. That said, adjust your stops and trade accordingly. The first level of support for the benchmark S&P 500 is 1,080, then its 8-month upward trendline and 50-day moving average (DMA) line. Barring some unforeseen event, this rally will remain intact until the 50 DMA line is breached. If the S&P 500 closes below 1,080 then this rally will be viewed by us as "under pressure."
PICTURED: The S&P 500 Index suffered a distribution day and negatively reversed after hitting a fresh 2009 high.
|
|
|
 |
Financial, Retail, Healthcare, and Tech Groups Fall
Kenneth J. Gruneisen - Passed the CAN SLIM® Master's Exam
The Broker/Dealer Index ($XBD -3.19%) and Bank Index ($BKX -2.39%) were among the influential areas leading the broader market's declines on Wednesday. The Retail Index ($RLX -1.94%) also fell, and the tech sector ended unanimously lower as the Networking Index ($NWX -2.04%), Semiconductor Index ($SOX -1.28%), Biotechnology Index ($BTK -1.08%), and Internet Index ($IIX -0.65%) lost ground. The Healthcare Index ($HMO -2.38%) also slumped to a considerable loss, meanwhile commodity-linked areas held their ground as the Oil Services Index ($OSX -0.03%), Integrated Oil Index ($XOI +0.06%), and Gold & Silver Index ($XAU +0.06%) ended virtually unchanged.
Charts courtesy www.stockcharts.com
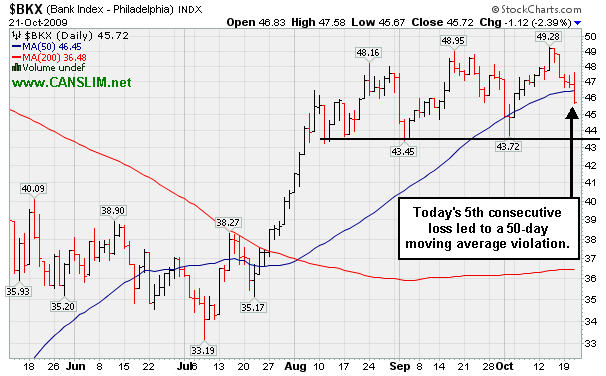
PICTURED: The Bank Index ($BKX -2.39%) violated its 50-day moving average (DMA) line with Wednesday's loss marking its 5th straight decline. Longtime CANSLIM.net members know the importance the financial group has as a leading indicator for the broader market. Note that in both September and October it failed to make any further upward progress after spiking to new 2009 highs, meanwhile it has established recent chart lows in the $43 area as the next important support level. Deterioration under those lows would raise concerns that the broader market rally is beginning to falter.
| Oil Services |
$OSX |
207.83 |
-0.07 |
-0.03% |
+71.21% |
| Healthcare |
$HMO |
1,130.12 |
-27.59 |
-2.38% |
+17.70% |
| Integrated Oil |
$XOI |
1,110.14 |
+0.65 |
+0.06% |
+13.32% |
| Semiconductor |
$SOX |
322.67 |
-4.20 |
-1.28% |
+52.08% |
| Networking |
$NWX |
235.77 |
-4.91 |
-2.04% |
+63.85% |
| Internet |
$IIX |
221.16 |
-1.45 |
-0.65% |
+65.33% |
| Broker/Dealer |
$XBD |
118.98 |
-3.92 |
-3.19% |
+53.58% |
| Retail |
$RLX |
383.28 |
-7.58 |
-1.94% |
+37.25% |
| Gold & Silver |
$XAU |
174.34 |
+0.11 |
+0.06% |
+40.77% |
| Bank |
$BKX |
45.72 |
-1.12 |
-2.39% |
+3.16% |
| Biotech |
$BTK |
893.84 |
-9.78 |
-1.08% |
+38.12% |
|
|
|
 |
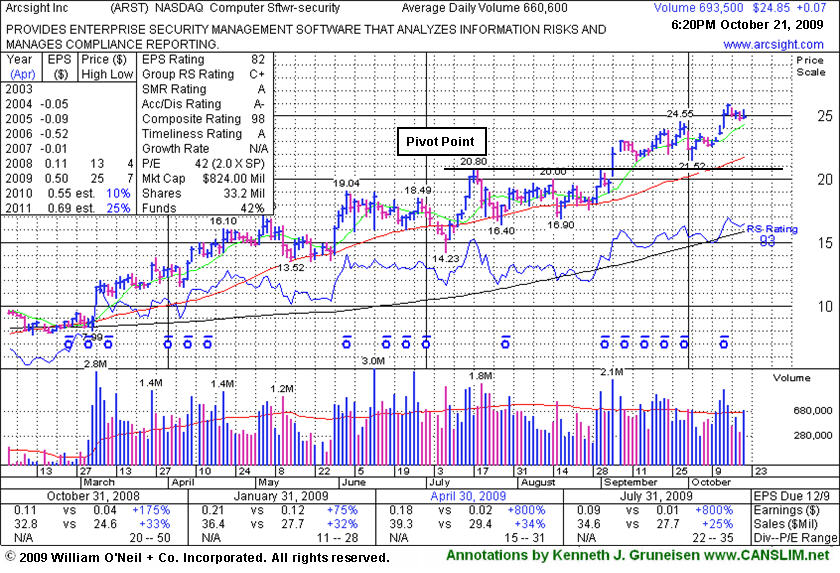
Extended From Base And Stubbornly Holding Its Ground
Kenneth J. Gruneisen - Passed the CAN SLIM® Master's Exam
ArcSight, Inc. (ARST +$0.07 or +0.28% to $24.85) has stubbornly held its ground near all-time highs since last week's gains on above average volume. It is now too extended from its prior base to be buyable under the guidelines of the investment system. It has encountered very little distributional pressure since its 9/04/09 breakout, and yet it offered disciplined investors opportunities to accumulate shares without chasing it more than 5% above its pivot point. It had done so when its positive reversal prompted its last appearance in this FSU section on 10/02/09 under the headline "Positive Reversal After Intra-Day Pullback Under Max Buy Level." Its 10/02/09 low ($21.52) closely coincides now with its 50-day moving average (DMA) line, making that a very important technical support level to watch on pullbacks.
Keep in mind that ARST was considered a "late-stage" breakout possibility when featured after it had already made a considerable 5-fold rally from its November '08 low. ARST was first featured in yellow at $19.91 in the 9/01/09 mid-day report with an annotated daily graph (read here) and it was also featured with more detailed analysis in the September 2009 CANSLIM.net News with an annotated weekly graph (read here).
|
|
|
Color Codes Explained :
Y - Better candidates highlighted by our
staff of experts.
G - Previously featured
in past reports as yellow but may no longer be buyable under the
guidelines.
***Last / Change / Volume quote data in this table corresponds with the timestamp on the note***
Symbol/Exchange
Company Name
Industry Group |
Last |
Chg. |
Vol
% DAV |
Date Featured |
Price Featured |
Latest Pivot Point
Featured |
Status |
| Latest Max Buy Price |
ARO
- NYSE
Aeropostale Inc
RETAIL - Apparel Stores
|
$41.04
|
-0.62
|
2,683,599
105% DAV
2,552,300
|
8/21/2009
(Date
Featured) |
$39.21
(Price
Featured) |
PP = $38.84 |
G |
| MB = $40.78 |
Most Recent Note - 10/21/2009 6:52:00 PM
G - Loss today on higher (but near average) volume indicated distributional pressure leading to a close 7 cents under its 50 DMA line, raising concerns. Additional analysis is included in the "Ken's Mailbag" section of tonight's report. Its color code is changed to green, and a more serious 50 DMA line violation could raise concerns and trigger a more definitive technical sell signal. The next key chart support level is prior highs in the $38 area. It was featured in yellow in the 8/21/09 Mid-Day BreakOuts Report (read here).
>>> The latest Featured Stock Update with an annotated graph appeared on 10/6/2009. click here.
|
|
C
A
S
I |
News |
Chart |
SEC
View all notes Alert
me of new notes
Company
Profile
|
ARST
-
|
$24.85
|
+0.07
|
696,010
105% DAV
660,600
|
9/1/2009
(Date
Featured) |
$19.91
(Price
Featured) |
PP = $20.90 |
G |
| MB = $21.95 |
Most Recent Note - 10/21/2009 6:53:51 PM
G - Consolidating in a tight range, but extended from its "late stage" breakout. ARST was first featured in yellow at $19.91 in the 9/01/09 mid-day report with an annotated daily graph (read here).
>>> The latest Featured Stock Update with an annotated graph appeared on 10/21/2009. click here.
|
|
C
A
S
I |
News |
Chart |
SEC
View all notes Alert
me of new notes
Company
Profile
|
ASIA
-
|
$22.98
|
-0.29
|
1,329,084
168% DAV
793,200
|
10/14/2009
(Date
Featured) |
$23.05
(Price
Featured) |
PP = $22.19 |
Y |
| MB = $23.30 |
Most Recent Note - 10/21/2009 6:55:16 PM
Y - Gapped up today but negatively reversed for a loss on higher volume. Its color code was changed to yellow again, and prior chart highs in the $21-22 area are important support to watch on pullbacks. A gap up and considerable breakout gain with 5 times average volume triggered a technical buy signal on 10/14/09. It was highlighted in yellow in the 10/14/09 mid-day report (read here) as it blasted to a new 52-week high above its long-ago noted pivot point when featured in the August 2009 CANSLIM.net News (read here).
>>> The latest Featured Stock Update with an annotated graph appeared on 10/14/2009. click here.
|
|
C
A
S
I |
News |
Chart |
SEC
View all notes Alert
me of new notes
Company
Profile
|
BIDU
- NASDAQ
Baidu Inc Ads
INTERNET - Internet Information Providers
|
$405.92
|
-2.80
|
1,373,282
75% DAV
1,837,100
|
9/8/2009
(Date
Featured) |
$351.80
(Price
Featured) |
PP = $368.59 |
G |
| MB = $387.02 |
Most Recent Note - 10/21/2009 6:55:49 PM
G - Still consolidating in the $400 area after recent gains challenged its 2007 all-time high of $429. It is extended from a proper buy point under the investment system guidelines. BIDU was featured in yellow in the 9/08/09 Mid-Day BreakOuts Report (read here).
>>> The latest Featured Stock Update with an annotated graph appeared on 10/7/2009. click here.
|
|
C
A
S
I |
News |
Chart |
SEC
View all notes Alert
me of new notes
Company
Profile
|
CACC
- NASDAQ
Credit Acceptance Corp
FINANCIAL SERVICES - Credit Services
|
$35.89
|
-0.33
|
18,544
44% DAV
41,900
|
9/29/2009
(Date
Featured) |
$33.48
(Price
Featured) |
PP = $32.60 |
G |
| MB = $34.23 |
Most Recent Note - 10/21/2009 6:56:53 PM
G - Loss on light volume while quietly and stubbornly holding its ground, extended from a sound base. Prior chart highs in the $32 area are important support to watch on pullbacks. The Finance - Consumer/Commercial Loans firm has maintained a great track record of annual and quarterly sales revenues and earnings increases. It was featured on 9/29/09 in yellow in the mid-day report (read here).
>>> The latest Featured Stock Update with an annotated graph appeared on 10/15/2009. click here.
|
|
C
A
S
I |
News |
Chart |
SEC
View all notes Alert
me of new notes
Company
Profile
|
CRM
- NYSE
Salesforce.com Inc
INTERNET - Internet Software & Services
|
$63.49
|
+1.34
|
2,200,072
106% DAV
2,068,600
|
8/16/2009
(Date
Featured) |
$47.12
(Price
Featured) |
PP = $45.59 |
G |
| MB = $47.87 |
Most Recent Note - 10/21/2009 6:58:23 PM
G - Posted another solid gain today for a new 2009 high, but it is extended from any sound base. Technical support to watch now is prior chart highs in the $59 area which coincide with an upward trendline connecting its July, August and October chart lows, both just above additional support at its 50 DMA line.
>>> The latest Featured Stock Update with an annotated graph appeared on 10/5/2009. click here.
|
|
C
A
S
I |
News |
Chart |
SEC
View all notes Alert
me of new notes
Company
Profile
|
EBIX
- NASDAQ
Ebix Inc
COMPUTER SOFTWARE & SERVICES - Business Software & Services
|
$62.94
|
-1.54
|
258,711
125% DAV
207,100
|
8/28/2009
(Date
Featured) |
$45.86
(Price
Featured) |
PP = $45.35 |
G |
| MB = $47.62 |
Most Recent Note - 10/21/2009 6:59:09 PM
G - Consolidating after recent volume-driven gains to new all-time highs. It is very extended from any sound base, well above support at its 50 DMA line, and more than +103% above its 200 DMA line - all of which are reminders to be watchful for sell signals.
>>> The latest Featured Stock Update with an annotated graph appeared on 10/13/2009. click here.
|
|
C
A
S
I |
News |
Chart |
SEC
View all notes Alert
me of new notes
Company
Profile
|
GMCR
- NASDAQ
Green Mtn Coffee Roastrs
FOOD & BEVERAGE - Processed & Packaged Goods
|
$74.91
|
-2.58
|
1,042,040
83% DAV
1,252,900
|
10/5/2009
(Date
Featured) |
$71.11
(Price
Featured) |
PP = $75.89 |
Y |
| MB = $79.68 |
Most Recent Note - 10/21/2009 7:00:55 PM
Y - Loss on lighter volume today as it sank below its recently cited pivot point, raising some concerns. On 10/19/09 it rallied above is pivot point with +57% above average volume, barely meeting the minimum guideline needed to trigger a proper technical buy signal. Keep in mind this may be considered a 3rd or 4th stage base, and thus more failure prone, meanwhile its earlier breakouts were backed by far more impressive volume.
>>> The latest Featured Stock Update with an annotated graph appeared on 10/12/2009. click here.
|
|
C
A
S
I |
News |
Chart |
SEC
View all notes Alert
me of new notes
Company
Profile
|
PEGA
- NASDAQ
Pegasystems Inc
COMPUTER SOFTWARE & SERVICES - Business Software & Services
|
$33.71
|
-0.59
|
193,576
60% DAV
323,700
|
9/9/2009
(Date
Featured) |
$31.14
(Price
Featured) |
PP = $33.35 |
Y |
| MB = $35.02 |
Most Recent Note - 10/21/2009 7:02:10 PM
Y - Loss on light volume while consolidating near its all-time high. This high-ranked Computer Software - Financial firm found support near its 50 DMA line on recent pullbacks. Now that short-term average and its upward trendline are important technical support levels to watch.
>>> The latest Featured Stock Update with an annotated graph appeared on 10/8/2009. click here.
|
|
C
A
S
I |
News |
Chart |
SEC
View all notes Alert
me of new notes
Company
Profile
|
SWI
- NYSE
Solarwinds Inc
COMPUTER SOFTWARE & SERVICES - Application Software
|
$19.51
|
-1.19
|
1,685,584
325% DAV
518,000
|
9/30/2029
(Date
Featured) |
$22.03
(Price
Featured) |
PP = $21.72 |
G |
| MB = $22.81 |
Most Recent Note - 10/21/2009 7:03:06 PM
G - Gapped down for a second day in a row today and violated recent chart lows in the $20.50 area, raising more serious concerns and triggering a more definitive technical sell signal. Color code was changed to green based on the technical weakness, and it would need to promptly repair its 50 DMA violation for its outlook to improve. After reporting earnings on 10/20/09 it gapped down and violated its 50 DMA line with a considerable loss on nearly 4 times average volume. This high-ranked Computer Software - Enterprise firm was featured in the October 2009 issue of CANSLIM.net News (read here).
>>> The latest Featured Stock Update with an annotated graph appeared on 10/20/2009. click here.
|
|
C
A
S
I |
News |
Chart |
SEC
View all notes Alert
me of new notes
Company
Profile
|
WNS
- NYSE
W N S Holdings Ltd Ads
DIVERSIFIED SERVICES - Business/Management Services
|
$16.08
|
-0.77
|
80,248
140% DAV
57,300
|
9/28/2009
(Date
Featured) |
$15.28
(Price
Featured) |
PP = $16.10 |
G |
| MB = $16.91 |
Most Recent Note - 10/21/2009 7:04:53 PM
G - Loss today on slightly higher volume indicated distributional pressure and raised concerns because it sank to a close below its pivot point. Its color code was changed to green after its recent streak of gains with above average triggered a technical buy signal while clearing stubborn $16 resistance. Recently found support at its 50 DMA line. Featured in yellow in the 9/28/09 mid-day report (read here). Quarterly earnings have been above the +25% guideline and its annual earnings history has been great, satisfying the C & A criteria. However, sales revenues growth has decelerated.
>>> The latest Featured Stock Update with an annotated graph appeared on 10/16/2009. click here.
|
|
C
A
S
I |
News |
Chart |
SEC
View all notes Alert
me of new notes
Company
Profile
|
|
 |
| Subscriber Questions: |
October 20, 2009 |
Ken,
I was wondering if you would be so kind as to give me a clarification of your remark regarding Aeropostale Inc. (ARO) "permissible under the guidelines to accumulate shares from the first successful test of support at its short-term average line up to as much as 5% above its latest chart highs". I looked at the chart, is the first test of support on August 17th at $34. and the latest chart high on Sept. 22 at $44.85?
I love the CANSLIM.net service and it has made me a wealthier person, thank you for your time.
Donald |
| Ken's Response: |
October 21, 2009 |
Donald,
Thanks for the positive feedback. I appreciate the opportunity to clarify.
We are talking about its post-breakout action, not anything earlier. Since ARO’s bullish breakout on 8/21/09 triggered a buy signal, this (everything 10/09/09 to present) may be considered its “first” test of support at the 50-day moving average (DMA) line in my view. However, one could also consider its 10/09/09 action the “first” test of the 50 DMA, while it closed near that session’s high, it suggests that support arrived to prop up the stock. A “positive reversal” would have been a more convincing indication of a change in direction (back up) to potentially challenge or exceed the highs. Subsequent 50 DMA tests are considered in general to be more failure prone, so buying is mostly encouraged on the “first” test after a sound breakout. So, if it survives its current test of the 50 DMA line and comes back to confront its 50 DMA again in November or December, new buying efforts would not be permitted under the same premise –as it would not be its first test following a sound breakout. Of course, if it formed a new sound base of sufficient length, then a fresh breakout would be buyable too! In the CANSLIM Certification they teach that if you missed a stock that breaks out, you can get a “2nd chance” to buy it anywhere from when it bounces off its 50 DMA (or 10-week average) all the way up to the recent highs plus 5%. That would be its 9/22/09 high plus 5%. Of course, ARO has already almost based long enough to be considered a new flat base on top of its prior base.
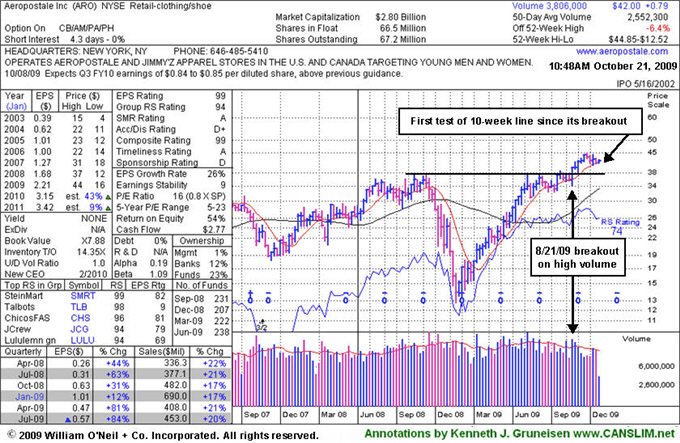
We do not have any ability to predict, but we know that in the past ARO has endured some heavy distribution and briefly traded under its 50 DMA line (See June 23rd through July 9th, and August 17) only to rally back with quiet volume (mid-July), or very heavy volume (see 8/21) indicative of great buying demand. If it does undercut its 50 DMA line, it is likely that such weakness would be directly linked to the overall market (the M criteria) direction. Take a look at its weekly chart (shown above) to get a better feel for the significance of its multi-year highs in the $37-38 area, knowing that deterioration which negates that long-term breakout (marked by the high volume up week ending 8/21/09) would raise more serious concerns.
Sincerely,

Kenneth J. Gruneisen
Founder & Contributing Writer for CANSLIM.net
www.canslim.net |
|
|
|
THESE ARE NOT BUY RECOMMENDATIONS!
Comments contained in the body of this report are technical
opinions only. The material herein has been obtained
from sources believed to be reliable and accurate, however,
its accuracy and completeness cannot be guaranteed.
This site is not an investment advisor, hence it does
not endorse or recommend any securities or other investments.
Any recommendation contained in this report may not
be suitable for all investors and it is not to be deemed
an offer or solicitation on our part with respect to
the purchase or sale of any securities. All trademarks,
service marks and trade names appearing in this report
are the property of their respective owners, and are
likewise used for identification purposes only.
This report is a service available
only to active Paid Premium Members.
You may opt-out of receiving report notifications
at any time. Questions or comments may be submitted
by writing to Premium Membership Services 665 S.E. 10 Street, Suite 201 Deerfield Beach, FL 33441-5634 or by calling 1-800-965-8307
or 954-785-1121.
|
|
|


