You are not logged in.
This means you
CAN ONLY VIEW reports that were published prior to Tuesday, April 1, 2025.
You
MUST UPGRADE YOUR MEMBERSHIP if you want to see any current reports.
AFTER MARKET UPDATE - WEDNESDAY, OCTOBER 26TH, 2011
Previous After Market Report Next After Market Report >>>
|
|
|
|
DOW |
+162.42 |
11,869.04 |
+1.39% |
|
Volume |
1,108,988,700 |
+10% |
|
Volume |
2,055,539,300 |
+19% |
|
NASDAQ |
+12.25 |
2,650.67 |
+0.46% |
|
Advancers |
2,427 |
78% |
|
Advancers |
1,854 |
70% |
|
S&P 500 |
+12.95 |
1,242.00 |
+1.05% |
|
Decliners |
595 |
19% |
|
Decliners |
711 |
27% |
|
Russell 2000 |
+13.50 |
727.15 |
+1.89% |
|
52 Wk Highs |
51 |
|
|
52 Wk Highs |
35 |
|
|
S&P 600 |
+7.07 |
400.66 |
+1.80% |
|
52 Wk Lows |
17 |
|
|
52 Wk Lows |
36 |
|
|
 |
Volume Increase Behind Gains Hints at Institutional Buying Increase
Kenneth J. Gruneisen - Passed the CAN SLIM® Master's Exam
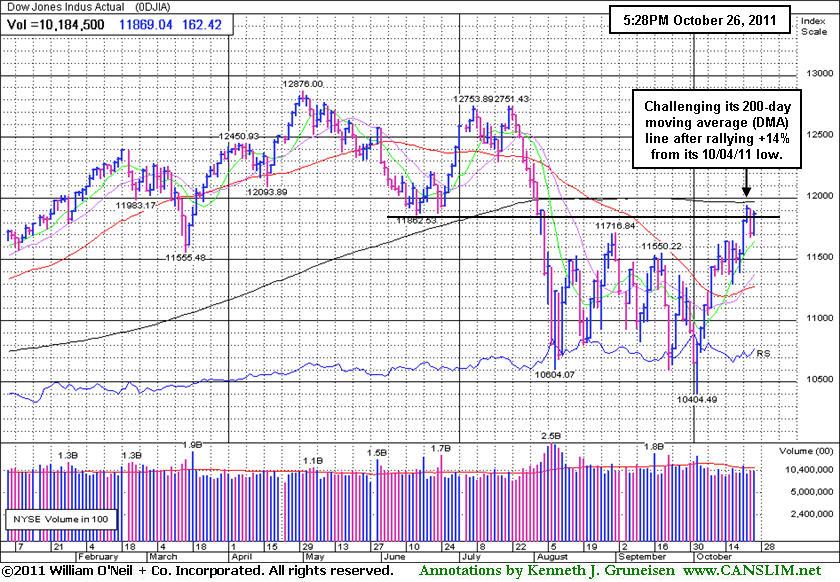
The major averages ended unanimously higher on Wednesday while encouraging earnings and economic reports added to the positive bias. The trading volume totals reported on the NYSE and on the Nasdaq exchange were higher than the prior session, and encouraging sign of better buying demand coming from the institutional crowd. Breadth was positive as advancers led declining issues by more than 4-1 on the NYSE and 5-2 on the Nasdaq exchange. New 52-week highs outnumbered new 52-week lows on the NYSE while they were evenly matched again on the Nasdaq exchange. There were 26 high-ranked companies from the CANSLIM.net Leaders List that made new 52-week highs and appeared on the CANSLIM.net BreakOuts Page, up from the prior session total of 16 stocks. There were gains for 7 of the 11 high-ranked companies currently included on the Featured Stocks Page, a list that has recently included a few new names.
The widely anticipated summit of European leaders commenced. Stocks initially sold off after a report of a possible delay of the region's bailout fund until November. Investors remained patient that the region's leaders will come up with a plan to shore up the region's banks, restructure Greece's debt and find ways to leverage the 440 billion euro rescue fund. The major averages staged a comeback on news European leaders agreed on a plan to recapitalize banks. A report that China may invest in the region's bailout also gave the market a lift.
Economic releases were encouraging. Durable goods orders, excluding transportation, rose 1.7% in September, beating forecasts for a 0.4% increase. Another report showed lower prices of newly constructed homes prompted a +5.7% increase in sales during September. Treasuries declined as investors' risk appetite returned. The 10-year Treasury note fell 27/32 to yield 2.21%. An unexpected rise in weekly inventories sent crude oil down -2.5% to $90.81 a barrel.
The Dow's advance was led by the aircraft maker Boeing Co (BA +4.46%) after earnings beat analyst projections. F5 Networks Inc (FFIV +14.08%) and Express Scripts Inc (ESRX +13.49%) both rallied on positive profit results. Despite posting its 10th consecutive quarterly profit, Ford Motor Company (F -4.51%) fell after management said margins may fall this year. An earnings shortfall sent shares of Internet retailer Amazon.com Inc (AMZN -12.66%) tumbling. Bemis Company Inc (BMS -11.0%) also sank after the package maker lowered its fourth-quarter forecast.
The October 2011 issue of our monthly newsletter CANSLIM.net News will be published soon with an informative review of current market conditions, leading groups, and best buy candidates. Via the Premium Member Homepage links to all prior reports and webcasts are always available.
PICTURED: The Dow Jones Industrial Average has been challenging its 200-day moving average (DMA) line after rallying +14% from its October 4, 2011 low.
|
 Kenneth J. Gruneisen started out as a licensed stockbroker in August 1987, a couple of months prior to the historic stock market crash that took the Dow Jones Industrial Average down -22.6% in a single day. He has published daily fact-based fundamental and technical analysis on high-ranked stocks online for two decades. Through FACTBASEDINVESTING.COM, Kenneth provides educational articles, news, market commentary, and other information regarding proven investment systems that work in good times and bad.
Comments contained in the body of this report are technical opinions only and are not necessarily those of Gruneisen Growth Corp. The material herein has been obtained from sources believed to be reliable and accurate, however, its accuracy and completeness cannot be guaranteed. Our firm, employees, and customers may effect transactions, including transactions contrary to any recommendation herein, or have positions in the securities mentioned herein or options with respect thereto. Any recommendation contained in this report may not be suitable for all investors and it is not to be deemed an offer or solicitation on our part with respect to the purchase or sale of any securities. |
|
 |
Retail Group Lagged Amid Mostly Positive Group Action
Kenneth J. Gruneisen - Passed the CAN SLIM® Master's Exam
The Retail Index ($RLX -2.27%) had a negative bias and the tech sector was mixed as the Biotechnology Index ($BTK -0.68%) and Internet Index ($IIX -0.18%) edged lower and the Semiconductor Index ($SOX +0.54%) and Networking Index ($NWX +0.91%) posted gains. The Broker/Dealer Index ($XBD +1.59%) and Bank Index ($BKX +2.06%) tallied influential gains while participating in the late-afternoon rally. Energy-related groups were on the rise including the Oil Services Index ($OSX +2.33%) and the Integrated Oil Index ($XOI +2.47%). The defensive groups including the Gold & Silver Index ($XAU +1.06%) and Healthcare Index ($HMO +2.34%) also posted gains.
Charts courtesy www.stockcharts.com
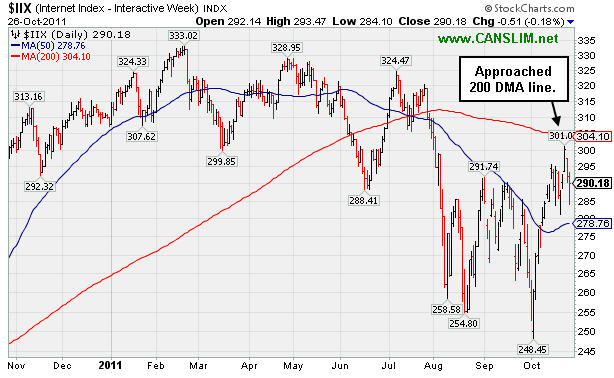
PICTURED: The Internet Index ($IIX -0.18%) pulled back for a second consecutive session after recently approaching its 200-day moving average line that is a near term technical hurdle.
| Oil Services |
$OSX |
227.65 |
+5.19 |
+2.33% |
-7.13% |
| Healthcare |
$HMO |
2,140.62 |
+48.93 |
+2.34% |
+26.51% |
| Integrated Oil |
$XOI |
1,222.10 |
+29.43 |
+2.47% |
+0.74% |
| Semiconductor |
$SOX |
379.48 |
+2.02 |
+0.54% |
-7.85% |
| Networking |
$NWX |
231.93 |
+2.09 |
+0.91% |
-17.33% |
| Internet |
$IIX |
290.18 |
-0.51 |
-0.18% |
-5.70% |
| Broker/Dealer |
$XBD |
88.09 |
+1.38 |
+1.59% |
-27.50% |
| Retail |
$RLX |
527.10 |
-12.27 |
-2.27% |
+3.68% |
| Gold & Silver |
$XAU |
197.66 |
+2.07 |
+1.06% |
-12.76% |
| Bank |
$BKX |
39.58 |
+0.80 |
+2.06% |
-24.19% |
| Biotech |
$BTK |
1,153.00 |
-7.85 |
-0.68% |
-11.15% |
|
|
|
 |
Secondary Offering Priced While High-Ranked Leader Near High
Kenneth J. Gruneisen - Passed the CAN SLIM® Master's Exam
Often, when a leading stock is setting up to breakout of a solid base it is highlighted in CANSLIM.net's Mid-Day Breakouts Report. The most relevant factors are noted in the report which allows prudent CANSLIM oriented investors to place the issue in their watch list. After doing any necessary backup research, the investor is prepared to act if and when the stock triggers a technical buy signal (breaks above its pivot point on more than +50% average turnover). In the event the stock fails to trigger a technical buy signal and its price declines then it will simply be removed from the watch list. In other cases, stocks may be featured in CANSLIM.net's Mid-Day Breakouts Report.after recent action already triggered technical buy signal. Disciplined investors know to buy as near as possible to the pivot point and avoid chasing stocks after they have rallied more than +5% above their pivot point. It is crucial to always limit losses whenever any stock heads the wrong direction, and disciplined investors sell if a struggling stock ever falls more than -7% from their purchase price.
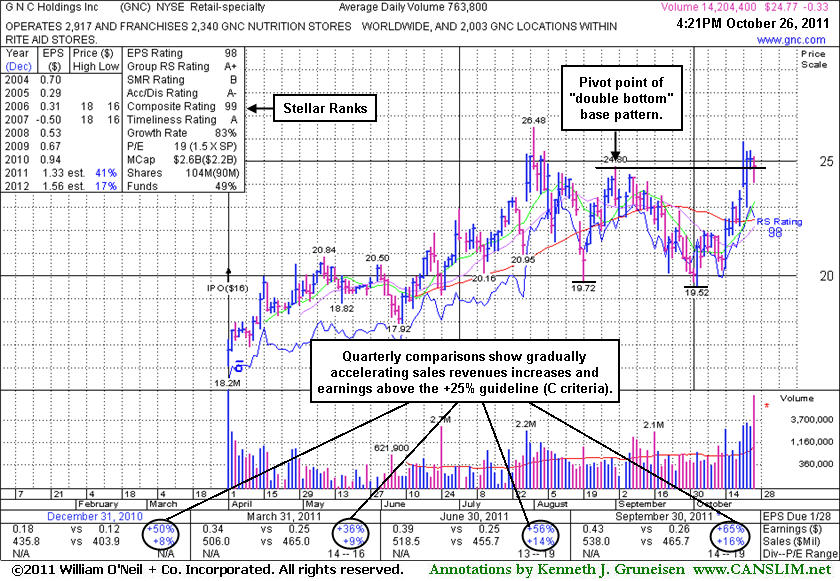
G N C Holdings Inc (GNC -$0.35 or -1.39% to $24.75) is perched near its 52-week high within striking distance of new highs (N criteria), holding its ground after volume-driven gains helped it rally from a "double bottom" base pattern formed over the prior 3 months. Its color code was changed to yellow with pivot point based on its 9/01/11 high. The 10/24/11 gain with more than 4 times average volume triggered a technical buy signal. Almost no resistance remains due to overhead supply. Its strong quarterly earnings increases with accelerating sales growth and a great annual earnings history satisfies the C and A criteria and has earned it stellar ranks. Following the close on 10/25/11 it priced a Secondary Offering. The nutrition store will receive no funds from the share sale by existing holders. However, new institutional owners are often attracted when a company has the help of underwriters in placing shares during such an offering. The number of top-rated funds owning its shares rose from 147 in June to 169 in September '11, a reassuring sign concerning the I criteria. The Retail - Specialty industry group has a Relative Strength Rating of 97, which is good news concerning the L criteria.
|
|
|
Color Codes Explained :
Y - Better candidates highlighted by our
staff of experts.
G - Previously featured
in past reports as yellow but may no longer be buyable under the
guidelines.
***Last / Change / Volume data in this table is the closing quote data***
Symbol/Exchange
Company Name
Industry Group |
PRICE |
CHANGE
(%Change) |
Day High |
Volume
(% DAV)
(% 50 day avg vol) |
52 Wk Hi
% From Hi |
Featured
Date |
Price
Featured |
Pivot Featured |
|
Max Buy |
AAPL
-
NASDAQ
Apple Inc
COMPUTER HARDWARE - Personal Computers
|
$400.60
|
+2.83
0.71% |
$402.55
|
16,275,826
74.22% of 50 DAV
50 DAV is 21,930,400
|
$426.70
-6.12%
|
9/16/2011
|
$399.14
|
PP = $404.60
|
|
MB = $424.83
|
Most Recent Note - 10/25/2011 6:42:53 PM
G - Quietly consolidating above its 50 DMA line with volume totals cooling following distributional losses last week. It has not formed a sound base pattern and ownership by top-rated funds has fallen some.
>>> The latest Featured Stock Update with an annotated graph appeared on 10/20/2011. Click here.
View all notes |
Alert me of new notes |
CANSLIM.net Company Profile |
SEC |
Zacks Reports |
StockTalk |
News |
Chart |
Request a new note
C
A N
S L
I M


|
ADS
-
NYSE
Alliance Data Sys Corp
COMPUTER SOFTWARE and SERVICES - Information and Delivery Service
|
$100.86
|
+1.89
1.91% |
$101.45
|
1,080,660
113.62% of 50 DAV
50 DAV is 951,100
|
$102.46
-1.56%
|
10/21/2011
|
$97.94
|
PP = $101.15
|
|
MB = $106.21
|
Most Recent Note - 10/25/2011 6:46:09 PM
Y - Small loss today on lighter volume after 3 consecutive gains with above average volume helped it rally to touch a new all-time high. Subsequent volume-driven gains above its pivot point may confirm a more convincing technical buy signal. Its 50 DMA line and recent chart lows define near-term support to watch on pullbacks.
>>> The latest Featured Stock Update with an annotated graph appeared on 10/21/2011. Click here.
View all notes |
Alert me of new notes |
CANSLIM.net Company Profile |
SEC |
Zacks Reports |
StockTalk |
News |
Chart |
Request a new note
C
A N
S L
I M
|
ALXN
-
NASDAQ
Alexion Pharmaceuticals
DRUGS - Drug Manufacturers - Other
|
$66.85
|
-0.06
-0.09% |
$67.60
|
1,191,972
76.43% of 50 DAV
50 DAV is 1,559,600
|
$70.42
-5.07%
|
9/15/2011
|
$63.20
|
PP = $60.81
|
|
MB = $63.85
|
Most Recent Note - 10/25/2011 6:49:40 PM
G - Loss today on light volume followed 3 consecutive gains with better but mostly average volume conviction. Support to watch includes prior resistance in the $59-60 area and its upwardly tilted 50 DMA line.
>>> The latest Featured Stock Update with an annotated graph appeared on 10/18/2011. Click here.
View all notes |
Alert me of new notes |
CANSLIM.net Company Profile |
SEC |
Zacks Reports |
StockTalk |
News |
Chart |
Request a new note
C
A N
S L
I M
|
CELG
-
NASDAQ
Celgene Corp
DRUGS - Drug Manufacturers - Major
|
$66.47
|
+0.58
0.88% |
$67.00
|
4,106,640
108.50% of 50 DAV
50 DAV is 3,784,800
|
$68.25
-2.61%
|
9/16/2011
|
$61.21
|
PP = $62.59
|
|
MB = $65.72
|
Most Recent Note - 10/25/2011 6:52:01 PM
G - It remains extended from its prior base after a loss today on average volume led to a pullback near its "max buy" level.
>>> The latest Featured Stock Update with an annotated graph appeared on 10/14/2011. Click here.
View all notes |
Alert me of new notes |
CANSLIM.net Company Profile |
SEC |
Zacks Reports |
StockTalk |
News |
Chart |
Request a new note
C
A N
S L
I M
|
GNC
-
NYSE
G N C Holdings Inc
RETAIL - Drug Stores
|
$24.75
|
-0.35
-1.39% |
$25.22
|
14,375,476
1,882.10% of 50 DAV
50 DAV is 763,800
|
$26.48
-6.53%
|
10/26/2011
|
$24.60
|
PP = $24.80
|
|
MB = $26.04
|
 Most Recent Note - 10/26/2011 1:09:27 PM
Y - Perched near its 52-week high after volume-driven gains helped it rally from a "double bottom" base pattern. Following the close of the prior session it priced a Secondary Offering. Color code is changed to yellow with pivot point based on its 9/01/11 high. The 10/24/11 gain with more than 4 times average volume triggered a technical buy signal. No resistance remains due to overhead supply. Strong quarterly and annual earnings history satisfies the C and A criteria.
>>> The latest Featured Stock Update with an annotated graph appeared on 10/26/2011. Click here.
View all notes |
Alert me of new notes |
CANSLIM.net Company Profile |
SEC |
Zacks Reports |
StockTalk |
News |
Chart |
Request a new note
C
A N
S L
I M
|
Symbol/Exchange
Company Name
Industry Group |
PRICE |
CHANGE
(%Change) |
Day High |
Volume
(% DAV)
(% 50 day avg vol) |
52 Wk Hi
% From Hi |
Featured
Date |
Price
Featured |
Pivot Featured |
|
Max Buy |
ISRG
-
NASDAQ
Intuitive Surgical Inc
HEALTH SERVICES - Medical Appliances and Equipment
|
$420.54
|
+1.17
0.28% |
$427.86
|
270,100
59.36% of 50 DAV
50 DAV is 455,000
|
$429.44
-2.07%
|
10/19/2011
|
$424.69
|
PP = $415.29
|
|
MB = $436.05
|
Most Recent Note - 10/25/2011 6:53:31 PM
Y - Pulled back today on light volume, yet it remains above its pivot point. Holding its ground since its 10/19/11 gap up gain on heavy volume triggered a technical buy signal. Prior highs define important support to watch on pullbacks.
>>> The latest Featured Stock Update with an annotated graph appeared on 10/19/2011. Click here.
View all notes |
Alert me of new notes |
CANSLIM.net Company Profile |
SEC |
Zacks Reports |
StockTalk |
News |
Chart |
Request a new note
C
A N
S L
I M
|
LABL
-
NASDAQ
Multi Color Corp
CONSUMER NON-DURABLES - Packaging and Containers
|
$27.19
|
+0.97
3.70% |
$27.35
|
28,802
52.56% of 50 DAV
50 DAV is 54,800
|
$28.00
-2.89%
|
10/17/2011
|
$27.81
|
PP = $28.10
|
|
MB = $29.51
|
Most Recent Note - 10/26/2011 5:43:10 PM
Y - Up today with light volume, finishing perched only -2.9% off its 52-week high. Very little overhead supply remains to act as resistance. Subsequent volume-driven gains into new high ground may trigger a technical buy signal. Last week's low near its 50 DMA line defines near-term support to watch where any violation would raise concerns.
>>> The latest Featured Stock Update with an annotated graph appeared on 10/17/2011. Click here.
View all notes |
Alert me of new notes |
CANSLIM.net Company Profile |
SEC |
Zacks Reports |
StockTalk |
News |
Chart |
Request a new note
C
A N
S L
I M
|
MG
-
NYSE
Mistras Group Inc
DIVERSIFIED SERVICES - Bulding and Faci;ity Management Services
|
$21.71
|
-0.58
-2.60% |
$22.47
|
253,953
115.91% of 50 DAV
50 DAV is 219,100
|
$23.51
-7.66%
|
8/10/2011
|
$17.89
|
PP = $17.58
|
|
MB = $18.46
|
Most Recent Note - 10/26/2011 12:06:30 PM
G - Down today after an analyst downgrade. Still consolidating above prior highs in the $20-21 area that define initial chart support to watch above its 50 DMA line.
>>> The latest Featured Stock Update with an annotated graph appeared on 10/12/2011. Click here.
View all notes |
Alert me of new notes |
CANSLIM.net Company Profile |
SEC |
Zacks Reports |
StockTalk |
News |
Chart |
Request a new note
C
A N
S L
I M
|
OPNT
-
NASDAQ
Opnet Technologies
INTERNET - Internet Software and Services
|
$41.98
|
-0.17
-0.40% |
$42.75
|
285,814
160.12% of 50 DAV
50 DAV is 178,500
|
$45.92
-8.58%
|
10/11/2011
|
$38.45
|
PP = $42.02
|
|
MB = $44.12
|
Most Recent Note - 10/26/2011 1:30:01 PM
Y - Inching lower today but slumping under its pivot point, raising some concerns. Color code was changed to yellow again on the pullback following its powerful technical breakout. More damaging losses with higher volume may raise greater concerns, meanwhile, prior highs in the $41 area define near-term chart support to watch. Due to report earnings on Wednesday, November 9th.
>>> The latest Featured Stock Update with an annotated graph appeared on 10/25/2011. Click here.
View all notes |
Alert me of new notes |
CANSLIM.net Company Profile |
SEC |
Zacks Reports |
StockTalk |
News |
Chart |
Request a new note
C
A N
S L
I M
|
UA
-
NYSE
Under Armour Inc Cl A
CONSUMER NON-DURABLES - Textile - Apparel Clothing
|
$82.89
|
+2.74
3.42% |
$83.69
|
2,877,469
198.80% of 50 DAV
50 DAV is 1,447,400
|
$83.47
-0.69%
|
10/25/2011
|
$82.43
|
PP = $80.80
|
|
MB = $84.84
|
Most Recent Note - 10/26/2011 5:47:54 PM
Y - Today's 5th consecutive gain, the 3rd straight gain with above average volume, helped it hit new 52-week and all-time highs. The rally and strong close above the new pivot point cited triggered a technical buy signal. Reported earnings +29% on +42% sales revenues for the quarter ended September 30, 2011 versus the year ago period. The new pivot point cited was based upon its 9/16/11 high after rallying clear of all overhead supply following a reverse-head-and-shoulders base pattern formed over the past 6 months. It had slumped below its 200 DMA during its deep consolidation after it was dropped from the Featured Stocks list on 8/02/11.

>>> The latest Featured Stock Update with an annotated graph appeared on 7/26/2011. Click here.
View all notes |
Alert me of new notes |
CANSLIM.net Company Profile |
SEC |
Zacks Reports |
StockTalk |
News |
Chart |
Request a new note
C
A N
S L
I M
|
Symbol/Exchange
Company Name
Industry Group |
PRICE |
CHANGE
(%Change) |
Day High |
Volume
(% DAV)
(% 50 day avg vol) |
52 Wk Hi
% From Hi |
Featured
Date |
Price
Featured |
Pivot Featured |
|
Max Buy |
V
-
NYSE
Visa Inc Cl A
DIVERSIFIED SERVICES - Business/Management Services
|
$92.02
|
+1.34
1.48% |
$92.73
|
6,665,820
124.74% of 50 DAV
50 DAV is 5,343,800
|
$94.75
-2.88%
|
10/24/2011
|
$94.21
|
PP = $94.85
|
|
MB = $99.59
|
Most Recent Note - 10/26/2011 5:53:49 PM
Y - Rebounded from an early loss today for a positive reversal and gain with above average volume. Reported results for the quarter ended September 30, 2011 after the close and earnings reportedly beat expectations while it missed on revenues. See the latest FSU analysis for more details and a new annotated weekly graph illustrating the latest base.
>>> The latest Featured Stock Update with an annotated graph appeared on 10/24/2011. Click here.
View all notes |
Alert me of new notes |
CANSLIM.net Company Profile |
SEC |
Zacks Reports |
StockTalk |
News |
Chart |
Request a new note
C
A N
S L
I M
|
|
|
|
THESE ARE NOT BUY RECOMMENDATIONS!
Comments contained in the body of this report are technical
opinions only. The material herein has been obtained
from sources believed to be reliable and accurate, however,
its accuracy and completeness cannot be guaranteed.
This site is not an investment advisor, hence it does
not endorse or recommend any securities or other investments.
Any recommendation contained in this report may not
be suitable for all investors and it is not to be deemed
an offer or solicitation on our part with respect to
the purchase or sale of any securities. All trademarks,
service marks and trade names appearing in this report
are the property of their respective owners, and are
likewise used for identification purposes only.
This report is a service available
only to active Paid Premium Members.
You may opt-out of receiving report notifications
at any time. Questions or comments may be submitted
by writing to Premium Membership Services 665 S.E. 10 Street, Suite 201 Deerfield Beach, FL 33441-5634 or by calling 1-800-965-8307
or 954-785-1121.
|
|
|

