***Last / Change / Volume data in this table is the closing quote data***
Symbol/Exchange
Company Name
Industry Group |
PRICE |
CHANGE
(%Change) |
Day High |
Volume
(% DAV)
(% 50 day avg vol) |
52 Wk Hi
% From Hi |
Featured
Date |
Price
Featured |
Pivot Featured |
|
Max Buy |
ABV
-
NYSE
Comp De Bebidas Adr
FOOD and BEVERAGE - Beverages - Brewers
|
$136.84
|
-6.01
-4.21% |
$141.86
|
1,041,119
158.73% of 50 DAV
50 DAV is 655,900
|
$143.53
-4.66%
|
6/29/2010
|
$104.74
|
PP = $109.33
|
|
MB = $114.80
|
 Most Recent Note - 10/26/2010 5:22:39 PM
G - Gapped down today for a loss with above average volume. After a streak of winning sessions marked by above average volume it is very extended from a sound base. Its 50 DMA line ($121.38 now) defines support.
>>> The latest Featured Stock Update with an annotated graph appeared on 10/11/2010. Click here.
View all notes |
Alert me of new notes |
CANSLIM.net Company Profile |
SEC |
Zacks Reports |
StockTalk |
News |
Chart |
Request a new note
C
A N
S L
I M


|
ARUN
-
NASDAQ
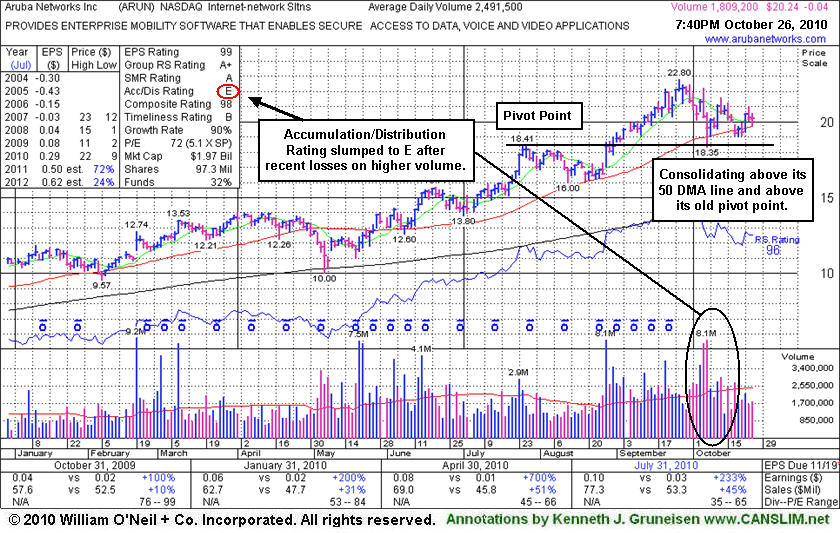
Aruba Networks Inc
COMPUTER HARDWARE - Networking andamp; Communication Dev
|
$20.24
|
-0.04
-0.20% |
$20.56
|
1,811,176
73.07% of 50 DAV
50 DAV is 2,478,600
|
$22.80
-11.23%
|
8/30/2010
|
$18.12
|
PP = $18.51
|
|
MB = $19.44
|
Most Recent Note - 10/26/2010 5:55:07 PM
G - Consolidating above its 50 DMA line and its prior lows noted as an important support to watch. More damaging losses leading to technical violations would raise concerns.
>>> The latest Featured Stock Update with an annotated graph appeared on 10/26/2010. Click here.
View all notes |
Alert me of new notes |
CANSLIM.net Company Profile |
SEC |
Zacks Reports |
StockTalk |
News |
Chart |
Request a new note
C
A N
S L
I M
|
BIDU
-
NASDAQ
Baidu Inc Ads
INTERNET - Internet Information Providers
|
$112.62
|
+2.87
2.61% |
$113.36
|
15,243,447
139.21% of 50 DAV
50 DAV is 10,950,000
|
$110.05
2.34%
|
9/17/2010
|
$85.73
|
PP = $88.42
|
|
MB = $92.84
|
Most Recent Note - 10/26/2010 5:31:26 PM
G - Up today with above average volume for a 4th consecutive gain and another new all-time high. The nearest support is recent chart lows near $95-96 which come into play above its 50 DMA line.
>>> The latest Featured Stock Update with an annotated graph appeared on 10/7/2010. Click here.
View all notes |
Alert me of new notes |
CANSLIM.net Company Profile |
SEC |
Zacks Reports |
StockTalk |
News |
Chart |
Request a new note
C
A N
S L
I M
|
CACC
-
NASDAQ
Credit Acceptance Corp
FINANCIAL SERVICES - Credit Services
|
$58.67
|
+0.92
1.59% |
$59.03
|
6,677
21.82% of 50 DAV
50 DAV is 30,600
|
$63.45
-7.53%
|
7/29/2010
|
$52.04
|
PP = $54.07
|
|
MB = $56.77
|
Most Recent Note - 10/26/2010 10:25:16 AM
G - It is hovering -8% off its 52-week high and its 50 DMA line has acted as resistance while volume totals have been cooling noticeably in recent weeks. Reports earnings on Monday, November 1, 2010, after the market close. Its $55.07 low (on 10/04/10) defines the nearest chart support level to watch above its long ago chart highs ($53.97).
>>> The latest Featured Stock Update with an annotated graph appeared on 9/30/2010. Click here.
View all notes |
Alert me of new notes |
CANSLIM.net Company Profile |
SEC |
Zacks Reports |
StockTalk |
News |
Chart |
Request a new note
C
A N
S L
I M
|
CMG
-
NYSE
Chipotle Mexican Grill
LEISURE - Restaurants
|
$212.86
|
+7.21
3.51% |
$215.38
|
1,651,916
234.28% of 50 DAV
50 DAV is 705,100
|
$208.37
2.15%
|
9/1/2010
|
$158.31
|
PP = $155.52
|
|
MB = $163.30
|
Most Recent Note - 10/26/2010 5:26:24 PM
G - Hit a new all-time high today with a gain backed by 2 times average volume, getting more extended from a sound base. Its 50 DMA line defines chart support above its prior highs in the $155 area.
>>> The latest Featured Stock Update with an annotated graph appeared on 9/1/2010. Click here.
View all notes |
Alert me of new notes |
CANSLIM.net Company Profile |
SEC |
Zacks Reports |
StockTalk |
News |
Chart |
Request a new note
C
A N
S L
I M
|
Symbol/Exchange
Company Name
Industry Group |
PRICE |
CHANGE
(%Change) |
Day High |
Volume
(% DAV)
(% 50 day avg vol) |
52 Wk Hi
% From Hi |
Featured
Date |
Price
Featured |
Pivot Featured |
|
Max Buy |
CTRP
-
NASDAQ
Ctrip.Com Intl Ltd Adr
LEISURE - Resorts and Casinos
|
$51.29
|
-0.71
-1.37% |
$52.51
|
1,487,916
92.22% of 50 DAV
50 DAV is 1,613,500
|
$52.90
-3.04%
|
9/24/2010
|
$46.75
|
PP = $47.11
|
|
MB = $49.47
|
Most Recent Note - 10/25/2010 5:10:24 PM
G - Gain today with above average volume, rallying further beyond its "max buy" level. Prior highs in the $47 area define support to watch above its 50 DMA line.
>>> The latest Featured Stock Update with an annotated graph appeared on 9/28/2010. Click here.
View all notes |
Alert me of new notes |
CANSLIM.net Company Profile |
SEC |
Zacks Reports |
StockTalk |
News |
Chart |
Request a new note
C
A N
S L
I M
|
EBIX
-
NASDAQ
Ebix Inc
COMPUTER SOFTWARE and SERVICES - Business Software and Services
|
$23.95
|
+0.31
1.31% |
$24.55
|
482,890
83.23% of 50 DAV
50 DAV is 580,200
|
$25.61
-6.48%
|
9/23/2010
|
$21.78
|
PP = $22.74
|
|
MB = $23.88
|
Most Recent Note - 10/26/2010 4:09:01 PM
G - Still consolidating in a healthy manner with volume totals cooling since its negative reversal on 10/06/10. Color code is changed to green now, after weeks of trading offered investors chances to accumulate shares below its "max buy" level. Tight closes in the past 3 weeks (best viewed on its weekly chart) are not considered an advanced "3-weeks tight" type pattern due to its lack of significant progress above the pivot point recently cited. (JOBS was recently noted as a better example of a "3 weeks tight" pattern.)
>>> The latest Featured Stock Update with an annotated graph appeared on 9/24/2010. Click here.
View all notes |
Alert me of new notes |
CANSLIM.net Company Profile |
SEC |
Zacks Reports |
StockTalk |
News |
Chart |
Request a new note
C
A N
S L
I M
|
FFIV
-
NASDAQ
F 5 Networks Inc
INTERNET - Internet Software and Services
|
$102.54
|
+1.71
1.70% |
$103.75
|
5,324,195
244.03% of 50 DAV
50 DAV is 2,181,800
|
$112.05
-8.49%
|
6/16/2010
|
$74.50
|
PP = $74.10
|
|
MB = $77.81
|
Most Recent Note - 10/26/2010 5:34:47 PM
G - Up today for 5th consecutive gain with ever-increasing volume, it recently found prompt support near its 50 DMA line. More time may be needed for a new base to form, meanwhile recent chart lows define important support to watch.
>>> The latest Featured Stock Update with an annotated graph appeared on 9/13/2010. Click here.
View all notes |
Alert me of new notes |
CANSLIM.net Company Profile |
SEC |
Zacks Reports |
StockTalk |
News |
Chart |
Request a new note
C
A N
S L
I M
|
FOSL
-
NASDAQ
Fossil Inc
CONSUMER DURABLES - Recreational Goods, Other
|
$57.94
|
+0.64
1.12% |
$58.75
|
694,615
92.47% of 50 DAV
50 DAV is 751,200
|
$57.81
0.22%
|
10/20/2010
|
$54.12
|
PP = $55.61
|
|
MB = $58.39
|
Most Recent Note - 10/26/2010 5:45:23 PM
Y - Volume conviction has been lacking while wedging to new all-time highs today with a 4th consecutive gain, rising from a "late stage" base considered a "3-weeks tight" type pattern. The nearby chart support level to watch is its 50 DMA line.
>>> The latest Featured Stock Update with an annotated graph appeared on 10/5/2010. Click here.
View all notes |
Alert me of new notes |
CANSLIM.net Company Profile |
SEC |
Zacks Reports |
StockTalk |
News |
Chart |
Request a new note
C
A N
S L
I M
|
HMSY
-
NASDAQ
H M S Holdings Corp
COMPUTER SOFTWARE and SERVICES - Healthcare Information Service
|
$60.30
|
-0.13
-0.22% |
$60.88
|
159,532
93.46% of 50 DAV
50 DAV is 170,700
|
$62.91
-4.15%
|
9/27/2010
|
$57.97
|
PP = $58.36
|
|
MB = $61.28
|
Most Recent Note - 10/26/2010 4:19:17 PM
Y - Volume totals have been average or below average while consolidating since a "negative reversal" on 10/15/10 after hitting a new all-time high. Its waning Relative Strength rating is a concern. Prior highs in the $58 area and its 50 DMA line define chart support to watch.
>>> The latest Featured Stock Update with an annotated graph appeared on 9/27/2010. Click here.
View all notes |
Alert me of new notes |
CANSLIM.net Company Profile |
SEC |
Zacks Reports |
StockTalk |
News |
Chart |
Request a new note
C
A N
S L
I M
|
Symbol/Exchange
Company Name
Industry Group |
PRICE |
CHANGE
(%Change) |
Day High |
Volume
(% DAV)
(% 50 day avg vol) |
52 Wk Hi
% From Hi |
Featured
Date |
Price
Featured |
Pivot Featured |
|
Max Buy |
HS
-
NYSE
Healthspring Inc
HEALTH SERVICES - Health Care Plans
|
$27.70
|
-0.30
-1.07% |
$27.93
|
505,605
72.48% of 50 DAV
50 DAV is 697,600
|
$28.10
-1.41%
|
8/27/2010
|
$19.91
|
PP = $19.75
|
|
MB = $20.74
|
Most Recent Note - 10/25/2010 5:01:43 PM
G - Hit a new all-time high today with a gain on light volume. After 5 consecutive weekly gains, it has not formed a recent sound base. Earnings news is due on Thursday, October 28, 2010. Support to watch is prior chart highs in the $19-20 area.
>>> The latest Featured Stock Update with an annotated graph appeared on 10/22/2010. Click here.
View all notes |
Alert me of new notes |
CANSLIM.net Company Profile |
SEC |
Zacks Reports |
StockTalk |
News |
Chart |
Request a new note
C
A N
S L
I M
|
IGTE
-
NASDAQ
Igate Corp
COMPUTER SOFTWARE and SERVICES - Information Technology Service
|
$20.25
|
+1.41
7.48% |
$20.63
|
1,307,213
272.85% of 50 DAV
50 DAV is 479,100
|
$19.45
4.11%
|
10/26/2010
|
$17.29
|
PP = $19.55
|
|
MB = $20.53
|
Most Recent Note - 10/26/2010 10:15:18 AM
Y - Considerable gain today with volume running at an above average pace as it has rallied to a new 52-week high. New pivot point is cited based on its 9/20/10 high plus ten cents, after more than 5 weeks of consolidation just above its 50 DMA line. A strong close on heavier volume would be a reassuring sign of institutional buying demand. More damaging losses leading to violation of its 50 DMA line or recent chart low ($16.75 on 10/07/10) would raise concerns and trigger technical sell signals.
>>> The latest Featured Stock Update with an annotated graph appeared on 9/10/2010. Click here.
View all notes |
Alert me of new notes |
CANSLIM.net Company Profile |
SEC |
Zacks Reports |
StockTalk |
News |
Chart |
Request a new note
C
A N
S L
I M
|
JOBS
-
NASDAQ
Fifty One Job Inc Ads
DIVERSIFIED SERVICES - Staffing and; Outsourcing Service
|
$44.40
|
-2.14
-4.60% |
$47.00
|
156,868
84.16% of 50 DAV
50 DAV is 186,400
|
$47.48
-6.49%
|
10/13/2010
|
$42.07
|
PP = $40.60
|
|
MB = $42.63
|
Most Recent Note - 10/26/2010 5:24:52 PM
G - Wider intra-day price swings are a sign of uncertainty, meanwhile prior highs in the $40 area define support above its 50 DMA line.
>>> The latest Featured Stock Update with an annotated graph appeared on 9/16/2010. Click here.
View all notes |
Alert me of new notes |
CANSLIM.net Company Profile |
SEC |
Zacks Reports |
StockTalk |
News |
Chart |
Request a new note
C
A N
S L
I M
|
LFT
-
NYSE
Longtop Financl Tech Ads
COMPUTER SOFTWARE and SERVICES - Business Software and Services
|
$38.45
|
-0.41
-1.06% |
$38.75
|
359,358
72.79% of 50 DAV
50 DAV is 493,700
|
$41.77
-7.95%
|
10/14/2010
|
$39.97
|
PP = $41.87
|
|
MB = $43.96
|
Most Recent Note - 10/25/2010 5:07:37 PM
G - Small gap up gain today with light volume, consolidating above support at its 50 DMA line - an important level to watch. Gains with above average volume for a new high close are needed for its outlook to improve, technically.
>>> The latest Featured Stock Update with an annotated graph appeared on 10/14/2010. Click here.
View all notes |
Alert me of new notes |
CANSLIM.net Company Profile |
SEC |
Zacks Reports |
StockTalk |
News |
Chart |
Request a new note
C
A N
S L
I M
|
LULU
-
NASDAQ
Lululemon Athletica
MANUFACTURING - Textile Manufacturing
|
$45.65
|
+0.77
1.72% |
$46.48
|
1,143,909
96.79% of 50 DAV
50 DAV is 1,181,900
|
$48.45
-5.78%
|
10/8/2010
|
$47.66
|
PP = $46.67
|
|
MB = $49.00
|
Most Recent Note - 10/26/2010 4:03:41 PM
Y - Its color code is changed to yellow while now only -5% off its 52-week high, hovering near old highs in the $45-46 area. Recent lows in the $42 area define support to watch above its 50 DMA line. Subsequent gains to new highs with volume would be welcomed as a confirming sign of serious institutional accumulation.
>>> The latest Featured Stock Update with an annotated graph appeared on 10/8/2010. Click here.
View all notes |
Alert me of new notes |
CANSLIM.net Company Profile |
SEC |
Zacks Reports |
StockTalk |
News |
Chart |
Request a new note
C
A N
S L
I M
|
Symbol/Exchange
Company Name
Industry Group |
PRICE |
CHANGE
(%Change) |
Day High |
Volume
(% DAV)
(% 50 day avg vol) |
52 Wk Hi
% From Hi |
Featured
Date |
Price
Featured |
Pivot Featured |
|
Max Buy |
MRX
-
NYSE
Medicis Pharmaceut Cl A
DRUGS - Biotechnology
|
$30.46
|
+0.01
0.03% |
$30.56
|
1,133,835
104.50% of 50 DAV
50 DAV is 1,085,000
|
$30.94
-1.55%
|
8/12/2010
|
$26.88
|
PP = $26.71
|
|
MB = $28.05
|
Most Recent Note - 10/26/2010 6:03:22 PM
G - Consolidating in a tight trading range in recent weeks just above its 50 DMA line. That short-term average and recent chart lows in the $29 area define important support.
>>> The latest Featured Stock Update with an annotated graph appeared on 10/4/2010. Click here.
View all notes |
Alert me of new notes |
CANSLIM.net Company Profile |
SEC |
Zacks Reports |
StockTalk |
News |
Chart |
Request a new note
C
A N
S L
I M
|
MWIV
-
NASDAQ
M W I Veterinary Supply
HEALTH SERVICES - Medical Instruments and; Supplies
|
$56.94
|
+0.79
1.41% |
$57.24
|
74,609
125.39% of 50 DAV
50 DAV is 59,500
|
$59.50
-4.30%
|
7/29/2010
|
$52.05
|
PP = $52.09
|
|
MB = $54.69
|
Most Recent Note - 10/26/2010 5:36:38 PM
G - Finding support near its 50 DMA line. A subsequent violation of that classic chart support level and a breach of recent lows (near $54.60) would raise greater concerns.
>>> The latest Featured Stock Update with an annotated graph appeared on 9/7/2010. Click here.
View all notes |
Alert me of new notes |
CANSLIM.net Company Profile |
SEC |
Zacks Reports |
StockTalk |
News |
Chart |
Request a new note
C
A N
S L
I M
|
NEM
-
NYSE
Newmont Mining Corp
METALS and MINING - Gold
|
$59.46
|
+0.09
0.15% |
$60.07
|
5,398,436
85.48% of 50 DAV
50 DAV is 6,315,800
|
$65.50
-9.22%
|
8/31/2010
|
$61.32
|
PP = $63.48
|
|
MB = $66.65
|
Most Recent Note - 10/26/2010 6:01:21 PM
G - Hovering -9% off its 52-week high and below its 50 DMA line, its Relative Strength rank has slumped to 70, raising concerns. The Mining - Gold/Silver/Gems group (L criteria) still has a strong Group RS Rating of 97.
>>> The latest Featured Stock Update with an annotated graph appeared on 9/14/2010. Click here.
View all notes |
Alert me of new notes |
CANSLIM.net Company Profile |
SEC |
Zacks Reports |
StockTalk |
News |
Chart |
Request a new note
C
A N
S L
I M
|
NEOG
-
NASDAQ
Neogen Corp
DRUGS - Diagnostic Substances
|
$34.39
|
-0.14
-0.41% |
$35.00
|
51,261
50.26% of 50 DAV
50 DAV is 102,000
|
$36.37
-5.44%
|
9/1/2010
|
$30.79
|
PP = $30.49
|
|
MB = $32.01
|
Most Recent Note - 10/25/2010 4:38:50 PM
G - Ended near the session low today, reversing for a loss on heavy volume after initially gapping up. Extended from a sound base, its 50 DMA line defines initial support above prior highs in the $30 area.
>>> The latest Featured Stock Update with an annotated graph appeared on 10/13/2010. Click here.
View all notes |
Alert me of new notes |
CANSLIM.net Company Profile |
SEC |
Zacks Reports |
StockTalk |
News |
Chart |
Request a new note
C
A N
S L
I M
|
NFLX
-
NASDAQ
Netflix Inc
SPECIALTY RETAIL - Music and Video Stores
|
$177.62
|
+10.78
6.46% |
$179.56
|
10,518,275
188.72% of 50 DAV
50 DAV is 5,573,500
|
$174.94
1.53%
|
8/10/2010
|
$124.05
|
PP = $124.00
|
|
MB = $130.20
|
Most Recent Note - 10/26/2010 10:17:13 AM
G - Held its ground stubbornly since its considerable gap up gain on 10/21/10 following strong earnings news for the quarter ended September 30, 2010. NFLX has not formed a sound base pattern and is trading near prior highs that were marked by an ugly "negative reversal" on 9/30/10.
>>> The latest Featured Stock Update with an annotated graph appeared on 10/1/2010. Click here.
View all notes |
Alert me of new notes |
CANSLIM.net Company Profile |
SEC |
Zacks Reports |
StockTalk |
News |
Chart |
Request a new note
C
A N
S L
I M
|
Symbol/Exchange
Company Name
Industry Group |
PRICE |
CHANGE
(%Change) |
Day High |
Volume
(% DAV)
(% 50 day avg vol) |
52 Wk Hi
% From Hi |
Featured
Date |
Price
Featured |
Pivot Featured |
|
Max Buy |
NTAP
-
NASDAQ
Netapp Inc
COMPUTER HARDWARE - Data Storage Devices
|
$52.31
|
+0.41
0.79% |
$52.70
|
3,757,490
45.05% of 50 DAV
50 DAV is 8,341,500
|
$52.71
-0.76%
|
9/8/2010
|
$46.98
|
PP = $44.99
|
|
MB = $47.24
|
Most Recent Note - 10/26/2010 6:06:44 PM
G - Gain today with light volume for a new high close. Its recent lows near $47 define an initial chart support level to watch above its 50 DMA line.
>>> The latest Featured Stock Update with an annotated graph appeared on 9/8/2010. Click here.
View all notes |
Alert me of new notes |
CANSLIM.net Company Profile |
SEC |
Zacks Reports |
StockTalk |
News |
Chart |
Request a new note
C
A N
S L
I M
|
ORCL
-
NASDAQ
Oracle Corp
COMPUTER SOFTWARE and SERVICES - Application Software
|
$28.63
|
-0.21
-0.73% |
$28.84
|
28,035,710
71.51% of 50 DAV
50 DAV is 39,205,800
|
$29.29
-2.25%
|
9/20/2010
|
$27.32
|
PP = $26.73
|
|
MB = $28.07
|
Most Recent Note - 10/26/2010 4:10:50 PM
G - Below average volume has been behind small losses this week. Stubbornly holding its ground after getting extended beyond its "max buy" level with recent volume-driven gains.
>>> The latest Featured Stock Update with an annotated graph appeared on 9/20/2010. Click here.
View all notes |
Alert me of new notes |
CANSLIM.net Company Profile |
SEC |
Zacks Reports |
StockTalk |
News |
Chart |
Request a new note
C
A N
S L
I M
|
PAY
-
NYSE
Verifone Systems Inc
COMPUTER HARDWARE - Transaction Automation Systems
|
$32.69
|
+0.01
0.03% |
$33.80
|
1,446,501
96.71% of 50 DAV
50 DAV is 1,495,700
|
$32.95
-0.78%
|
8/25/2010
|
$24.30
|
PP = $23.74
|
|
MB = $24.93
|
Most Recent Note - 10/25/2010 4:29:43 PM
G - Hit a new 52-week high today, and volume totals were above average behind 3 of its 4 consecutive gains. It is extended from a sound base pattern. Its 50 DMA and recent lows near $27 define chart support.
>>> The latest Featured Stock Update with an annotated graph appeared on 10/25/2010. Click here.
View all notes |
Alert me of new notes |
CANSLIM.net Company Profile |
SEC |
Zacks Reports |
StockTalk |
News |
Chart |
Request a new note
C
A N
S L
I M
|
PRGO
-
NASDAQ
Perrigo Co
DRUGS - Drug Related Products
|
$66.38
|
+0.18
0.27% |
$66.52
|
523,089
62.72% of 50 DAV
50 DAV is 834,000
|
$67.94
-2.30%
|
9/15/2010
|
$63.73
|
PP = $64.76
|
|
MB = $68.00
|
Most Recent Note - 10/25/2010 5:12:45 PM
Y - Light volume consolidation above its pivot point and below its "max buy" level continues. More damaging losses would raise concerns, meanwhile its 50 DMA line defines important chart support.
>>> The latest Featured Stock Update with an annotated graph appeared on 9/15/2010. Click here.
View all notes |
Alert me of new notes |
CANSLIM.net Company Profile |
SEC |
Zacks Reports |
StockTalk |
News |
Chart |
Request a new note
C
A N
S L
I M
|
RAX
-
NYSE
Rackspace Hosting Inc
INTERNET - Internet Software and; Services
|
$24.28
|
+0.62
2.62% |
$24.56
|
1,625,999
67.80% of 50 DAV
50 DAV is 2,398,300
|
$26.50
-8.38%
|
9/21/2010
|
$22.84
|
PP = $23.61
|
|
MB = $24.79
|
Most Recent Note - 10/26/2010 3:57:11 PM
Y - Volume remains below average while consolidating above support at its 50 DMA line - an important support level. Previously noted gap down on 10/06/10 completed an "island reversal" pattern, and its Relative Strength has subsequently waned. Reporting earnings on Monday, November 8, 2010, after the close.
>>> The latest Featured Stock Update with an annotated graph appeared on 9/21/2010. Click here.
View all notes |
Alert me of new notes |
CANSLIM.net Company Profile |
SEC |
Zacks Reports |
StockTalk |
News |
Chart |
Request a new note
C
A N
S L
I M
|
Symbol/Exchange
Company Name
Industry Group |
PRICE |
CHANGE
(%Change) |
Day High |
Volume
(% DAV)
(% 50 day avg vol) |
52 Wk Hi
% From Hi |
Featured
Date |
Price
Featured |
Pivot Featured |
|
Max Buy |
ROVI
-
NASDAQ
Rovi Corp
COMPUTER SOFTWARE andamp; SERVICES - Security Software andamp; Services
|
$50.47
|
+0.36
0.72% |
$50.70
|
1,474,868
98.78% of 50 DAV
50 DAV is 1,493,100
|
$53.00
-4.77%
|
8/31/2010
|
$43.31
|
PP = $45.06
|
|
MB = $47.31
|
Most Recent Note - 10/26/2010 5:52:42 PM
G - Gain today with average volume matched its best close in 3 weeks. Due to report earnings on Thursday, October 28, 2010 after the close. Support to watch is defined by recent lows in the $47.50 area while it is consolidating in a healthy fashion above prior highs and its 50 DMA line.
>>> The latest Featured Stock Update with an annotated graph appeared on 10/20/2010. Click here.
View all notes |
Alert me of new notes |
CANSLIM.net Company Profile |
SEC |
Zacks Reports |
StockTalk |
News |
Chart |
Request a new note
C
A N
S L
I M
|
SHOO
-
NASDAQ
Steven Madden Limited
CONSUMER NON-DURABLES - Textile - Apparel Footwear
|
$43.30
|
+0.61
1.43% |
$43.78
|
199,765
63.84% of 50 DAV
50 DAV is 312,900
|
$44.85
-3.46%
|
9/15/2010
|
$38.94
|
PP = $40.27
|
|
MB = $42.28
|
Most Recent Note - 10/25/2010 5:16:29 PM
G - Rallying back above its "max buy" level and its color code is changed to green. Found support above prior highs in the $40 area while recently enduring mild distributional pressure More damaging losses would raise concerns.
>>> The latest Featured Stock Update with an annotated graph appeared on 9/29/2010. Click here.
View all notes |
Alert me of new notes |
CANSLIM.net Company Profile |
SEC |
Zacks Reports |
StockTalk |
News |
Chart |
Request a new note
C
A N
S L
I M
|
SLW
-
NYSE
Silver Wheaton Corp
METALS and; MINING - Silver
|
$27.31
|
-0.02
-0.07% |
$27.65
|
5,637,465
87.07% of 50 DAV
50 DAV is 6,474,800
|
$28.39
-3.80%
|
8/25/2010
|
$21.40
|
PP = $21.99
|
|
MB = $23.09
|
Most Recent Note - 10/25/2010 4:26:11 PM
G - Gapped up today for a solid gain with average volume. Stocks in the Mining - Gold/Silver/Gems group sputtered in recent weeks while gold and silver bullion prices hit new highs. Its 50 DMA line defines chart support to watch.
>>> The latest Featured Stock Update with an annotated graph appeared on 10/18/2010. Click here.
View all notes |
Alert me of new notes |
CANSLIM.net Company Profile |
SEC |
Zacks Reports |
StockTalk |
News |
Chart |
Request a new note
C
A N
S L
I M
|
SVR
-
NYSE
Syniverse Holdings Inc
TELECOMMUNICATIONS - Diversified Communication Serv
|
$23.80
|
-0.13
-0.54% |
$24.20
|
305,109
44.41% of 50 DAV
50 DAV is 687,100
|
$24.24
-1.82%
|
9/22/2010
|
$23.60
|
PP = $23.87
|
|
MB = $25.06
|
Most Recent Note - 10/26/2010 5:47:52 PM
Y - With volume totals cooling it is still perched within close striking distance of its 52-week high, but its waning Relative Strength rating is a concern. It found prompt support near its 50 DMA line after a recent bout of distribution. Confirming gains for a new high close with heavy volume would be a bullish sign, meanwhile the recent chart low ($21.47) defines important support to watch.
>>> The latest Featured Stock Update with an annotated graph appeared on 9/22/2010. Click here.
View all notes |
Alert me of new notes |
CANSLIM.net Company Profile |
SEC |
Zacks Reports |
StockTalk |
News |
Chart |
Request a new note
C
A N
S L
I M
|
UA
-
NYSE
Under Armour Inc Cl A
CONSUMER NON-DURABLES - Textile - Apparel Clothing
|
$47.98
|
+0.07
0.15% |
$48.49
|
2,041,594
278.37% of 50 DAV
50 DAV is 733,400
|
$48.59
-1.26%
|
9/9/2010
|
$39.99
|
PP = $40.10
|
|
MB = $42.11
|
Most Recent Note - 10/26/2010 1:12:31 PM
G - Gapped down today following a report of earnings +21% on +22% sales revenues for the quarter ended September 30, 2010 versus the year ago period. It remains near its 52-week high, in healthy shape technically, and may deserve the benefit of the doubt with a favorable backdrop from the M criteria currently favoring 3 out of 4 growth stocks. However, the weaker earnings increase (under the +25% guideline) raises concerns, fundamentally, with respect to the C criteria. Earlier notes acknowledged the downward turn in annual earnings (A criteria) in FY '08, another fundamental concern with respect to the fact-based investment system.
.
>>> The latest Featured Stock Update with an annotated graph appeared on 9/9/2010. Click here.
View all notes |
Alert me of new notes |
CANSLIM.net Company Profile |
SEC |
Zacks Reports |
StockTalk |
News |
Chart |
Request a new note
C
A N
S L
I M
|
Symbol/Exchange
Company Name
Industry Group |
PRICE |
CHANGE
(%Change) |
Day High |
Volume
(% DAV)
(% 50 day avg vol) |
52 Wk Hi
% From Hi |
Featured
Date |
Price
Featured |
Pivot Featured |
|
Max Buy |
UFPT
-
NASDAQ
U F P Tech Inc
CONSUMER NON-DURABLES - Packaging and Containers
|
$12.01
|
-0.12
-0.99% |
$12.21
|
61,256
102.09% of 50 DAV
50 DAV is 60,000
|
$13.32
-9.83%
|
9/16/2010
|
$11.20
|
PP = $11.69
|
|
MB = $12.27
|
Most Recent Note - 10/25/2010 4:23:17 PM
G - Loss with average volume today, closing below its "max buy" level at the session low. The lack of meaningful progress since its early-October breakout is cause for concern, as some overhead supply has been created in recent weeks that may now act as resistance. Prior highs and its 50 DMA line in the $11 area define chart support to watch.
>>> The latest Featured Stock Update with an annotated graph appeared on 9/17/2010. Click here.
View all notes |
Alert me of new notes |
CANSLIM.net Company Profile |
SEC |
Zacks Reports |
StockTalk |
News |
Chart |
Request a new note
C
A N
S L
I M
|
ULTA
-
NASDAQ
Ulta Salon Cosm & Frag
SPECIALTY RETAIL - Specialty Retail, Other
|
$32.33
|
+0.23
0.72% |
$32.68
|
331,653
50.08% of 50 DAV
50 DAV is 662,300
|
$32.50
-0.52%
|
9/3/2010
|
$26.36
|
PP = $25.89
|
|
MB = $27.18
|
Most Recent Note - 10/25/2010 5:00:11 PM
G - Today's gain with light volume helped it hit a new 52-week high. Prior highs and its 50 DMA line coincide in the $26 area defining support to watch. No overhead supply remains to act as resistance.
>>> The latest Featured Stock Update with an annotated graph appeared on 9/3/2010. Click here.
View all notes |
Alert me of new notes |
CANSLIM.net Company Profile |
SEC |
Zacks Reports |
StockTalk |
News |
Chart |
Request a new note
C
A N
S L
I M
|
VIT
-
NYSE
Vanceinfo Tech Inc Ads
COMPUTER SOFTWARE and SERVICES - Business Software and Services
|
$36.54
|
+0.61
1.70% |
$36.89
|
789,326
118.82% of 50 DAV
50 DAV is 664,300
|
$36.12
1.16%
|
7/8/2010
|
$25.20
|
PP = $26.58
|
|
MB = $27.91
|
Most Recent Note - 10/26/2010 6:05:23 PM
G - Hit another new all-time high today with volume slightly above average. It has not formed a recent sound base pattern but patient investors may watch for it to eventually offer an ideal add-on buy point. Meanwhile, its 50 DMA line and recent low ($30.55 on 10/08/10) define important chart support to watch.
>>> The latest Featured Stock Update with an annotated graph appeared on 10/21/2010. Click here.
View all notes |
Alert me of new notes |
CANSLIM.net Company Profile |
SEC |
Zacks Reports |
StockTalk |
News |
Chart |
Request a new note
C
A N
S L
I M
|
WCRX
-
NASDAQ
Warner Chilcott Plc
DRUGS - Drug Manufacturers - Other
|
$24.37
|
+0.32
1.33% |
$24.38
|
2,427,652
84.98% of 50 DAV
50 DAV is 2,856,600
|
$25.32
-3.75%
|
8/23/2010
|
$21.04
|
PP = $20.84
|
|
MB = $21.88
|
Most Recent Note - 10/22/2010 4:16:48 PM
G - Volume was above average today with a worrisome "negative reversal" after a gap up, as it finished near the session low with a loss. Prior chart highs near $23.50 define near-term support above its 50 DMA line.
>>> The latest Featured Stock Update with an annotated graph appeared on 10/15/2010. Click here.
View all notes |
Alert me of new notes |
CANSLIM.net Company Profile |
SEC |
Zacks Reports |
StockTalk |
News |
Chart |
Request a new note
C
A N
S L
I M
|