You are not logged in.
This means you
CAN ONLY VIEW reports that were published prior to Monday, April 14, 2025.
You
MUST UPGRADE YOUR MEMBERSHIP if you want to see any current reports.
AFTER MARKET UPDATE - MONDAY, OCTOBER 26TH, 2009
Previous After Market Report Next After Market Report >>>
|
|
|
|
DOW |
-104.22 |
9,867.96 |
-1.05% |
|
Volume |
1,388,085,280 |
+9% |
|
Volume |
2,345,274,000 |
-6% |
|
NASDAQ |
-12.62 |
2,141.85 |
-0.59% |
|
Advancers |
714 |
23% |
|
Advancers |
792 |
28% |
|
S&P 500 |
-12.65 |
1,066.95 |
-1.17% |
|
Decliners |
2,318 |
74% |
|
Decliners |
1,936 |
68% |
|
Russell 2000 |
-7.18 |
593.68 |
-1.19% |
|
52 Wk Highs |
129 |
|
|
52 Wk Highs |
81 |
|
|
S&P 600 |
-3.21 |
314.44 |
-1.01% |
|
52 Wk Lows |
8 |
|
|
52 Wk Lows |
22 |
|
|
 |
Major Averages Sink Again While Breadth Remains Negative
Adam Sarhan, Contributing Writer,
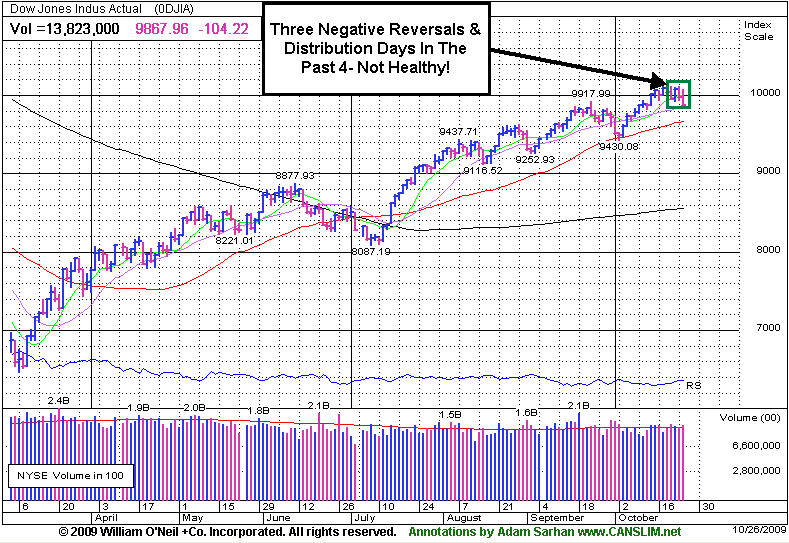
Most of the popular indexes suffered another negative reversal and distribution day after the US dollar finally bounced. This marks three "negative reversals" in the past four sessions which is an ominous sign and suggests that large institutions are heavily selling stocks, not buying them. Decliners trumped advancers by over a 3-to-1 ratio on the NYSE and over a 2-to-1 ratio on the Nasdaq exchange.
From our perspective, the current rally is under pressure, which bodes less favorably concerning the M criteria. At least one encouraging sign to watch for is that the major averages continue trading above their respective 50-day moving average (DMA) lines.
Monday's volume totals were mixed, reported higher on the NYSE, yet lower on the Nasdaq exchange helping that index avoid a distribution day. There were 25 high-ranked companies from the CANSLIM.net Leaders List, making a new 52-week high and appearing on the CANSLIM.net BreakOuts Page, higher than the 23 issues that appeared on the prior session. New 52-week highs still substantially outnumbered new 52-week lows on both major exchanges.
The market opened higher but quickly turned tail after the US dollar bounced from an egregiously oversold level. Ticker symbol: UUP is a popular exchange traded fund (ETF) that tracks the greenback. Another way to "play" the dollar's decline is buy buying/selling any of the other currency related ETF's, such as the FXE (euro) or FXC (Canadian dollar). Remember that the dollar is inversely related to these currencies so when the dollar rallies the respective currencies fall and vice versa. A stronger dollar also puts pressure on dollar denominated assets such as stocks and commodities. Therefore, it should come as no surprise that the big move in the dollar Monday morning put additional pressure on equities. The current rally is 34 weeks old and has yet to pullback more than 8% since the March 12, 2009 follow-through day. That said, as long as the major averages continue trading above their respective 50 DMA lines the bulls remain in control.
PICTURED: The Dow Jones Industrial Average suffered another negative reversal and distribution day, which marks 3 out of the past 4 sessions intra-day gains were erased for losses!
|
|
|
 |
Bank Index and Gold & Silver Index Among Leading Decliners
Kenneth J. Gruneisen - Passed the CAN SLIM® Master's Exam
Financial shares fell and dragged the Bank Index ($BKX -4.09%) to a large loss while the Broker/Dealer Index ($XBD -1.42%) held up better, however the weak action financial shares has prompted another look at these indices below. The Gold & Silver Index ($XAU -3.85%) was not a helpful "safe haven" as it was among Monday's laggards. Losses were widespread as the Networking Index ($NWX -2.75%), Biotechnology Index ($BTK -1.87%), and Healthcare Index ($HMO -2.69%) suffered large losses. Energy shares were weaker as the Oil Services Index ($OSX -2.27%) and Integrated Oil Index ($XOI -1.46%) gave way to more profit taking pressure following their recent sharp rallies. The Internet Index ($IIX -0.54%) ended only slightly lower, and the Semiconductor Index ($SOX +0.33%) and Retail Index ($RLX +0.36%) bucked the mostly negative bias by posting very small gains.
Charts courtesy www.stockcharts.com
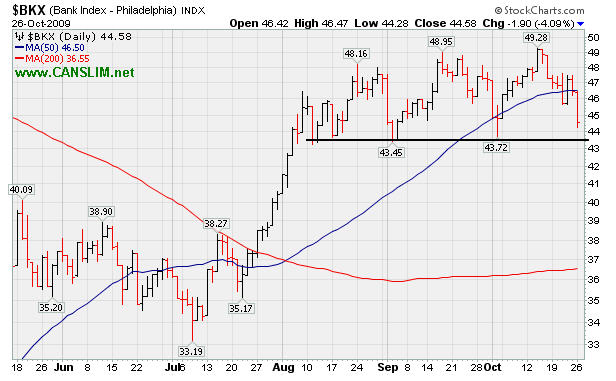
PICTURED 1: The Bank Index ($BKX -4.09%) dove toward recent chart lows with a large loss.
Charts courtesy www.stockcharts.com
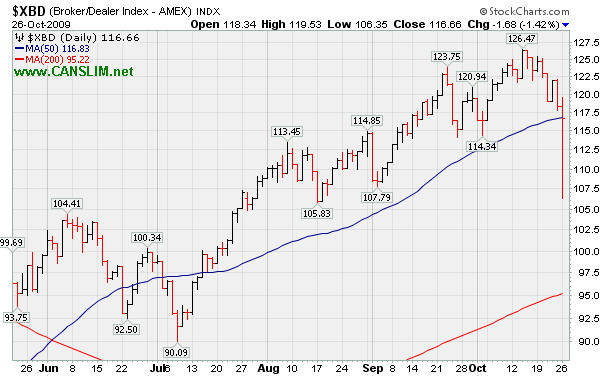
PICTURED: The Broker/Dealer Index ($XBD -1.42%) closed the session very near its 50-day moving average line. Several sources reported an intra-day low near its August low. If that is truly the case, its close near the upper end its trading range might be considered encouraging. Further deterioration in financial stocks would bode well for the broader market outlook.
| Oil Services |
$OSX |
199.93 |
-4.65 |
-2.27% |
+64.70% |
| Healthcare |
$HMO |
1,113.33 |
-30.79 |
-2.69% |
+15.95% |
| Integrated Oil |
$XOI |
1,086.41 |
-16.07 |
-1.46% |
+10.89% |
| Semiconductor |
$SOX |
317.44 |
+1.03 |
+0.33% |
+49.62% |
| Networking |
$NWX |
227.54 |
-6.44 |
-2.75% |
+58.13% |
| Internet |
$IIX |
222.48 |
-1.21 |
-0.54% |
+66.32% |
| Broker/Dealer |
$XBD |
116.66 |
-1.68 |
-1.42% |
+50.59% |
| Retail |
$RLX |
396.46 |
+1.41 |
+0.36% |
+41.97% |
| Gold & Silver |
$XAU |
165.47 |
-6.62 |
-3.85% |
+33.61% |
| Bank |
$BKX |
44.58 |
-1.90 |
-4.09% |
+0.59% |
| Biotech |
$BTK |
860.63 |
-16.44 |
-1.87% |
+32.98% |
|
|
|
 |
Violation Triggers Technical Sell Signal
Kenneth J. Gruneisen - Passed the CAN SLIM® Master's Exam
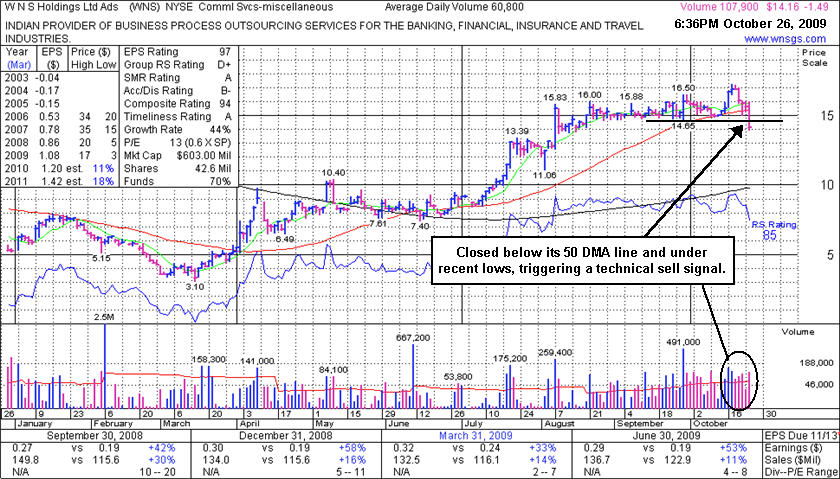
W N S Holdings Ltd Ads (WNS -$1.49 or -10.52% to $14.16) has totally negated its breakout, and worse, as today's loss on above average volume led to a violation of its 50-day moving average (DMA) line and recent chart lows, triggering technical sell signals. The high-ranked Indian Commercial Services may serve as an example of why disciplined investors should limit losses if any stock falls more than 7-8% from the price paid. The deterioration back into its prior base had already raised concerns and been noted. It encountered prompt distribution pressure shortly after its 10/16/09 considerable gain on more than 2 times average volume which helped it trade and close above its pivot point, triggering a technical buy signal while clearing stubborn resistance.
Since featured at $15.28 in yellow in the 9/28/09 mid-day report (read here) it had encountered resistance in the $16 area while consolidating just above important support at its 50-day moving average (DMA) line. Quarterly earnings have been above the +25% guideline and its annual earnings history has been great, satisfying the C & A criteria. However, sales revenues growth has decelerated, raising some concerns. Only 14.5 million shares are in the public float, which is considered a good characteristic concerning the S criteria, and could contribute to greater volatility in the event of any heavier institutional buying or selling that may come.
|
|
|
Color Codes Explained :
Y - Better candidates highlighted by our
staff of experts.
G - Previously featured
in past reports as yellow but may no longer be buyable under the
guidelines.
***Last / Change / Volume quote data in this table corresponds with the timestamp on the note***
Symbol/Exchange
Company Name
Industry Group |
Last |
Chg. |
Vol
% DAV |
Date Featured |
Price Featured |
Latest Pivot Point
Featured |
Status |
| Latest Max Buy Price |
ARO
- NYSE
Aeropostale Inc
RETAIL - Apparel Stores
|
$42.33
|
-0.10
|
1,568,418
60% DAV
2,607,600
|
8/21/2009
(Date
Featured) |
$39.21
(Price
Featured) |
PP = $44.95 |
Y |
| MB = $47.20 |
Most Recent Note - 10/26/2009 6:06:21 PM
Y - Small loss today on light volume after rallying up from support at its 50 DMA line last week. Any subsequent violation of its 50 DMA and recent chart lows could raise concerns and trigger worrisome technical sell signals. Additional analysis (in response to a member inquiry) was included in the "Ken's Mailbag" section of the 10/21/09 After-Market Update (read here). Two months earlier, ARO was featured in yellow in the 8/21/09 Mid-Day BreakOuts Report (read here).
>>> The latest Featured Stock Update with an annotated graph appeared on 10/22/2009. click here.
|
|
C
A
S
I |
News |
Chart |
SEC
View all notes Alert
me of new notes
Company
Profile
|
ARST
-
|
$25.07
|
+0.16
|
403,078
60% DAV
672,000
|
9/1/2009
(Date
Featured) |
$19.91
(Price
Featured) |
PP = $20.90 |
G |
| MB = $21.95 |
Most Recent Note - 10/26/2009 6:08:42 PM
G - Still quietly consolidating in a tight range above prior chart highs. It has been noted as "extended from its 9/04/09 'late stage' breakout." ARST was first featured in yellow at $19.91 in the 9/01/09 mid-day report with an annotated daily graph (read here).
>>> The latest Featured Stock Update with an annotated graph appeared on 10/21/2009. click here.
|
|
C
A
S
I |
News |
Chart |
SEC
View all notes Alert
me of new notes
Company
Profile
|
ASIA
-
|
$21.79
|
-0.67
|
969,912
122% DAV
795,400
|
10/14/2009
(Date
Featured) |
$23.05
(Price
Featured) |
PP = $22.19 |
Y |
| MB = $23.30 |
Most Recent Note - 10/26/2009 6:14:08 PM
Y - Its close below its pivot point raised concerns while slightly above average volume today led to its 5th consecutive loss. Prior chart highs in the $21-22 area are important support to watch on pullbacks. It was highlighted in yellow in the 10/14/09 mid-day report (read here) as it gapped up for a new 52-week high with 5 times average volume, triggering a technical buy signal by blasting above its pivot point. First featured in the August 2009 CANSLIM.net News (read here).
>>> The latest Featured Stock Update with an annotated graph appeared on 10/14/2009. click here.
|
|
C
A
S
I |
News |
Chart |
SEC
View all notes Alert
me of new notes
Company
Profile
|
BIDU
- NASDAQ
Baidu Inc Ads
INTERNET - Internet Information Providers
|
$432.97
|
-2.34
|
3,486,806
185% DAV
1,889,400
|
9/8/2009
(Date
Featured) |
$351.80
(Price
Featured) |
PP = $368.59 |
G |
| MB = $387.02 |
Most Recent Note - 10/26/2009 6:18:19 PM
G - Its loss today followed a considerable gain on 10/23/09 with above average volume for a new all-time high. Choppy action has not allowed it to form a sound base in recent weeks. There is no overhead supply to act as resistance now, and it has traded up about +23% from its price when featured in yellow in the 9/08/09 Mid-Day BreakOuts Report (read here).
>>> The latest Featured Stock Update with an annotated graph appeared on 10/7/2009. click here.
|
|
C
A
S
I |
News |
Chart |
SEC
View all notes Alert
me of new notes
Company
Profile
|
CACC
- NASDAQ
Credit Acceptance Corp
FINANCIAL SERVICES - Credit Services
|
$36.10
|
-0.51
|
11,670
30% DAV
39,200
|
9/29/2009
(Date
Featured) |
$33.48
(Price
Featured) |
PP = $32.60 |
G |
| MB = $34.23 |
Most Recent Note - 10/26/2009 6:19:32 PM
G - Volume continued drying up while it stubbornly held its ground, hovering near all-time highs. Prior chart highs and its 50 DMA line coincide in the $32 area, an important level to watch on pullbacks. The Finance - Consumer/Commercial Loans firm has maintained a great track record of annual and quarterly sales revenues and earnings increases. It was featured on 9/29/09 in yellow in the mid-day report (read here).
>>> The latest Featured Stock Update with an annotated graph appeared on 10/15/2009. click here.
|
|
C
A
S
I |
News |
Chart |
SEC
View all notes Alert
me of new notes
Company
Profile
|
CRM
- NYSE
Salesforce.com Inc
INTERNET - Internet Software & Services
|
$61.42
|
-1.70
|
1,388,905
69% DAV
2,008,900
|
8/16/2009
(Date
Featured) |
$47.12
(Price
Featured) |
PP = $45.59 |
G |
| MB = $47.87 |
Most Recent Note - 10/26/2009 6:21:39 PM
G - Pulled back today on quiet volume. Now extended from any sound base, the initial technical support to watch is prior chart highs in the $59 area which coincide with an upward trendline connecting its July, August and October chart lows. Both are just above additional support at its 50 DMA line.
>>> The latest Featured Stock Update with an annotated graph appeared on 10/5/2009. click here.
|
|
C
A
S
I |
News |
Chart |
SEC
View all notes Alert
me of new notes
Company
Profile
|
EBIX
- NASDAQ
Ebix Inc
COMPUTER SOFTWARE & SERVICES - Business Software & Services
|
$65.50
|
-0.25
|
279,057
127% DAV
219,200
|
8/28/2009
(Date
Featured) |
$45.86
(Price
Featured) |
PP = $45.35 |
G |
| MB = $47.62 |
Most Recent Note - 10/26/2009 6:23:25 PM
G - After gapping up today, touching a new all-time high, it negatively reversed and closed near the session low. It is now very extended from any sound base, well above support at its 50 DMA line, and more than +90% above its 200 DMA line - all of which are reminders to be watchful for sell signals.
>>> The latest Featured Stock Update with an annotated graph appeared on 10/13/2009. click here.
|
|
C
A
S
I |
News |
Chart |
SEC
View all notes Alert
me of new notes
Company
Profile
|
GMCR
- NASDAQ
Green Mtn Coffee Roastrs
FOOD & BEVERAGE - Processed & Packaged Goods
|
$73.78
|
-0.86
|
688,865
56% DAV
1,228,200
|
10/5/2009
(Date
Featured) |
$71.11
(Price
Featured) |
PP = $75.89 |
Y |
| MB = $79.68 |
Most Recent Note - 10/26/2009 6:25:27 PM
Y - Loss today on light volume, slumping further below its pivot point while closing near the session low. Keep in mind this may be considered a 3rd or 4th stage base, and thus more failure prone, meanwhile its earlier breakouts were backed by far more impressive volume.
>>> The latest Featured Stock Update with an annotated graph appeared on 10/12/2009. click here.
|
|
C
A
S
I |
News |
Chart |
SEC
View all notes Alert
me of new notes
Company
Profile
|
PEGA
- NASDAQ
Pegasystems Inc
COMPUTER SOFTWARE & SERVICES - Business Software & Services
|
$33.03
|
+0.27
|
123,587
38% DAV
321,300
|
9/9/2009
(Date
Featured) |
$31.14
(Price
Featured) |
PP = $33.35 |
Y |
| MB = $35.02 |
Most Recent Note - 10/26/2009 6:27:06 PM
Y - This high-ranked Computer Software - Financial firm ended with a small gain on light volume, perched near its 50 DMA line. That short-term average and its upward trendline are important technical support levels to watch.
>>> The latest Featured Stock Update with an annotated graph appeared on 10/23/2009. click here.
|
|
C
A
S
I |
News |
Chart |
SEC
View all notes Alert
me of new notes
Company
Profile
|
SWI
- NYSE
Solarwinds Inc
COMPUTER SOFTWARE & SERVICES - Application Software
|
$19.30
|
-0.54
|
754,614
139% DAV
544,400
|
9/30/2029
(Date
Featured) |
$22.03
(Price
Featured) |
PP = $21.72 |
G |
| MB = $22.81 |
Most Recent Note - 10/26/2009 6:29:44 PM
G - Down today on above average volume after failing last week to rebound following gaps down on 10/20 & 10/21 for considerable losses with heavy volume. It violated its 50 DMA line and recent chart lows in the $20.50 area, triggering technical sell signals. It would need to promptly repair its 50 DMA violation for its outlook to improve. This high-ranked Computer Software - Enterprise firm was featured in the October 2009 issue of CANSLIM.net News (read here).
>>> The latest Featured Stock Update with an annotated graph appeared on 10/20/2009. click here.
|
|
C
A
S
I |
News |
Chart |
SEC
View all notes Alert
me of new notes
Company
Profile
|
WNS
- NYSE
W N S Holdings Ltd Ads
DIVERSIFIED SERVICES - Business/Management Services
|
$14.16
|
-1.49
|
107,945
178% DAV
60,800
|
9/28/2009
(Date
Featured) |
$15.28
(Price
Featured) |
PP = $16.10 |
G |
| MB = $16.91 |
Most Recent Note - 10/26/2009 6:32:39 PM
G - Considerable loss today with above average, violating its 50 DMA line and recent chart lows, triggering technical sell signals. As noted last week, "distributional pressure raised concerns and technically negated its 10/16/09 breakout." Featured in yellow in the 9/28/09 mid-day report (read here). Quarterly earnings have been above the +25% guideline and its annual earnings history has been great, satisfying the C & A criteria. However, sales revenues growth has decelerated.
>>> The latest Featured Stock Update with an annotated graph appeared on 10/26/2009. click here.
|
|
C
A
S
I |
News |
Chart |
SEC
View all notes Alert
me of new notes
Company
Profile
|
|
|
|
THESE ARE NOT BUY RECOMMENDATIONS!
Comments contained in the body of this report are technical
opinions only. The material herein has been obtained
from sources believed to be reliable and accurate, however,
its accuracy and completeness cannot be guaranteed.
This site is not an investment advisor, hence it does
not endorse or recommend any securities or other investments.
Any recommendation contained in this report may not
be suitable for all investors and it is not to be deemed
an offer or solicitation on our part with respect to
the purchase or sale of any securities. All trademarks,
service marks and trade names appearing in this report
are the property of their respective owners, and are
likewise used for identification purposes only.
This report is a service available
only to active Paid Premium Members.
You may opt-out of receiving report notifications
at any time. Questions or comments may be submitted
by writing to Premium Membership Services 665 S.E. 10 Street, Suite 201 Deerfield Beach, FL 33441-5634 or by calling 1-800-965-8307
or 954-785-1121.
|
|
|


