You are not logged in.
This means you
CAN ONLY VIEW reports that were published prior to Monday, April 14, 2025.
You
MUST UPGRADE YOUR MEMBERSHIP if you want to see any current reports.
AFTER MARKET UPDATE - TUESDAY, OCTOBER 25TH, 2011
Previous After Market Report Next After Market Report >>>
|
|
|
|
DOW |
-207.00 |
11,706.62 |
-1.74% |
|
Volume |
1,008,405,740 |
+9% |
|
Volume |
1,733,296,320 |
-6% |
|
NASDAQ |
-61.02 |
2,638.42 |
-2.26% |
|
Advancers |
528 |
17% |
|
Advancers |
474 |
18% |
|
S&P 500 |
-25.14 |
1,229.05 |
-2.00% |
|
Decliners |
2,507 |
81% |
|
Decliners |
2,052 |
79% |
|
Russell 2000 |
-22.38 |
713.65 |
-3.04% |
|
52 Wk Highs |
39 |
|
|
52 Wk Highs |
28 |
|
|
S&P 600 |
-12.31 |
393.59 |
-3.03% |
|
52 Wk Lows |
8 |
|
|
52 Wk Lows |
29 |
|
|
 |
Major Averages Encounter Resistance Following Recent Rally
Kenneth J. Gruneisen - Passed the CAN SLIM® Master's Exam
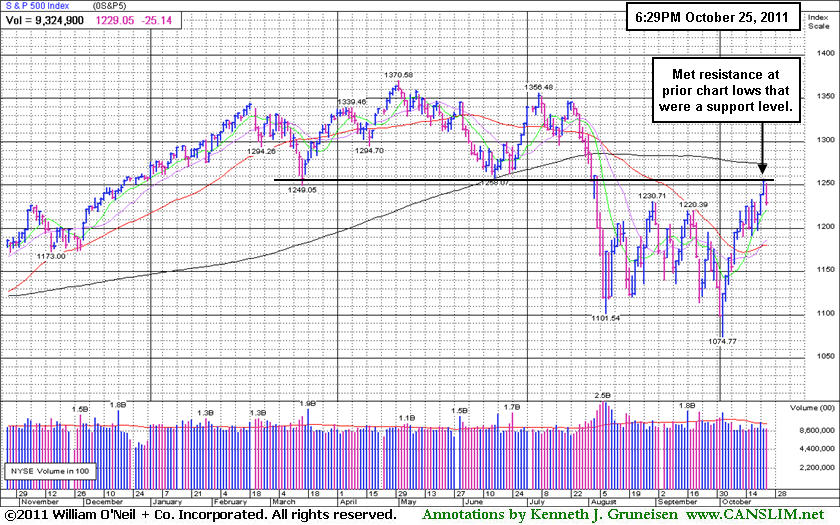
The major averages ended unanimously lower on Tuesday after disappointing earnings news and economic updates. The trading volume total reported on the NYSE was higher than the prior session, yet the volume total was lighter on the Nasdaq exchange versus the prior session. Breadth was clearly negative as declining issues beat advancers by more than 4-1 on the NYSE and on the Nasdaq exchange. New 52-week highs outnumbered new 52-week lows on the NYSE while they were evenly matched on the Nasdaq exchange. There were 16 high-ranked companies from the CANSLIM.net Leaders List that made new 52-week highs and appeared on the CANSLIM.net BreakOuts Page,down from the prior session total of 58 stocks. There were losses for 9of the 10 high-ranked companies currently included on the Featured Stocks Page.
Stocks snapped a three day winning streak. Second thoughts about a possible solution to Europe's debt crisis weighed on the major averages. Consumer confidence unexpectedly fell in October to its lowest level since March 2009. Meanwhile, in a separate report, home prices in the 20 largest major U.S. cities fell more than forecast suggesting the housing market remains an overhang on the economy. A meeting of European finance ministers was cancelled, however the summit of European Union leaders is still scheduled to meet on Wednesday.
Widespread weakness was led by financials as shares of T Rowe Price Group Inc (TROW -8.77%) and JP Morgan Chase & Co (JPM -3.12%) slumped. Stocks were weak from the onset due to several bellwethers earnings missing the mark. 3M (MMM -6.25%) slid after the maker of Post-It-Notes and Scotch tape cut its profit forecast. Economically sensitive stocks declined with United Parcel Services (UPS -2.14%). The package courier fell with the delivery of news that international shipments began to cool and its U.S expansion stalled. The online movie rental company Netflix Inc (NFLX -34.90%) tumbled after lowering its outlook for 2012 which prompted several analysts to downgrade the stock.
Amongst the sea of red, there were some ports in the storm. Quest Diagnostics (DGX +10.83%) gained and Unisys Corp (UIS +31.37%) advanced after posting better-than-expected earnings results and outlooks.
The October 2011 issue of our monthly newsletter CANSLIM.net News will be published soon with an informative review of current market conditions, leading groups, and best buy candidates. Via the Premium Member Homepage links to all prior reports and webcasts are always available.
PICTURED: The S&P 500 Index met resistance at prior chart lows that were a support level.
|
 Kenneth J. Gruneisen started out as a licensed stockbroker in August 1987, a couple of months prior to the historic stock market crash that took the Dow Jones Industrial Average down -22.6% in a single day. He has published daily fact-based fundamental and technical analysis on high-ranked stocks online for two decades. Through FACTBASEDINVESTING.COM, Kenneth provides educational articles, news, market commentary, and other information regarding proven investment systems that work in good times and bad.
Comments contained in the body of this report are technical opinions only and are not necessarily those of Gruneisen Growth Corp. The material herein has been obtained from sources believed to be reliable and accurate, however, its accuracy and completeness cannot be guaranteed. Our firm, employees, and customers may effect transactions, including transactions contrary to any recommendation herein, or have positions in the securities mentioned herein or options with respect thereto. Any recommendation contained in this report may not be suitable for all investors and it is not to be deemed an offer or solicitation on our part with respect to the purchase or sale of any securities. |
|
 |
Defensive Groups Rose Amid Mostly Negative Action
Kenneth J. Gruneisen - Passed the CAN SLIM® Master's Exam
Defensive groups were the standout gainers on Tuesday as the Healthcare Index ($HMO +0.88%) and Gold & Silver Index ($XAU +1.40%) posted gains on a widely negative session. Financial shares took a hard hit as the Broker/Dealer Index ($XBD -3.79%) and Bank Index ($BKX -3.17%) weighed negatively on the major averages. The Retail Index ($RLX -2.65%) fell, and the tech sector saw unanimous losses from the Internet Index ($IIX -3.12%), Networking Index ($NWX -2.30%), Biotechnology Index ($BTK -2.22%), and the Semiconductor Index ($SOX -1.87%). The energy-linked groups also ended lower as the Oil Services Index ($OSX -1.99%) and Integrated Oil Index ($XOI -1.56%) backpedaled.
Charts courtesy www.stockcharts.com
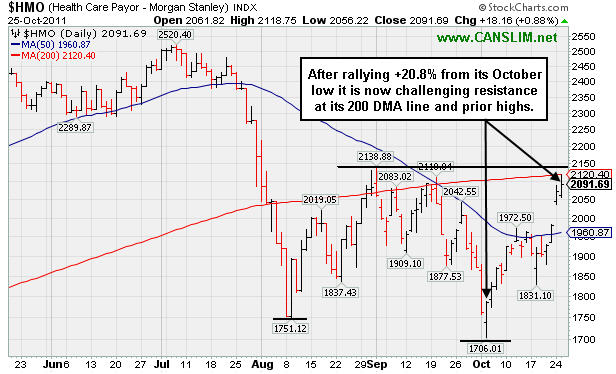
PICTURED: The Healthcare Index ($HMO +0.88%) is now challenging resistance at its 200-day moving average (DMA) line and prior highs after rallying +20.8% from its October low.
| Oil Services |
$OSX |
222.46 |
-4.52 |
-1.99% |
-9.24% |
| Healthcare |
$HMO |
2,091.69 |
+18.16 |
+0.88% |
+23.62% |
| Integrated Oil |
$XOI |
1,192.67 |
-18.90 |
-1.56% |
-1.69% |
| Semiconductor |
$SOX |
377.46 |
-7.19 |
-1.87% |
-8.34% |
| Networking |
$NWX |
229.85 |
-5.41 |
-2.30% |
-18.07% |
| Internet |
$IIX |
290.71 |
-9.36 |
-3.12% |
-5.53% |
| Broker/Dealer |
$XBD |
86.71 |
-3.42 |
-3.79% |
-28.64% |
| Retail |
$RLX |
539.37 |
-14.67 |
-2.65% |
+6.10% |
| Gold & Silver |
$XAU |
195.59 |
+2.70 |
+1.40% |
-13.68% |
| Bank |
$BKX |
38.78 |
-1.27 |
-3.17% |
-25.72% |
| Biotech |
$BTK |
1,160.85 |
-26.30 |
-2.22% |
-10.54% |
|
|
|
 |
Pullback Near Pivot Following Recent Technical Breakout
Kenneth J. Gruneisen - Passed the CAN SLIM® Master's Exam
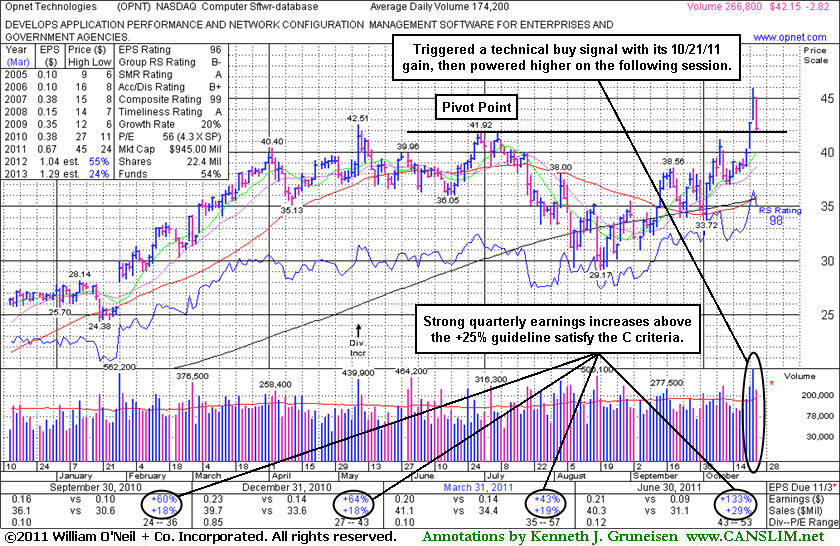
Opnet Technologies Inc (OPNT -$2.82 or -6.27% to $42.15) abruptly erased the prior gain, finishing near the session low today. Its loss on above average volume sent it to a close just above its pivot point and its color code was changed to yellow again. Its prior highs in the $41 area define near-term chart support to watch. Following its powerful breakout, any subsequent close below its old high close ($41.30 on 6/29/11) would raise concerns and might negate the technical buy signal it produced on 10/21/11. The breakout came ten days after it was first highlighted in yellow in the 10/11/11 mid-day report and in that evening's FSU section analysis with an annotated graph under the headline, "Weak Finish Reminds Investors to Resist the Urge to Get in 'Early'".
It finished today -8.2% off the prior session high, and the pullback serves as a reminder and an example to undisciplined investors, as those who may have chased it more than +5% above its pivot point could already be getting into trouble. Rule #1 in any sound investment strategy is to always avoid losing big. Disciplined fans of this fact-based system always sell if any stock falls more than -7% from their purchase price. Hanging on when a loss grows beyond -7% can lead to more painful and damaging financial consequences. Buying on pullbacks can sometimes work out, however historic studies have proven that investors' odds are typically best when buying a stock which is on the rise while it is as close to the pivot point as possible. Pyramiding is a smart tactic taught in the Certification which allows investors to carefully accumulate shares as the market action dictates. Sloppy buying efforts beyond the ideal range can lead to investors being forced to sell a healthy stock on an ordinary pullback. Approximately 40% of successful breakouts pull back and test support near prior highs before going on to produce much greater gains. so there is n
Recent quarters showed decent sales revenues growth and earnings above the +25% minimum guideline. Its annual earnings growth rate (A criteria) has been respectable since a previously noted downturn in FY '08. The lack of robust leadership (L criteria) in the Computer Software - Database group (current Group RS Rating 56) is somewhat discouraging. However, its Up/Down Volume Ratio of 1.8 suggests that it has recently been under heavy accumulation. Ownership by top-rated funds rose from 188 in Sep '10 to 257 in Jun '11, another reassuring sign concerning the I criteria. Return On Equity is reported at 12%, which is below the 17% guideline. However, management owns a 35% stake in its shares, keeping the directors motivated to maintain and build shareholder value.
|
|
|
Color Codes Explained :
Y - Better candidates highlighted by our
staff of experts.
G - Previously featured
in past reports as yellow but may no longer be buyable under the
guidelines.
***Last / Change / Volume data in this table is the closing quote data***
Symbol/Exchange
Company Name
Industry Group |
PRICE |
CHANGE
(%Change) |
Day High |
Volume
(% DAV)
(% 50 day avg vol) |
52 Wk Hi
% From Hi |
Featured
Date |
Price
Featured |
Pivot Featured |
|
Max Buy |
AAPL
-
NASDAQ
Apple Inc
COMPUTER HARDWARE - Personal Computers
|
$397.77
|
-8.00
-1.97% |
$406.55
|
15,368,068
70.01% of 50 DAV
50 DAV is 21,951,800
|
$426.70
-6.78%
|
9/16/2011
|
$399.14
|
PP = $404.60
|
|
MB = $424.83
|
 Most Recent Note - 10/25/2011 6:42:53 PM
G - Quietly consolidating above its 50 DMA line with volume totals cooling following distributional losses last week. It has not formed a sound base pattern and ownership by top-rated funds has fallen some.
>>> The latest Featured Stock Update with an annotated graph appeared on 10/20/2011. Click here.
View all notes |
Alert me of new notes |
CANSLIM.net Company Profile |
SEC |
Zacks Reports |
StockTalk |
News |
Chart |
Request a new note
C
A N
S L
I M


|
ADS
-
NYSE
Alliance Data Sys Corp
COMPUTER SOFTWARE and SERVICES - Information and Delivery Service
|
$98.97
|
-1.98
-1.96% |
$101.27
|
823,477
85.74% of 50 DAV
50 DAV is 960,400
|
$102.46
-3.41%
|
10/21/2011
|
$97.94
|
PP = $101.15
|
|
MB = $106.21
|
Most Recent Note - 10/25/2011 6:46:09 PM
Y - Small loss today on lighter volume after 3 consecutive gains with above average volume helped it rally to touch a new all-time high. Subsequent volume-driven gains above its pivot point may confirm a more convincing technical buy signal. Its 50 DMA line and recent chart lows define near-term support to watch on pullbacks.
>>> The latest Featured Stock Update with an annotated graph appeared on 10/21/2011. Click here.
View all notes |
Alert me of new notes |
CANSLIM.net Company Profile |
SEC |
Zacks Reports |
StockTalk |
News |
Chart |
Request a new note
C
A N
S L
I M
|
ALXN
-
NASDAQ
Alexion Pharmaceuticals
DRUGS - Drug Manufacturers - Other
|
$66.91
|
-2.65
-3.81% |
$69.95
|
958,999
61.23% of 50 DAV
50 DAV is 1,566,100
|
$70.42
-4.98%
|
9/15/2011
|
$63.20
|
PP = $60.81
|
|
MB = $63.85
|
Most Recent Note - 10/25/2011 6:49:40 PM
G - Loss today on light volume followed 3 consecutive gains with better but mostly average volume conviction. Support to watch includes prior resistance in the $59-60 area and its upwardly tilted 50 DMA line.
>>> The latest Featured Stock Update with an annotated graph appeared on 10/18/2011. Click here.
View all notes |
Alert me of new notes |
CANSLIM.net Company Profile |
SEC |
Zacks Reports |
StockTalk |
News |
Chart |
Request a new note
C
A N
S L
I M
|
CELG
-
NASDAQ
Celgene Corp
DRUGS - Drug Manufacturers - Major
|
$65.89
|
-1.97
-2.90% |
$67.88
|
3,734,120
98.51% of 50 DAV
50 DAV is 3,790,600
|
$68.25
-3.46%
|
9/16/2011
|
$61.21
|
PP = $62.59
|
|
MB = $65.72
|
Most Recent Note - 10/25/2011 6:52:01 PM
G - It remains extended from its prior base after a loss today on average volume led to a pullback near its "max buy" level.
>>> The latest Featured Stock Update with an annotated graph appeared on 10/14/2011. Click here.
View all notes |
Alert me of new notes |
CANSLIM.net Company Profile |
SEC |
Zacks Reports |
StockTalk |
News |
Chart |
Request a new note
C
A N
S L
I M
|
ISRG
-
NASDAQ
Intuitive Surgical Inc
HEALTH SERVICES - Medical Appliances and Equipment
|
$419.37
|
-3.02
-0.71% |
$428.20
|
357,174
78.66% of 50 DAV
50 DAV is 454,100
|
$429.44
-2.34%
|
10/19/2011
|
$424.69
|
PP = $415.29
|
|
MB = $436.05
|
Most Recent Note - 10/25/2011 6:53:31 PM
Y - Pulled back today on light volume, yet it remains above its pivot point. Holding its ground since its 10/19/11 gap up gain on heavy volume triggered a technical buy signal. Prior highs define important support to watch on pullbacks.
>>> The latest Featured Stock Update with an annotated graph appeared on 10/19/2011. Click here.
View all notes |
Alert me of new notes |
CANSLIM.net Company Profile |
SEC |
Zacks Reports |
StockTalk |
News |
Chart |
Request a new note
C
A N
S L
I M
|
Symbol/Exchange
Company Name
Industry Group |
PRICE |
CHANGE
(%Change) |
Day High |
Volume
(% DAV)
(% 50 day avg vol) |
52 Wk Hi
% From Hi |
Featured
Date |
Price
Featured |
Pivot Featured |
|
Max Buy |
LABL
-
NASDAQ
Multi Color Corp
CONSUMER NON-DURABLES - Packaging and Containers
|
$26.22
|
-0.95
-3.50% |
$27.10
|
19,950
35.82% of 50 DAV
50 DAV is 55,700
|
$28.00
-6.36%
|
10/17/2011
|
$27.81
|
PP = $28.10
|
|
MB = $29.51
|
Most Recent Note - 10/25/2011 6:56:22 PM
Y - Volume totals continue to cool and it is now perched -6.4% off its 52-week high. Very little overhead supply remains to act as resistance. Subsequent volume-driven gains into new high ground may trigger a technical buy signal. Last week's low near its 50 DMA line defines near-term support to watch where any violation would raise concerns.
>>> The latest Featured Stock Update with an annotated graph appeared on 10/17/2011. Click here.
View all notes |
Alert me of new notes |
CANSLIM.net Company Profile |
SEC |
Zacks Reports |
StockTalk |
News |
Chart |
Request a new note
C
A N
S L
I M
|
MG
-
NYSE
Mistras Group Inc
DIVERSIFIED SERVICES - Bulding and Faci;ity Management Services
|
$22.29
|
-0.20
-0.89% |
$22.80
|
176,110
80.23% of 50 DAV
50 DAV is 219,500
|
$23.51
-5.19%
|
8/10/2011
|
$17.89
|
PP = $17.58
|
|
MB = $18.46
|
Most Recent Note - 10/25/2011 6:57:24 PM
G - Still holding its ground stubbornly near its all-time high today, extended from its prior base pattern. Prior highs in the $20-21 area define initial chart support to watch above its 50 DMA line.
>>> The latest Featured Stock Update with an annotated graph appeared on 10/12/2011. Click here.
View all notes |
Alert me of new notes |
CANSLIM.net Company Profile |
SEC |
Zacks Reports |
StockTalk |
News |
Chart |
Request a new note
C
A N
S L
I M
|
OPNT
-
NASDAQ
Opnet Technologies
INTERNET - Internet Software and Services
|
$42.15
|
-2.82
-6.27% |
$45.10
|
267,877
153.78% of 50 DAV
50 DAV is 174,200
|
$45.92
-8.21%
|
10/11/2011
|
$38.45
|
PP = $42.02
|
|
MB = $44.12
|
Most Recent Note - 10/25/2011 7:01:40 PM
Y - Abruptly reversed and erased the prior gain, finishing near the session low today with a loss on above average volume sending it to a close just above its pivot point. Its color code is changed to yellow, meanwhile its prior highs in the $41 area define near-term chart support to watch. Due to report earnings on Wednesday, November 9th.
>>> The latest Featured Stock Update with an annotated graph appeared on 10/25/2011. Click here.
View all notes |
Alert me of new notes |
CANSLIM.net Company Profile |
SEC |
Zacks Reports |
StockTalk |
News |
Chart |
Request a new note
C
A N
S L
I M
|
UA
-
NYSE
Under Armour Inc Cl A
CONSUMER NON-DURABLES - Textile - Apparel Clothing
|
$80.15
|
+3.82
5.00% |
$83.47
|
5,924,117
438.60% of 50 DAV
50 DAV is 1,350,700
|
$82.95
-3.38%
|
10/25/2011
|
$82.43
|
PP = $80.80
|
|
MB = $84.84
|
Most Recent Note - 10/25/2011 7:07:26 PM
Y - Touched new 52-week and all-time highs with above average volume behind a considerable gain, however it finished the session below the new pivot point cited when highlighted in yellow in the mid-day report earlier today. Reported earnings +29% on +42% sales revenues for the quarter ended September 30, 2011 versus the year ago period. The new pivot point cited was based upon its 9/16/11 high after rallying clear of all overhead supply following a reverse-head-and-shoulders base pattern formed over the past 6 months. It had slumped below its 200 DMA during its deep consolidation after it was dropped from the Featured Stocks list on 8/02/11.

>>> The latest Featured Stock Update with an annotated graph appeared on 7/26/2011. Click here.
View all notes |
Alert me of new notes |
CANSLIM.net Company Profile |
SEC |
Zacks Reports |
StockTalk |
News |
Chart |
Request a new note
C
A N
S L
I M
|
V
-
NYSE
Visa Inc Cl A
DIVERSIFIED SERVICES - Business/Management Services
|
$90.68
|
-3.53
-3.75% |
$93.63
|
4,202,953
78.54% of 50 DAV
50 DAV is 5,351,300
|
$94.75
-4.30%
|
10/24/2011
|
$94.21
|
PP = $94.85
|
|
MB = $99.59
|
Most Recent Note - 10/25/2011 7:09:18 PM
Y - Down today with higher but still below average volume. A new pivot point was cited based on its 52-week high plus 10 cents and its color code was changed to yellow. Subsequent volume-driven gains may trigger a new technical buy signal. See the latest FSU analysis for more details and a new annotated weekly graph illustrating the latest base.
>>> The latest Featured Stock Update with an annotated graph appeared on 10/24/2011. Click here.
View all notes |
Alert me of new notes |
CANSLIM.net Company Profile |
SEC |
Zacks Reports |
StockTalk |
News |
Chart |
Request a new note
C
A N
S L
I M
|
Symbol/Exchange
Company Name
Industry Group |
PRICE |
CHANGE
(%Change) |
Day High |
Volume
(% DAV)
(% 50 day avg vol) |
52 Wk Hi
% From Hi |
Featured
Date |
Price
Featured |
Pivot Featured |
|
Max Buy |
|
|
|
THESE ARE NOT BUY RECOMMENDATIONS!
Comments contained in the body of this report are technical
opinions only. The material herein has been obtained
from sources believed to be reliable and accurate, however,
its accuracy and completeness cannot be guaranteed.
This site is not an investment advisor, hence it does
not endorse or recommend any securities or other investments.
Any recommendation contained in this report may not
be suitable for all investors and it is not to be deemed
an offer or solicitation on our part with respect to
the purchase or sale of any securities. All trademarks,
service marks and trade names appearing in this report
are the property of their respective owners, and are
likewise used for identification purposes only.
This report is a service available
only to active Paid Premium Members.
You may opt-out of receiving report notifications
at any time. Questions or comments may be submitted
by writing to Premium Membership Services 665 S.E. 10 Street, Suite 201 Deerfield Beach, FL 33441-5634 or by calling 1-800-965-8307
or 954-785-1121.
|
|
|

