You are not logged in.
This means
you CAN ONLY VIEW reports that were published prior to Thursday, March 27, 2025.
You
MUST UPGRADE YOUR MEMBERSHIP if you want to see any current reports.
 MIDDAY BREAKOUTS REPORT - WEDNESDAY, OCTOBER 26TH, 2011 MIDDAY BREAKOUTS REPORT - WEDNESDAY, OCTOBER 26TH, 2011
Previous Mid Day Report Next Mid Day Report >>>
|
|
DOW 11733.53 26.91 (0.23%) | NASDAQ 2641.58 3.16 (0.12%) | S&P 500 1227.18 -1.87 (-0.15%)
|
Time of Screening :
10/26/2011 12:07:04 PM Report Released :
10/26/2011 2:01:23 PM
Price is:
Above 52W High and Less Than 52W High
but within 10% of the 52 Week High
Volume Is:
At least 57.5% of 50 Day Average at
the time of the screening.
More details about this report...
At around
mid-way through each trading day we run
a screen against our database of
high-ranked stocks, searching for
possible buy candidates that are trading
at or near their 52-week high on above
average volume. The results of that
screen are split into the two sections
you see below. The first, titled
"TODAY's FEATURED STOCKS" shows stocks
that our experts have recently
identified as among the strongest candidates to
consider. Stocks highlighted in yellow
are the most timely and noteworthy, so
particular attention and prompt action
may be appropriate. The second section,
titled "TODAY's BREAKOUT SCREEN" shows
the remainder of stocks meeting today's
screen parameters. Our experts have
reviewed and included notes on these
stocks as well, but found that they may
not match up as favorably.
|
|
Y - Today's strongest
candidates
highlighted
by our staff
of experts.
|
|
G - Previously featured in
this report as yellow and
now may no longer be buyable
under the guidelines.
|
|
|
Symbol/Exchange
Company Name
Industry Group |
PRICE |
CHANGE
(%Change) |
Day High |
Volume
(% DAV)
(50 DAV) |
52 Wk Hi
% From Hi |
Date
Featured |
Price
Featured |
Pivot Point |
|
Max Buy |
GNC
- NYSE
G N C Holdings Inc
|
$24.60
|
-0.50
-1.99%
|
$25.22
|
11,279,893
1,476.81% of 50 DAV
50 DAV is 763,800
|
$26.48
-7.10%
|
10/26/2011 |
$24.60
|
PP = $24.80
MB = $26.04 |
Most Recent Note - 10/26/2011 1:09:27 PM
Y - Perched near its 52-week high after volume-driven gains helped it rally from a "double bottom" base pattern. Following the close of the prior session it priced a Secondary Offering. Color code is changed to yellow with pivot point based on its 9/01/11 high. The 10/24/11 gain with more than 4 times average volume triggered a technical buy signal. No resistance remains due to overhead supply. Strong quarterly and annual earnings history satisfies the C and A criteria.
There are no Featured Stock Updates™ available for this stock at this time. You may request one by clicking the Request a New Note link below
|
|
View all notes |
Alert me of new notes |
Company Profile |
SEC |
News |
Chart | C
A N
S L
I M
|
OPNT
-
|
$42.05
|
-0.10
-0.24%
|
$42.75
|
108,446
60.75% of 50 DAV
50 DAV is 178,500
|
$45.92
-8.43%
|
10/11/2011 |
$38.45
|
PP = $42.02
MB = $44.12 |
Most Recent Note - 10/26/2011 1:30:01 PM
Y - Inching lower today but slumping under its pivot point, raising some concerns. Color code was changed to yellow again on the pullback following its powerful technical breakout. More damaging losses with higher volume may raise greater concerns, meanwhile, prior highs in the $41 area define near-term chart support to watch. Due to report earnings on Wednesday, November 9th.
>>> The latest Featured Stock Update with an annotated graph appeared on 10/25/2011. Click here.
|
|
View all notes |
Alert me of new notes |
Company Profile |
SEC |
News |
Chart | C
A N
S L
I M
|
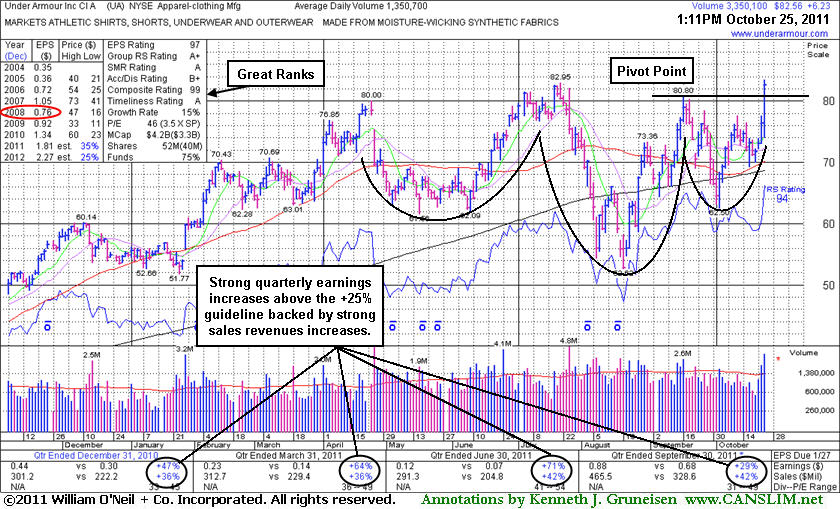
UA
- NYSE
Under Armour Inc Cl A
|
$81.14
|
+0.99
1.24%
|
$83.00
|
1,186,719
81.99% of 50 DAV
50 DAV is 1,447,400
|
$83.47
-2.79%
|
10/25/2011 |
$82.43
|
PP = $80.80
MB = $84.84 |
Most Recent Note - 10/26/2011 2:00:40 PM
Y - On track for a 5th consecutive gain today with volume again running at an above average pace while it is poised for a best-ever close. Touched new 52-week and all-time highs with above average volume behind a considerable gain, however it finished the prior session below the new pivot point cited when highlighted in yellow in the 10/25/11 mid-day report. Reported earnings +29% on +42% sales revenues for the quarter ended September 30, 2011 versus the year ago period. The new pivot point cited was based upon its 9/16/11 high after rallying clear of all overhead supply following a reverse-head-and-shoulders base pattern formed over the past 6 months. It had slumped below its 200 DMA during its deep consolidation after it was dropped from the Featured Stocks list on 8/02/11.
>>> The latest Featured Stock Update with an annotated graph appeared on 7/26/2011. Click here.
|
|
View all notes |
Alert me of new notes |
Company Profile |
SEC |
News |
Chart | C
A N
S L
I M
|
|
 |
Symbol - Exchange - Industry Group
Company Name |
Last |
Chg |
Day
High |
52 WK Hi |
% From Hi |
Volume
% DAV |
DAV |
AAN
- NYSE - SPECIALTY RETAIL - Specialty Retail, Other
Aaron's Inc
|
$26.55 |
+0.20
0.76%
|
$26.72
|
$29.34
|
-9.51% |
353,264
65.83%
|
536,600
|
Most Recent Note for AAN - 10/26/2011 12:42:19 PM
Gapped down on the prior session and holding its ground today while testing support near its 50 and 200 DMA lines, abruptly retreating after challenging its 52-week high. Reported earnings +13% on +7% sales revenues for the quarter ended September 30, 2011 versus the year ago period. Prior mid-day reports noted - "Sales and earnings history has been below guidelines of the fact based system."
|
|
View all notes |
Alert me of new notes |
Company Profile |
SEC |
News |
Chart | C
A N
S L
I M
|
AFSI
- NASDAQ - INSURANCE - Property &; Casualty Insurance
Amtrust Financial Svcs
|
$25.08 |
-0.12
-0.48%
|
$25.59
|
$25.63
|
-2.15% |
146,521
60.70%
|
241,400
|
Most Recent Note for AFSI - 10/26/2011 12:43:55 PM
Holding its ground since the previously noted 10/24/11 gain helped it rise from an 8-week cup shaped base during which it found support well above its 200 DMA line. Due to report earnings on November 1st, it last reported earnings +41% on +31% sales revenues for the quarter ended June 30, 2011 versus the year ago period, and prior mid-day reports noted - "Earnings increase of +46% for the Mar '11 quarter was the first comparison in more than 2 years with a better than +25% increase."
|
|
View all notes |
Alert me of new notes |
Company Profile |
SEC |
News |
Chart | C
A N
S L
I M
|
AGN
- NYSE - DRUGS - Drug Manufacturers - Other
Allergan Inc
|
$83.73 |
-3.23
-3.71%
|
$86.34
|
$89.25
|
-6.18% |
2,196,793
102.89%
|
2,135,100
|
Most Recent Note for AGN - 10/26/2011 12:15:17 PM
Gapped down today, abruptly slumping below prior chart highs after reporting earnings +18% on +10% sales revenues for the quarter ended September 30, 2011 versus the year ago period. The 10/21/11 mid-day report noted the pending earnings news as it wedged to new 52-week highs without great volume conviction, and added - "Prior quarterly comparisons have been below the +25% guideline. Rebounded impressively after undercutting its 200 DMA line during its latest consolidation."
|
|
View all notes |
Alert me of new notes |
Company Profile |
SEC |
News |
Chart | C
A N
S L
I M
|
BIIB
- NASDAQ - DRUGS - Biotechnology
Biogen Idec Inc
|
$118.37 |
+11.50
10.76%
|
$119.75
|
$119.75
|
-1.15% |
3,161,671
159.59%
|
1,981,100
|
Most Recent Note for BIIB - 10/26/2011 12:46:39 PM
Gapped up today after encouraging headlines including an analyst upgrade, hitting a new 52-week high. Prior mid-day reports noted - "Earnings and sales growth history is below the guidelines of the fact-based investment system, still. It survived but failed to impress since last noted in October 2007 mid-day reports after a huge gap up on news if had interested buyers including Carl Icahn."
|
|
View all notes |
Alert me of new notes |
Company Profile |
SEC |
News |
Chart | C
A N
S L
I M
|
BJRI
- NASDAQ - LEISURE - Restaurants
B J S Restaurants Inc
|
$51.92 |
-0.43
-0.82%
|
$53.85
|
$56.64
|
-8.34% |
214,515
66.87%
|
320,800
|
Most Recent Note for BJRI - 10/26/2011 12:50:00 PM
Reported earnings +20% on +18% sales revenues for the quarter ended September 30, 2011 versus the year ago period. Rebounding toward its all-time high with recent volume driven gains. Found support near its 200 DMA line during its consolidation since last noted in the 7/05/11 mid-day report - "The restaurant company's quarterly earnings show recent acceleration, but its annual earnings (A criteria) history comes in below the investment system's strict guidelines."
|
|
View all notes |
Alert me of new notes |
Company Profile |
SEC |
News |
Chart | C
A N
S L
I M
|
BKI
- NYSE - Computer Sftwr-Financial
Black Knight Inc
|
$27.97 |
-0.68
-2.37%
|
$29.40
|
$29.45
|
-5.03% |
303,508
78.12%
|
388,500
|
Most Recent Note for BKI - 10/26/2011 12:52:26 PM
No overhead supply remains to act as resistance, yet it is still perched within close striking distance of its all-time high while building an orderly base. Reported earnings +118% on +19% sales revenues for the quarter ended September 30, 2011 versus the year ago period. Recent quarterly comparisons showed strong earnings increases. Prior mid-day reports noted - "Insider buying reported in late 2010 was noted after clearing its 2007 high as a very reassuring sign, however its erratic annual earnings (A criteria) history falls short of the investment system's guidelines."
|
|
View all notes |
Alert me of new notes |
Company Profile |
SEC |
News |
Chart | C
A N
S L
I M
|
CHKP
- NASDAQ - COMPUTER SOFTWARE & SERVICES - Security Software & Services
Check Point Sftware Tech
|
$58.55 |
+0.60
1.03%
|
$58.81
|
$61.46
|
-4.74% |
1,599,523
80.96%
|
1,975,700
|
Most Recent Note for CHKP - 10/26/2011 12:55:26 PM
Holding its ground near its 52-week high since last noted in the 10/18/11 mid-day report. Reported earnings +14% on +13% sales revenues for the quarter ended September 30, 2011 versus the year ago period. Prior mid-day reports noted - "This Israel-based Computer Software - Security firm has earned high ranks and has a history of steady sales revenues and earnings increases (not showing acceleration) below the fact-based investment system's minimum guidelines."
|
|
View all notes |
Alert me of new notes |
Company Profile |
SEC |
News |
Chart | C
A N
S L
I M
|
EGAN
- NASDAQ - COMPUTER SOFTWARE & SERVICES - Technical & Sytems Software
Egain Corporation
|
$7.66 |
-0.19
-2.42%
|
$8.00
|
$8.00
|
-4.25% |
82,349
135.22%
|
60,900
|
Most Recent Note for EGAN - 10/26/2011 12:56:16 PM
The 10/25/11 mid-day report noted - "Extended from any sound base now after rallying from lows near $1 in January, steadily finding support near its 50 DMA line during its ascent. The Mar and Jun '11 quarterly comparisons showed improving sales revenues and earnings versus losses in the year-ago periods. Prior quarterly and annual earnings (C and A criteria) history has been below the guidelines of the fact-based investment system."
|
|
View all notes |
Alert me of new notes |
Company Profile |
SEC |
News |
Chart | C
A N
S L
I M
|
EPD
- NYSE - ENERGY - Independent Oil & Gas
Enterprise Products Ptnr
|
$45.11 |
+0.58
1.30%
|
$45.27
|
$45.27
|
-0.35% |
828,647
60.16%
|
1,377,400
|
Most Recent Note for EPD - 10/26/2011 1:01:46 PM
Hit a new 52-week high today after a small gap up, on track for its 7th consecutive small gain while inching above previously stubborn resistance in the $43-44 area. Due to report earnings on Wednesday, November 2nd. Recent quarterly comparisons showed sales and earnings improvement, but as noted in prior mid-day reports - "Annual and quarterly earnings history are below guidelines for this MLP, like several others in the Oil and Gas - Transportation/Pipeline industry group noted in recent mid-day reports."
|
|
View all notes |
Alert me of new notes |
Company Profile |
SEC |
News |
Chart | C
A N
S L
I M
|
GTLS
- NASDAQ - ENERGY - Oil &; Gas Equipment &; Services
Chart Industries Inc
|
$56.28 |
+3.19
6.01%
|
$57.12
|
$62.15
|
-9.44% |
556,767
93.94%
|
592,700
|
Most Recent Note for GTLS - 10/26/2011 1:13:26 PM
Rebounding near prior chart highs after its consolidation included a slump under its 200 DMA line since last noted on 7/27/11. It had touched a new all-time high as the 7/27/11 mid-day report noted - "It went through a deep consolidation after dropped from the Featured Stocks list on 9/05/08. It has rebounded impressively, especially since its Nov '10 breakout, and it may be an interesting turnaround story now, however the downturn in FY '09 and FY '10 earnings is a flaw with respect to the A criteria of the fact-based investment system. Its small supply of shares outstanding (the S criteria) can contribute to greater volatility, especially if institutional investors rush in or out."
|
|
View all notes |
Alert me of new notes |
Company Profile |
SEC |
News |
Chart | C
A N
S L
I M
|
HEP
- NYSE - ENERGY - Oil & Gas Pipelines
Holly Energy Partners Lp
|
$55.56 |
+0.69
1.26%
|
$55.66
|
$61.05
|
-8.99% |
30,183
97.68%
|
30,900
|
Most Recent Note for HEP - 10/26/2011 1:14:18 PM
Wedging higher since last noted in the 10/17/11 mid-day report - "On track for a 6th consecutive gain today, this MLP has rebounded from trading below its 50 and 200 DMA lines in recent weeks. Recent quarters showed impressive sales and earnings increases but its prior comparisons and annual earnings history (A criteria) are below guidelines."
|
|
View all notes |
Alert me of new notes |
Company Profile |
SEC |
News |
Chart | C
A N
S L
I M
|
KMI
- NYSE - UTILITIES - Gas Utilities
Kinder Morgan Inc
|
$29.95 |
-0.16
-0.53%
|
$30.50
|
$32.14
|
-6.81% |
1,709,936
96.61%
|
1,769,900
|
Most Recent Note for KMI - 10/26/2011 1:17:17 PM
The 10/25/11 mid-day report noted - "Lack of sales revenues growth is a concern even while earnings increases were strong in the Jun and Sep '11 quarterly comparisons versus the year ago periods. Annual earnings (A criteria) history has been up and down."
|
|
View all notes |
Alert me of new notes |
Company Profile |
SEC |
News |
Chart | C
A N
S L
I M
|
MCF
- AMEX - ENERGY - Independent Oil & Gas
Contango Oil & Gas Co
|
$62.98 |
+1.02
1.64%
|
$63.49
|
$67.99
|
-7.38% |
116,061
91.53%
|
126,800
|
Most Recent Note for MCF - 10/26/2011 1:18:57 PM
Erratic earnings history is not a good match with the fact-based investment system's guidelines.
|
|
View all notes |
Alert me of new notes |
Company Profile |
SEC |
News |
Chart | C
A N
S L
I M
|
NEM
- NYSE - METALS & MINING - Gold
Newmont Mining Corp
|
$66.16 |
+1.32
2.04%
|
$66.60
|
$71.25
|
-7.14% |
4,956,319
63.57%
|
7,796,100
|
Most Recent Note for NEM - 10/26/2011 1:21:25 PM
Found support near its 50 DMA line during its consolidation since last noted in the 9/20/11 mid-day report while blasting to a new all-time high - "Widespread strength and leadership (L criteria) in the Mining - Gold/Silver/Gems group has been a reassuring sign, however recent mid-day reports have repeatedly noted - 'Earnings history over the past 3 quarterly comparisons is not a match with the fact-based investment system's guidelines. Rallying within close striking distance of its 2010 high ($65.50) level that may act as resistance. It sputtered below its 200 DMA line for several months while slumping after it was dropped from the Featured Stocks list on 11/16/10.'"
|
|
View all notes |
Alert me of new notes |
Company Profile |
SEC |
News |
Chart | C
A N
S L
I M
|
OKS
- NYSE - ENERGY - Oil &; Gas Pipelines
Oneok Partners Lp
|
$49.90 |
+0.11
0.22%
|
$50.59
|
$50.59
|
-1.36% |
161,255
63.51%
|
253,900
|
Most Recent Note for OKS - 10/26/2011 1:24:58 PM
A spurt of small gains with above average volume has helped it inch to new 52-week highs. Due to report earnings after the close on Tuesday, November 1st. Last noted in the 10/04/11 mid-day report - "This MLP's earnings history has been below the guidelines of the fact-based system."
|
|
View all notes |
Alert me of new notes |
Company Profile |
SEC |
News |
Chart | C
A N
S L
I M
|
PNRA
- NASDAQ - LEISURE - Specialty Eateries
Panera Bread Co Cl A
|
$133.79 |
+18.07
15.62%
|
$138.58
|
$138.58
|
-3.46% |
1,889,318
314.68%
|
600,400
|
Most Recent Note for PNRA - 10/26/2011 1:41:45 PM
Considerable gap up gain today, rising straight-up-from-the-bottom of a 15-week cup shaped base, hitting new 52-week and all-time highs. Reported earnings +29% on +22% sales revenues for the quarter ended September 30, 2011 versus the year ago period. Its annual earnings (A criteria) history has shown steady growth since a small dip in FY '07 earnings. Sales revenues increases showed modest acceleration over the Mar, Jun, and Sep quarterly comparisons versus the year-ago period and earnings increases have been above the +25% guideline with respect to the C criteria. The stock is somewhat heavily owned (percentage-wise) by funds relative to its management's small 5% reported ownership. Top-rated funds owning an interest decreased from 573 in Mar '11 to 549 in Sep '11, which is not good news concerning the I criteria
|
|
View all notes |
Alert me of new notes |
Company Profile |
SEC |
News |
Chart | C
A N
S L
I M
|
QCOR
- NASDAQ - DRUGS - Biotechnology
Questcor Pharmaceuticals
|
$40.53 |
+7.23
21.71%
|
$41.14
|
$41.14
|
-1.48% |
2,662,492
225.44%
|
1,181,000
|
Most Recent Note for QCOR - 10/26/2011 1:50:32 PM
Gapped up today, hitting a new 52-week high after reporting earnings +95% on +91% sales revenues for the quarter ended September 30, 2011 versus the year ago period. Its past 3 quarterly comparisons (Mar, Jun, Sep '11) show impressive sequential acceleration in its sales revenues and earnings increases, satisfying the C criteria of the fact-based system. The downturn in its FY '09 earnings is a flaw concerning the A criteria. It is trading +77% above its 200 DMA line, a sign that it is extended from a sound base after the considerable rally from its February 2011 lows in the $11 area.
|
|
View all notes |
Alert me of new notes |
Company Profile |
SEC |
News |
Chart | C
A N
S L
I M
|
SXL
- NYSE - ENERGY - Oil & Gas Pipelines
Sunoco Logistics Ptnr Lp
|
$96.04 |
+1.05
1.11%
|
$98.82
|
$100.00
|
-3.96% |
63,535
76.46%
|
83,100
|
Most Recent Note for SXL - 10/26/2011 1:53:05 PM
This MLP is holding its ground since reaching a new 52-week high then reversing into the red when noted in the 10/24/11 mid-day report. It rebounded from below its 50 and 200 DMA lines and steadily climbed since noted in the 9/06/11 mid-day report - "Quarterly and annual earnings growth (C and A criteria) have been below the fact-based investment system's guidelines."
|
|
View all notes |
Alert me of new notes |
Company Profile |
SEC |
News |
Chart | C
A N
S L
I M
|
TJX
- NYSE - RETAIL - Discount, Variety Stores
T J X Cos Inc
|
$57.94 |
-1.17
-1.98%
|
$58.74
|
$60.00
|
-3.43% |
2,333,419
62.62%
|
3,726,200
|
Most Recent Note for TJX - 10/26/2011 1:57:30 PM
Pulling back since quietly touching a new 52-week high this week with modest gains marked by below average volume. Found support near its 50 DMA line during the consolidation after it cleared a previously noted orderly base during which it found support above its 200 DMA line. The 9/22/11 mid-day report noted - "Quarterly and annual earnings history has been below the fact-based investment system's guidelines."
|
|
View all notes |
Alert me of new notes |
Company Profile |
SEC |
News |
Chart | C
A N
S L
I M
|
|
|
|
THESE ARE NOT BUY RECOMMENDATIONS!
Comments contained in the body of this report are technical
opinions only. The material herein has been obtained
from sources believed to be reliable and accurate, however,
its accuracy and completeness cannot be guaranteed.
We are not an investment advisor, hence it does
not endorse or recommend any securities or other investments.
Any recommendation contained in this report may not
be suitable for all investors and it is not to be deemed
an offer or solicitation on our part with respect to
the purchase or sale of any securities. All trademarks,
service marks and trade names appearing in this report
are the property of their respective owners, and are
likewise used for identification purposes only.
This report is a service available
only to active Paid Premium Members.
You may opt-out of receiving report notifications
at any time. Questions or comments may be submitted
by writing to FactBasedInvesting.com c/o Premium
Member Services 665 S.E. 10 Street, Suite 201
Deerfield Beach, FL 33441-5634 or by calling 954-785-1121.
We appreciate any feedback
members may wish to send via the inquiry form
here.
|
|
|


