You are not logged in.
This means you
CAN ONLY VIEW reports that were published prior to Monday, April 14, 2025.
You
MUST UPGRADE YOUR MEMBERSHIP if you want to see any current reports.
AFTER MARKET UPDATE - FRIDAY, OCTOBER 24TH, 2014
Previous After Market Report Next After Market Report >>>
|
|
|
|
DOW |
+127.51 |
16,805.41 |
+0.76% |
|
Volume |
699,877,110 |
-12% |
|
Volume |
1,632,034,670 |
-8% |
|
NASDAQ |
+30.93 |
4,483.72 |
+0.69% |
|
Advancers |
1,913 |
60% |
|
Advancers |
1,561 |
55% |
|
S&P 500 |
+13.76 |
1,964.58 |
+0.71% |
|
Decliners |
1,159 |
36% |
|
Decliners |
1,161 |
41% |
|
Russell 2000 |
+2.34 |
1,118.82 |
+0.21% |
|
52 Wk Highs |
86 |
|
|
52 Wk Highs |
49 |
|
|
S&P 600 |
+1.15 |
645.80 |
+0.18% |
|
52 Wk Lows |
23 |
|
|
52 Wk Lows |
46 |
|
|
 |
Major Averages Posted Solid Weekly Gains as Rally Resumed
Kenneth J. Gruneisen - Passed the CAN SLIM® Master's Exam
The Dow posted a weekly gain of +2.6%, the S&P 500 jumped +4.1%, and the NASDAQ rallied +5.3%. Behind Friday's gains the volume totals were reported lighter than the prior session totals. Breadth was positive as advancers led decliners by a 3-2 margin on the NYSE and 5-4 on the Nasdaq exchange. There were 35 high-ranked companies from the CANSLIM.net Leaders List that made new 52-week highs and appeared on the CANSLIM.net BreakOuts Page, down from the prior session total of 42 stocks. New 52-week highs outnumbered new 52-week lows on the NYSE and on the Nasdaq exchange. There were gains for 6 of the 8 high-ranked companies currently on the Featured Stocks Page, a list which gained a few new companies this week while broader market conditions improved. Disciplined investors know that new buying efforts may be made under the fact-based investment system only in stocks meeting all key criteria.
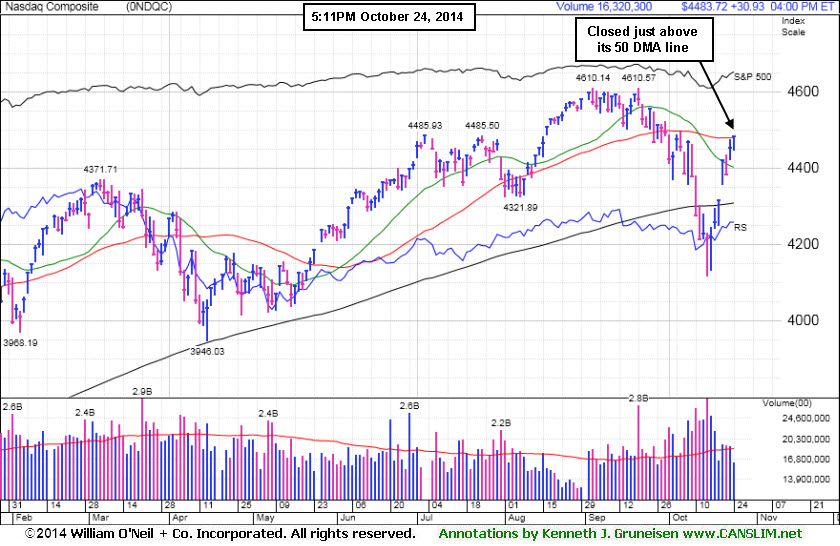
PICTURED: The Nasdaq Composite Index was 31 points higher to 4,483, closing the week above its 50-day moving average (DMA) line, which helped its technical stance.
Stocks closed out the week on a positive note. The Dow gained 127 points to 16,805. The S&P 500 climbed 14 points to 1,964. Overall, the major averages snapped a four-week losing streak.
The market advanced as investors focused on positive corporate earnings. At the close eight of the 10 sectors in the S&P 500 were in positive territory. Health care was up the most. Bristol-Myers Squibb (BMY +2.2%) rose following a positive quarterly earnings announcement. Tech was another notable gainer. Shares of Microsoft (MSFT +2.5%) advanced after besting analyst profit estimates. In consumer discretionary Amazon.com (AMZN -8.3%) fell as it lowered forward guidance but delivered a positive earnings surprise. Energy stocks were also lower as the price of WTI crude continued to fall. Chevron (CVX -0.2%) edged lower. On the economic front a measure of new home sales in September gained +0.2%, beating estimates for a -6.8% decline.
Treasuries were little changed. The benchmark 10-year note climbed 3/32 to yield 2.26%. The 30-year bond advanced 6/32 to yield 3.04%. In commodities WTI crude fell on the NYMEX by -1% to $81.26.
Large gains on Tuesday backed by higher volume totals while leadership (stocks hitting new 52-week highs) expanded met the definition of a "follow-through day" confirming a new uptrend for the market (M criteria). The S&P 500 Index, Nasdaq Composite Index, and the Dow Jones Industrial Average have collectively rebounded above their respective 200-day moving average (DMA) lines, technically putting the market in a "healthier" stance.
The CANSLIM.net Featured Stocks Page shows the most action-worthy candidates and their latest notes and a Headline Link directs members to the latest detailed analysis with data-packed graphs annotated by a Certified expert along with links to additional resources. The Premium Member Homepage includes "dynamic archives" to all prior pay reports published.
|
 Kenneth J. Gruneisen started out as a licensed stockbroker in August 1987, a couple of months prior to the historic stock market crash that took the Dow Jones Industrial Average down -22.6% in a single day. He has published daily fact-based fundamental and technical analysis on high-ranked stocks online for two decades. Through FACTBASEDINVESTING.COM, Kenneth provides educational articles, news, market commentary, and other information regarding proven investment systems that work in good times and bad.
Comments contained in the body of this report are technical opinions only and are not necessarily those of Gruneisen Growth Corp. The material herein has been obtained from sources believed to be reliable and accurate, however, its accuracy and completeness cannot be guaranteed. Our firm, employees, and customers may effect transactions, including transactions contrary to any recommendation herein, or have positions in the securities mentioned herein or options with respect thereto. Any recommendation contained in this report may not be suitable for all investors and it is not to be deemed an offer or solicitation on our part with respect to the purchase or sale of any securities. |
|
 |
Financial and Tech Indexes Rose
Kenneth J. Gruneisen - Passed the CAN SLIM® Master's Exam
The Semiconductor Index ($SOX +1.06%) and the Biotechnology Index ($BTK +1.26%) rose while the Networking Index ($NWX -0.70%) pulled back. Financial shares helped underpin the major averages' advance as the Broker/Dealer Index ($XBD +0.66%) and the Bank Index ($BKX +0.90%) rose. Meanwhile, the Retail Index ($RLX -1.10%) created a drag on the major averages. Commodity-linked groups also had a negative bias on Friday as the Gold & Silver Index ($XAU -0.42%), Oil Services Index ($OSX -0.59%), and the Integrated Oil Index ($XOI -0.23%) suffered modest losses.
Charts courtesy www.stockcharts.com
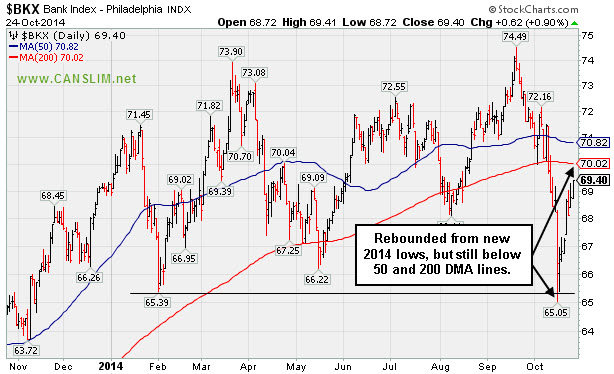
PICTURED: The Bank Index ($BKX +0.90%) rebounded from new 2014 lows but still remains below its 50-day and 200-day moving average (DMA) lines.
| Oil Services |
$OSX |
245.14 |
-1.46 |
-0.59% |
-12.77% |
| Integrated Oil |
$XOI |
1,454.70 |
-3.32 |
-0.23% |
-3.22% |
| Semiconductor |
$SOX |
612.05 |
+6.41 |
+1.06% |
+14.40% |
| Networking |
$NWX |
308.95 |
-2.19 |
-0.70% |
-4.63% |
| Broker/Dealer |
$XBD |
166.11 |
+1.08 |
+0.66% |
+3.46% |
| Retail |
$RLX |
926.31 |
-10.29 |
-1.10% |
-1.44% |
| Gold & Silver |
$XAU |
75.93 |
-0.32 |
-0.42% |
-9.77% |
| Bank |
$BKX |
69.40 |
+0.62 |
+0.90% |
+0.20% |
| Biotech |
$BTK |
3,244.19 |
+40.25 |
+1.26% |
+39.21% |
|
|
|
 |
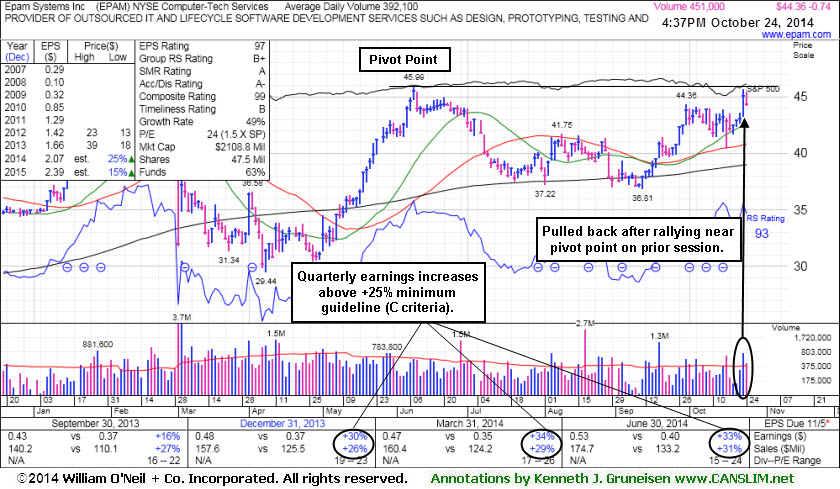
Pulled Back After Challenging Prior Highs
Kenneth J. Gruneisen - Passed the CAN SLIM® Master's Exam
Epam Systems Inc (EPAM -$0.74 or -1.64% to $44.36) pulled back today. It was highlighted in yellow with pivot point cited based on its 6/09/14 high plus 10 cents in the 10/23/14 mid-day report (read here). It challenged prior highs and approached its 52-week high with a solid gain backed by 2 times average volume. Subsequent volume-driven gains above the pivot point may trigger a technical buy signal.
Keep in mind that the high-ranked Computer - Tech Services firm is due to report earnings for the Sep '14 quarter on 11/04/14. Volume and volatility often increase near earnings news. It reported earnings +33% on +31% sales revenues for the Jun '14 quarter, a 3rd consecutive quarter with earnings above the +25% guideline, making it a better match concerning the C criteria. Annual earnings growth (A criteria) has been strong.
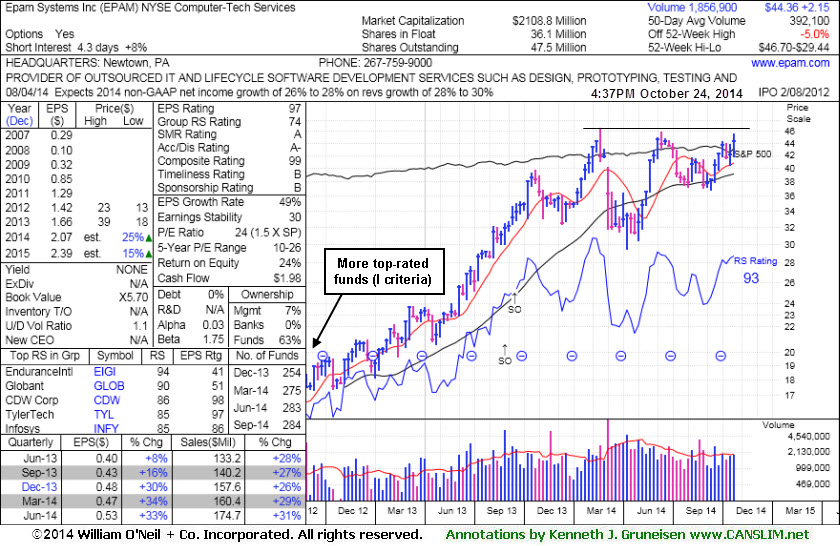
It completed Secondary Offerings 8/30/13 and 9/17/13. The number of top-rated funds owning its shares rose from 254 in Dec '13 to 284 in Sep '14, a reassuring sign concerning the I criteria. Its small supply of only 36.1 million shares (S criteria) can contribute to greater volatility in the event of institutional buying or selling.
|
|
|
Color Codes Explained :
Y - Better candidates highlighted by our
staff of experts.
G - Previously featured
in past reports as yellow but may no longer be buyable under the
guidelines.
***Last / Change / Volume data in this table is the closing quote data***
Symbol/Exchange
Company Name
Industry Group |
PRICE |
CHANGE
(%Change) |
Day High |
Volume
(% DAV)
(% 50 day avg vol) |
52 Wk Hi
% From Hi |
Featured
Date |
Price
Featured |
Pivot Featured |
|
Max Buy |
ACT
-
NYSE
Actavis plc
Medical-Generic Drugs
|
$240.33
|
+3.12
1.32% |
$240.85
|
1,363,235
62.05% of 50 DAV
50 DAV is 2,197,000
|
$249.94
-3.84%
|
6/20/2014
|
$216.53
|
PP = $230.87
|
|
MB = $242.41
|
Most Recent Note - 10/21/2014 6:12:28 PM
Y - Color code is changed to yellow after rebounding above its 50 DMA line today helping its outlook improve. Found support at its 200 DMA line following damaging losses marked by volume. See the latest FSU analysis for more details and new annotated graphs.
>>> FEATURED STOCK ARTICLE : Quiet Gains Help Generic Drug Firm Rise Above 50-Day Average - 10/21/2014
View all notes |
Set NEW NOTE alert |
CANSLIM.net Company Profile |
SEC
News |
Chart |
Request a new note
C
A N
S L
I M


|
AFSI
-
NASDAQ
Amtrust Financial Svcs
INSURANCE - Property and; Casualty Insurance
|
$49.37
|
-0.83
-1.65% |
$50.56
|
655,551
88.71% of 50 DAV
50 DAV is 739,000
|
$51.08
-3.35%
|
10/17/2014
|
$45.24
|
PP = $46.02
|
|
MB = $48.32
|
Most Recent Note - 10/22/2014 12:06:41 PM
G - Rallying further above its "max buy" level with today's 5th consecutive volume-driven gain. Finished at the session high with a gap up and considerable volume-driven gain on the prior session triggering a technical buy signal. Prior highs in the $46-47 area define support to watch on pullbacks.
>>> FEATURED STOCK ARTICLE : Perched Near High After Rebounding From 200-Day Average - 10/17/2014
View all notes |
Set NEW NOTE alert |
CANSLIM.net Company Profile |
SEC
News |
Chart |
Request a new note
C
A N
S L
I M
|
ALXN
-
NASDAQ
Alexion Pharmaceuticals
DRUGS - Drug Manufacturers - Other
|
$190.29
|
+4.37
2.35% |
$190.85
|
1,812,018
152.66% of 50 DAV
50 DAV is 1,187,000
|
$186.47
2.05%
|
10/23/2014
|
$184.01
|
PP = $185.53
|
|
MB = $194.81
|
 Most Recent Note - 10/24/2014 4:36:51 PM
Y - Hit new 52-week and all-time highs with today's 2nd consecutive volume-driven gain and it finished near the session high. It was highlighted in yellow in the 10/23/14 mid-day report (read here) as solid volume-driven gains triggered a technical buy signal. Prior highs in the $180 area define initial support to watch on pullbacks. See the latest FSU analysis for more details and annotated graphs.
>>> FEATURED STOCK ARTICLE : Finished Strong After Gapping Up Above Prior High - 10/23/2014
View all notes |
Set NEW NOTE alert |
CANSLIM.net Company Profile |
SEC
News |
Chart |
Request a new note
C
A N
S L
I M
|
EPAM
-
NYSE
Epam Systems Inc
COMPUTER SOFTWARE and SERVICES - Information Technology Service
|
$44.36
|
-0.74
-1.64% |
$45.48
|
463,841
118.33% of 50 DAV
50 DAV is 392,000
|
$46.70
-5.01%
|
10/23/2014
|
$45.21
|
PP = $46.09
|
|
MB = $48.39
|
Most Recent Note - 10/24/2014 5:03:36 PM
Y - Pulled back today. Finished strong after highlighted in yellow with pivot point cited based on its 6/09/14 high plus 10 cents in the 10/23/14 mid-day report (read here). It challenged prior highs and approached its 52-week high with a solid gain backed by 2 times average volume. Subsequent volume-driven gains above the pivot point may trigger a technical buy signal. Reported earnings +33% on +31% sales revenues for the Jun '14 quarter, a 3rd consecutive quarter with earnings above the +25% guideline, making it a better match concerning the C criteria. Completed Secondary Offerings 8/30/13 and 9/17/13. See the latest FSU analysis for more details and new annotated graphs.
>>> FEATURED STOCK ARTICLE : Pulled Back After Challenging Prior Highs - 10/24/2014
View all notes |
Set NEW NOTE alert |
CANSLIM.net Company Profile |
SEC
News |
Chart |
Request a new note
C
A N
S L
I M
|
FB
-
NASDAQ
Facebook Inc Cl A
INTERNET
|
$80.67
|
+0.63
0.79% |
$80.82
|
32,085,907
92.30% of 50 DAV
50 DAV is 34,761,000
|
$80.63
0.05%
|
9/9/2014
|
$76.67
|
PP = $76.84
|
|
MB = $80.68
|
Most Recent Note - 10/23/2014 5:51:21 PM
Y - Wedged higher and hit another new 52-week high while approaching its "max buy" level with average volume behind today's gain. Rebound above the 50 DMA line helped its outlook improve and its color code was changed to yellow.
>>> FEATURED STOCK ARTICLE : Volume-Driven Losses Triggered Sell Signals After Slumping Into Prior Base - 10/16/2014
View all notes |
Set NEW NOTE alert |
CANSLIM.net Company Profile |
SEC
News |
Chart |
Request a new note
C
A N
S L
I M
|
Symbol/Exchange
Company Name
Industry Group |
PRICE |
CHANGE
(%Change) |
Day High |
Volume
(% DAV)
(% 50 day avg vol) |
52 Wk Hi
% From Hi |
Featured
Date |
Price
Featured |
Pivot Featured |
|
Max Buy |
ILMN
-
NASDAQ
Illumina Inc
DRUGS - Biotechnology
|
$189.12
|
+3.28
1.76% |
$189.42
|
1,236,655
100.05% of 50 DAV
50 DAV is 1,236,000
|
$190.86
-0.91%
|
10/22/2014
|
$188.77
|
PP = $182.27
|
|
MB = $191.38
|
Most Recent Note - 10/24/2014 5:36:28 PM
Y - Perched at its 52-week high following today's 4th consecutive gain. Prior highs near $182 define near-term support to watch on pullbacks. See the latest FSU analysis for more details and annotated graphs.
>>> FEATURED STOCK ARTICLE : Breakout Cleared "Double Bottom" Base Pattern - 10/22/2014
View all notes |
Set NEW NOTE alert |
CANSLIM.net Company Profile |
SEC
News |
Chart |
Request a new note
C
A N
S L
I M
|
PANW
-
NYSE
Palo Alto Networks
Computer Sftwr-Security
|
$108.06
|
+0.61
0.57% |
$108.50
|
1,216,512
55.00% of 50 DAV
50 DAV is 2,212,000
|
$108.21
-0.14%
|
7/30/2014
|
$84.21
|
PP = $85.88
|
|
MB = $90.17
|
Most Recent Note - 10/23/2014 5:57:26 PM
G - Hit new 52-week and all-time highs with today's solid gain on higher volume, getting more extended from any sound base. Recent low ($87.83 on 10/13/14) and 50 DMA line define important near-term support where violations would trigger technical sell signals.
>>> FEATURED STOCK ARTICLE : Prompt Rebound Above 50-Day Average an Encouraging Sign of Support - 10/14/2014
View all notes |
Set NEW NOTE alert |
CANSLIM.net Company Profile |
SEC
News |
Chart |
Request a new note
C
A N
S L
I M
|
STRT
-
NASDAQ
Strattec Security Corp
AUTOMOTIVE - Auto Parts
|
$96.69
|
+11.61
13.65% |
$97.44
|
102,853
428.55% of 50 DAV
50 DAV is 24,000
|
$89.87
7.58%
|
9/19/2014
|
$86.06
|
PP = $89.97
|
|
MB = $94.47
|
Most Recent Note - 10/24/2014 5:34:21 PM
G - Reported +180% earnings on +54% sales revenues for the Sep '14 quarter, showing impressive sales and earnings acceleration in recent quarterly comparisons. Spiked to a new 52-week high with today's considerable gap up gain backed by more than 4 times average volume clinching a convincing technical buy signal. Color code is changed to green after getting extended beyond its "max buy" level. Its 50 DMA line defines important near-term support.
>>> FEATURED STOCK ARTICLE : Building Base-On-Base Pattern Ahead of Earnings News - 10/20/2014
View all notes |
Set NEW NOTE alert |
CANSLIM.net Company Profile |
SEC
News |
Chart |
Request a new note
C
A N
S L
I M
|
|
|
|
THESE ARE NOT BUY RECOMMENDATIONS!
Comments contained in the body of this report are technical
opinions only. The material herein has been obtained
from sources believed to be reliable and accurate, however,
its accuracy and completeness cannot be guaranteed.
This site is not an investment advisor, hence it does
not endorse or recommend any securities or other investments.
Any recommendation contained in this report may not
be suitable for all investors and it is not to be deemed
an offer or solicitation on our part with respect to
the purchase or sale of any securities. All trademarks,
service marks and trade names appearing in this report
are the property of their respective owners, and are
likewise used for identification purposes only.
This report is a service available
only to active Paid Premium Members.
You may opt-out of receiving report notifications
at any time. Questions or comments may be submitted
by writing to Premium Membership Services 665 S.E. 10 Street, Suite 201 Deerfield Beach, FL 33441-5634 or by calling 1-800-965-8307
or 954-785-1121.
|
|
|

