You are not logged in.
This means you
CAN ONLY VIEW reports that were published prior to Friday, March 28, 2025.
You
MUST UPGRADE YOUR MEMBERSHIP if you want to see any current reports.
AFTER MARKET UPDATE - THURSDAY, OCTOBER 23RD, 2014
Previous After Market Report Next After Market Report >>>
|
|
|
|
DOW |
+216.58 |
16,677.90 |
+1.32% |
|
Volume |
796,981,160 |
+2% |
|
Volume |
1,779,665,910 |
-2% |
|
NASDAQ |
+69.94 |
4,452.79 |
+1.60% |
|
Advancers |
2,415 |
76% |
|
Advancers |
2,178 |
72% |
|
S&P 500 |
+23.71 |
1,950.82 |
+1.23% |
|
Decliners |
702 |
22% |
|
Decliners |
742 |
25% |
|
Russell 2000 |
+19.61 |
1,116.49 |
+1.79% |
|
52 Wk Highs |
109 |
|
|
52 Wk Highs |
52 |
|
|
S&P 600 |
+10.02 |
644.65 |
+1.58% |
|
52 Wk Lows |
31 |
|
|
52 Wk Lows |
46 |
|
|
 |
Breadth Positive as Indices Rallied for Large Gains
Kenneth J. Gruneisen - Passed the CAN SLIM® Master's Exam
Stocks rallied on Thursday and the major averages all closed more than +1.2% higher. The Dow finished up 216 points to 16,677. The S&P 500 climbed 23 points to 1,950. The NASDAQ was up 70 points to 4,452. Volume totals were reported near the prior session totals. Breadth was positive as advancers led decliners by more than a 3-1 margin on the NYSE and on the Nasdaq exchange. There were 42 high-ranked companies from the CANSLIM.net Leaders List that made new 52-week highs and appeared on the CANSLIM.net BreakOuts Page, down from the prior session total of 47 stocks. New 52-week highs outnumbered new 52-week lows on the NYSE and on the Nasdaq exchange. There were gains for all 8 high-ranked companies currently on the Featured Stocks Page which includes a few new companies that were added to the list this week while broader market conditions improved. Disciplined investors know that new buying efforts may be made under the fact-based investment system only in stocks meeting all key criteria.
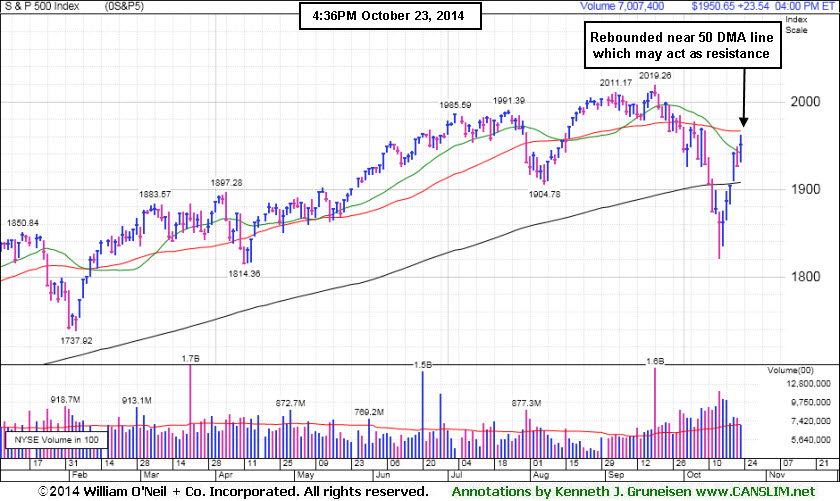
PICTURED: The S&P 500 Index rebounded near its 50-day moving average after recently undercutting its 200 DMA line.
The major averages rallied throughout the day as investors focused on corporate earnings and economic data. At the close eight of the 10 sectors in the S&P 500 were in positive territory. Industrials led the advance as shares of 3M (MMM +4.39%) and Caterpillar (CAT +4.97%) rallied following better-than-expected profit tallies. Energy was another outperformer, as the price of WTI crude rose +1.9% to $82.01 per barrel. Diamond Offshore (DO +5.97%) rose on positive quarterly results. Telecom limited the advance as AT&T (T -2.43%) fell after failing to meet earnings expectations. Notable earnings releases after the market close included Microsoft (MSFT +1.44%) and Amazon.com (AMZN +0.07%).
Economic data was also in focus. A report showed the four-week average of jobless held at a 14-year low and home prices unexpectedly gained in August. These reports overshadowed a measure of manufacturing sentiment for September which fell short of estimates.
Treasuries finished markedly lower. The 10-year note lost 15/32 to yield 2.27%.
Large gains on Tuesday backed by higher volume totals while leadership (stocks hitting new 52-week highs) expanded met the definition of a "follow-through day" confirming a new uptrend for the market (M criteria). The S&P 500 Index, Nasdaq Composite Index, and the Dow Jones Industrial Average have collectively rebounded above their respective 200-day moving average (DMA) lines, technically putting the market in a "healthier" stance.
The CANSLIM.net Featured Stocks Page shows the most action-worthy candidates and their latest notes and a Headline Link directs members to the latest detailed analysis with data-packed graphs annotated by a Certified expert along with links to additional resources. The Premium Member Homepage includes "dynamic archives" to all prior pay reports published.
|
 Kenneth J. Gruneisen started out as a licensed stockbroker in August 1987, a couple of months prior to the historic stock market crash that took the Dow Jones Industrial Average down -22.6% in a single day. He has published daily fact-based fundamental and technical analysis on high-ranked stocks online for two decades. Through FACTBASEDINVESTING.COM, Kenneth provides educational articles, news, market commentary, and other information regarding proven investment systems that work in good times and bad.
Comments contained in the body of this report are technical opinions only and are not necessarily those of Gruneisen Growth Corp. The material herein has been obtained from sources believed to be reliable and accurate, however, its accuracy and completeness cannot be guaranteed. Our firm, employees, and customers may effect transactions, including transactions contrary to any recommendation herein, or have positions in the securities mentioned herein or options with respect thereto. Any recommendation contained in this report may not be suitable for all investors and it is not to be deemed an offer or solicitation on our part with respect to the purchase or sale of any securities. |
|
 |
Tech, Retail, Financial, and Energy-Linked Groups Rose
Kenneth J. Gruneisen - Passed the CAN SLIM® Master's Exam
The Networking Index ($NWX +4.25%) led the tech sector's rally while the Biotechnology Index ($BTK +2.59%) and the Semiconductor Index ($SOX +1.46%) followed with smaller gains. The Retail Index ($RLX +1.61%) was a positive influence on the major averages along with financials as the Broker/Dealer Index ($XBD +1.75%) outpaced the Bank Index ($BKX +0.98%). Energy-related shares also had a positive bias as the Oil Services Index ($OSX +1.17%) and the Integrated Oil Index ($XOI +1.54%). The Gold & Silver Index ($XAU +0.42%) lagged growth oriented groups while posting a smaller gain.
Charts courtesy www.stockcharts.com
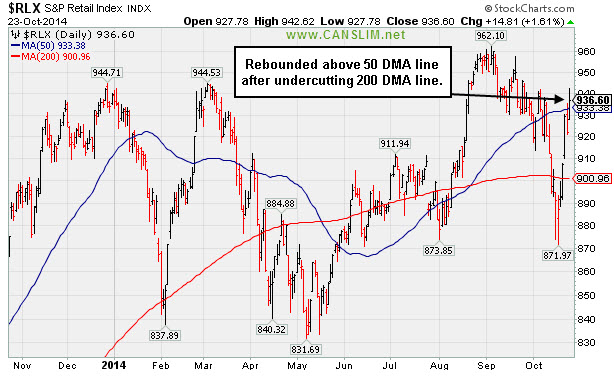
PICTURED: The Retail Index ($RLX +1.61%) has rebounded above its 50-day moving average line after recently undercutting its 200 DMA line.
| Oil Services |
$OSX |
246.60 |
+2.86 |
+1.17% |
-12.25% |
| Integrated Oil |
$XOI |
1,458.02 |
+22.10 |
+1.54% |
-3.00% |
| Semiconductor |
$SOX |
605.64 |
+8.71 |
+1.46% |
+13.20% |
| Networking |
$NWX |
311.14 |
+12.69 |
+4.25% |
-3.95% |
| Broker/Dealer |
$XBD |
165.03 |
+2.84 |
+1.75% |
+2.78% |
| Retail |
$RLX |
936.60 |
+14.81 |
+1.61% |
-0.34% |
| Gold & Silver |
$XAU |
76.25 |
+0.32 |
+0.42% |
-9.39% |
| Bank |
$BKX |
68.78 |
+0.67 |
+0.98% |
-0.69% |
| Biotech |
$BTK |
3,203.94 |
+80.98 |
+2.59% |
+37.48% |
|
|
|
 |
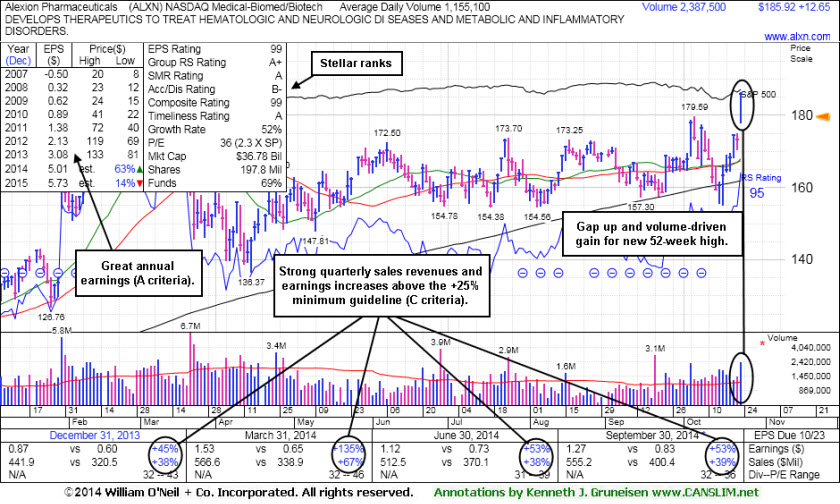
Finished Strong After Gapping Up Above Prior High
Kenneth J. Gruneisen - Passed the CAN SLIM® Master's Exam
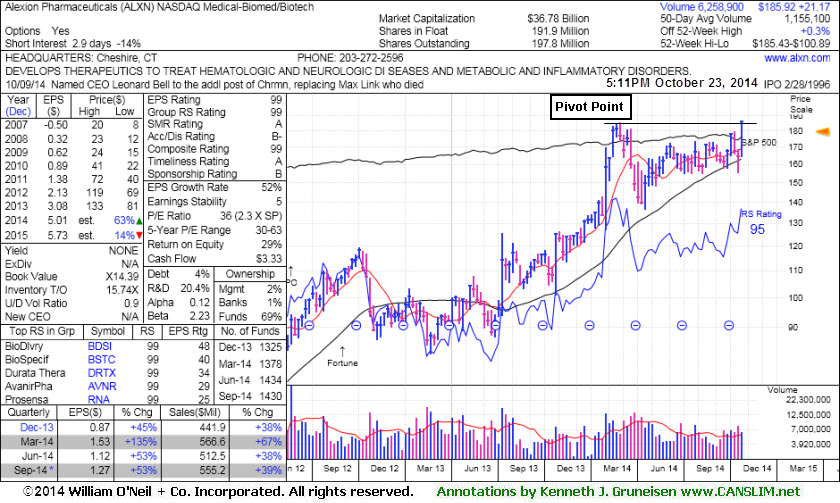
Alexion Pharmaceuticals Inc (ALXN +$12.65 or +7.30% to $185.96) finished strong today after highlighted in yellow with a pivot point based on its 2/25/14 high plus 10 cents in the earlier mid-day report (read here). The big gain for a new 52-week high was backed by +106% above average volume and triggered a technical buy signal following a gap up clearing a recent high. No resistance remains due to overhead supply. Prior highs in the $179 area define the important chart support to watch on pullbacks. Disciplined investors avoid chasing stocks more than +5% above prior highs and always limit losses by selling any stock which falls more than -7% from its purchase price.
It reported earnings +53% on +38% sales revenues for the Sep '14 quarter, continuing its strong earnings history. It found support at its 200 DMA line during its long consolidation since noted in the 3/21/14 mid-day report - "Patient investors may watch for a new base or secondary buy point to possibly develop and be noted in the weeks ahead. Fundamentals remain strong with respect to the quarterly and annual earnings (C and A criteria) history."
ALXN's Relative Strength Rank (95) remains high. It reported earnings +53% on +39% sales revenues for the quarter ended September 30, 2014 versus the year ago period. It easily satisfies the C and A criteria with a very strong quarterly and annual earnings history which has earned it a highest possible 99 Earnings Per Share rank. The number of top-rated funds owning its shares rose from 1,325 in Dec '13 to 1,430 in Sep '14, a reassuring sign concerning the I criteria of the fact-based investment system. ALXN completed a new Public Offering on 5/25/12.
The Medical - Biomed/Biotech industry group has demonstrated leadership and earned a 99 for its Group Relative Strength Rating, a reassuring sign concerning the L criteria. The stock went through a deep consolidation below its 200 DMA line then rebounded impressively since last shown in this FSU section with an annotated graph on 9/26/12 under the headline, "Consolidating Above Prior Highs Defining Chart Support".
|
|
|
Color Codes Explained :
Y - Better candidates highlighted by our
staff of experts.
G - Previously featured
in past reports as yellow but may no longer be buyable under the
guidelines.
***Last / Change / Volume data in this table is the closing quote data***
Symbol/Exchange
Company Name
Industry Group |
PRICE |
CHANGE
(%Change) |
Day High |
Volume
(% DAV)
(% 50 day avg vol) |
52 Wk Hi
% From Hi |
Featured
Date |
Price
Featured |
Pivot Featured |
|
Max Buy |
ACT
-
NYSE
Actavis plc
Medical-Generic Drugs
|
$231.41
|
-0.72
-0.31% |
$235.83
|
1,647,218
74.27% of 50 DAV
50 DAV is 2,218,000
|
$249.94
-7.41%
|
6/20/2014
|
$216.53
|
PP = $230.87
|
|
MB = $242.41
|
Most Recent Note - 10/21/2014 6:12:28 PM
Y - Color code is changed to yellow after rebounding above its 50 DMA line today helping its outlook improve. Found support at its 200 DMA line following damaging losses marked by volume. See the latest FSU analysis for more details and new annotated graphs.
>>> FEATURED STOCK ARTICLE : Quiet Gains Help Generic Drug Firm Rise Above 50-Day Average - 10/21/2014
View all notes |
Set NEW NOTE alert |
CANSLIM.net Company Profile |
SEC
News |
Chart |
Request a new note
C
A N
S L
I M


|
AFSI
-
NASDAQ
Amtrust Financial Svcs
INSURANCE - Property and; Casualty Insurance
|
$49.96
|
+0.01
0.02% |
$51.08
|
1,823,014
262.30% of 50 DAV
50 DAV is 695,000
|
$50.00
-0.08%
|
10/17/2014
|
$45.24
|
PP = $46.02
|
|
MB = $48.32
|
Most Recent Note - 10/22/2014 12:06:41 PM
G - Rallying further above its "max buy" level with today's 5th consecutive volume-driven gain. Finished at the session high with a gap up and considerable volume-driven gain on the prior session triggering a technical buy signal. Prior highs in the $46-47 area define support to watch on pullbacks.
>>> FEATURED STOCK ARTICLE : Perched Near High After Rebounding From 200-Day Average - 10/17/2014
View all notes |
Set NEW NOTE alert |
CANSLIM.net Company Profile |
SEC
News |
Chart |
Request a new note
C
A N
S L
I M
|
FB
-
NASDAQ
Facebook Inc Cl A
INTERNET
|
$78.37
|
-0.32
-0.41% |
$79.85
|
41,742,043
121.50% of 50 DAV
50 DAV is 34,357,000
|
$79.71
-1.68%
|
9/9/2014
|
$76.67
|
PP = $76.84
|
|
MB = $80.68
|
Most Recent Note - 10/21/2014 6:05:13 PM
Y - Wedged near its 52-week high with below average volume behind today's gain. Rebound above the 50 DMA line ($75.83) helped its outlook improve and its color code was changed to yellow.
>>> FEATURED STOCK ARTICLE : Volume-Driven Losses Triggered Sell Signals After Slumping Into Prior Base - 10/16/2014
View all notes |
Set NEW NOTE alert |
CANSLIM.net Company Profile |
SEC
News |
Chart |
Request a new note
C
A N
S L
I M
|
ILMN
-
NASDAQ
Illumina Inc
DRUGS - Biotechnology
|
$184.82
|
+5.27
2.94% |
$188.98
|
2,683,430
228.18% of 50 DAV
50 DAV is 1,176,000
|
$185.00
-0.10%
|
10/22/2014
|
$188.77
|
PP = $182.27
|
|
MB = $191.38
|
 Most Recent Note - 10/22/2014 6:01:20 PM
Y - Triggered a technical buy signal and it was highlighted in yellow in the earlier mid-day report (read here) with pivot point cited based on its 9/04/14 high in a "double bottom" base pattern. Considerable volume-driven gain hit a new 52-week high while clearing previously stubborn resistance in the $182-185 area. Reported earnings +71% on +35% sales revenues for the Sep '14 quarter, its 2nd consecutive quarterly comparison with earnings above the +25% minimum guideline (C criteria). Sequential quarterly comparisons show encouraging sales revenues and earnings acceleration. See the latest FSU analysis for more details and new annotated graphs.
>>> FEATURED STOCK ARTICLE : Breakout Cleared "Double Bottom" Base Pattern - 10/22/2014
View all notes |
Set NEW NOTE alert |
CANSLIM.net Company Profile |
SEC
News |
Chart |
Request a new note
C
A N
S L
I M
|
PANW
-
NYSE
Palo Alto Networks
Computer Sftwr-Security
|
$102.58
|
-2.10
-2.01% |
$105.61
|
1,806,968
82.36% of 50 DAV
50 DAV is 2,194,000
|
$106.79
-3.94%
|
7/30/2014
|
$84.21
|
PP = $85.88
|
|
MB = $90.17
|
Most Recent Note - 10/22/2014 6:02:41 PM
G - Small loss today on lighter volume broke a streak of 6 consecutive gains. Recent low ($87.83 on 10/13/14) and 50 DMA line define important near-term support where violations would trigger technical sell signals.
>>> FEATURED STOCK ARTICLE : Prompt Rebound Above 50-Day Average an Encouraging Sign of Support - 10/14/2014
View all notes |
Set NEW NOTE alert |
CANSLIM.net Company Profile |
SEC
News |
Chart |
Request a new note
C
A N
S L
I M
|
Symbol/Exchange
Company Name
Industry Group |
PRICE |
CHANGE
(%Change) |
Day High |
Volume
(% DAV)
(% 50 day avg vol) |
52 Wk Hi
% From Hi |
Featured
Date |
Price
Featured |
Pivot Featured |
|
Max Buy |
STRT
-
NASDAQ
Strattec Security Corp
AUTOMOTIVE - Auto Parts
|
$82.31
|
-0.51
-0.62% |
$83.30
|
15,694
65.39% of 50 DAV
50 DAV is 24,000
|
$89.87
-8.42%
|
9/19/2014
|
$86.06
|
PP = $89.97
|
|
MB = $94.47
|
Most Recent Note - 10/21/2014 6:08:10 PM
Y - Consolidating above its 50 DMA line where it found prompt support. Recent low ($72.13 on 10/15/14) defines important near-term support to watch. Reporting Sep '14 quarterly earnings on Thursday.
>>> FEATURED STOCK ARTICLE : Building Base-On-Base Pattern Ahead of Earnings News - 10/20/2014
View all notes |
Set NEW NOTE alert |
CANSLIM.net Company Profile |
SEC
News |
Chart |
Request a new note
C
A N
S L
I M
|
|
|
|
THESE ARE NOT BUY RECOMMENDATIONS!
Comments contained in the body of this report are technical
opinions only. The material herein has been obtained
from sources believed to be reliable and accurate, however,
its accuracy and completeness cannot be guaranteed.
This site is not an investment advisor, hence it does
not endorse or recommend any securities or other investments.
Any recommendation contained in this report may not
be suitable for all investors and it is not to be deemed
an offer or solicitation on our part with respect to
the purchase or sale of any securities. All trademarks,
service marks and trade names appearing in this report
are the property of their respective owners, and are
likewise used for identification purposes only.
This report is a service available
only to active Paid Premium Members.
You may opt-out of receiving report notifications
at any time. Questions or comments may be submitted
by writing to Premium Membership Services 665 S.E. 10 Street, Suite 201 Deerfield Beach, FL 33441-5634 or by calling 1-800-965-8307
or 954-785-1121.
|
|
|

