You are not logged in.
This means you
CAN ONLY VIEW reports that were published prior to Sunday, October 20, 2024.
You
MUST UPGRADE YOUR MEMBERSHIP if you want to see any current reports.
AFTER MARKET UPDATE - FRIDAY, OCTOBER 23RD, 2009
Previous After Market Report Next After Market Report >>>
|
|
|
|
DOW |
-109.13 |
9,972.18 |
-1.08% |
|
Volume |
1,277,001,790 |
-3% |
|
Volume |
2,484,031,030 |
+7% |
|
NASDAQ |
-10.82 |
2,154.47 |
-0.50% |
|
Advancers |
731 |
23% |
|
Advancers |
638 |
23% |
|
S&P 500 |
-13.31 |
1,079.60 |
-1.22% |
|
Decliners |
2,287 |
73% |
|
Decliners |
2,067 |
73% |
|
Russell 2000 |
-12.52 |
600.86 |
-2.04% |
|
52 Wk Highs |
181 |
|
|
52 Wk Highs |
93 |
|
|
S&P 600 |
-6.29 |
317.65 |
-1.94% |
|
52 Wk Lows |
2 |
|
|
52 Wk Lows |
12 |
|
|
 |
Losses Lead To Negative Reversal For Week After Reaching New 2009 Highs
Adam Sarhan, Contributing Writer,
For Friday's session and for the week the major averages opened higher and rallied to new 2009 highs before reversing and closing lower as the latest earnings news flooded in. The classic "negative reversal" was marked by higher volume totals compared to the prior week, which suggested that large institutions were net sellers. Decliners undeniably trumped advancers by over a 3-to-1 ratio on both major exchanges. Friday's volume totals were mixed, reported lower on the NYSE, yet higher on the Nasdaq exchange compared to the prior session. The lower volume helped the NYSE indices avoid another distribution day. The Nasdaq Composite Index's -0.50% loss may be considered a "distribution day", but ironically, the higher volume total could largely be attributed to very heavy trading in a couple of standout gainers showing very bullish action, most notably Microsoft Corp (MSFT +5.38%). There were 23 high-ranked companies from the CANSLIM.net Leaders List, making a new 52-week high and appearing on the CANSLIM.net BreakOuts Page, higher than the 9 issues that appeared on the prior session. New 52-week highs still substantially outnumbered new 52-week lows on both major exchanges.

On Monday, stocks enjoyed healthy gains ahead of Apple Inc's (AAPL -0.61%) earnings announcement. Monday marked the 22-year anniversary of the October 1987 crash. Approximately 130 companies in the S&P 500 reported earnings this week and most of them topped Wall Street estimates. However, the fact that the market closed lower on the news suggests large institutions were not happy with the tepid data. The average analyst believes that profits will rebound +65% in the last three months of the year after falling for nine straight quarters which is the longest streak since the Great Depression. It was encouraging to see stocks rally after confidence among US homebuilders unexpectedly fell in October, and concerns are spreading that home sales will fall after government credits expire. The National Association of Home Builders/Wells Fargo confidence index fell -18% a reading of 19 in September which was the highest in more than a year, the Washington-based association said. Any reading below 50 suggests respondents view conditions as poor.
On Tuesday, the major averages suffered a distribution day as the US dollar advanced. The Commerce Department released a report which showed housing starts rose +0.5% in September to an annual rate of 590,000 and lowered August's reading. This fell short of the Street's estimate for a rate of 610,000. Permits, a sign of future construction, fell for the second time in the past three months which signaled the housing recovery is still questionable. The Labor Department released its Producer Price Index (PPI) which fell -0.6%. Bloomberg.com defines the PPI as "index that measures the average price level for a fixed basket of capital and consumer goods received by producers." This was the second decline in three months and followed a +1.7% rise in August. Core PPI which excludes food and energy slid -0.1%.
On Wednesday,the Dow Jones Industrial Average, Nasdaq Composite, and S&P 500 indexes all suffered an "outside reversal" day which means that session's range eclipsed the prior session's range. Chart readers view outside reversal days as very significant since historically they have often marked a meaningful change in trend. The major averages turned lower in the final hour of trading after analyst Dick Bove downgraded Wells Fargo & Co. (WFC -2.82%). Timothy Geithner the current US Treasury Secretary said the bank capital-purchase program in last year's $700 billion bailout will be allowed to expire later this year because parts of the economy and the markets are stabilizing. Geithner told Reuters that “We are now at the point where we can begin to wind down the programs that really defined TARP in its initial stages,” referring to the Troubled Asset Relief Program. Elsewhere, the Federal Reserve released its Beige Book which surveyed its 12 districts. The report showed that the 12 regions believe that many sectors of the economy have stabilized or are modestly improving. The report also showed that all regions showed a waning real estate market.
On Thursday stocks came racing back however volume, a key gauge of institutional activity was lighter than the prior session. The lighter volume bounce suggested the bulls were getting weaker and the bears were quietly strengthening. Finally on Friday, the bulls ran out of steam as the bears showed up and sent the major averages tumbling even after Microsoft Corp (MSFT +5.38%), Amazon.com Inc (AMZN +26.80%), Netflix Inc (NFLX +10.6%) gapped higher on very strong earnings data. The fact that all of the major averages traded to fresh 2009 highs before turning lower on heavier volume than the prior session suggests a near term pullback may be in the cards. That said, adjust your stops and trade accordingly. The first level of support for the benchmark S&P 500 Index is 1,080, then its 8-month upward trendline and 50-day moving average (DMA) line. Barring some unforeseen event, this rally will remain intact until the 50 DMA line is breached. If the S&P 500 closes below 1,080 then this rally will be viewed by us as "under pressure."
PICTURED: The Nasdaq Composite Index suffered multiple distribution days and two high volume negative reversals this week!
|
|
|
 |
Retail Index's Gain and Internet Index's Firm Stand Buck Broader Losses
Kenneth J. Gruneisen - Passed the CAN SLIM® Master's Exam
The Retail Index ($RLX +1.38%) was a standout gainer while Friday afternoon's weak action erased early gains and resulted in widespread losses across most industry groups. The Internet Index ($IIX -0.03%) ended flat, holding its ground with considerable help from Amazon.com Inc's (AMZN +26.8%) strong earnings report that prompted a considerable "breakaway gap" on 9 times average volume. But the Semiconductor Index ($SOX -3.19%), Biotechnology Index ($BTK -2.41%), and Networking Index ($NWX -1.47%) tumbled. Financial shares also backpedaled as the Bank Index ($BKX -1.63%) closed a few pennies below its 50-day moving average line, and the Broker/Dealer Index ($XBD -2.97%) suffered a larger loss while falling toward its 50 DMA line. As for defensive groups, the Gold & Silver Index ($XAU -1.17%) and Healthcare Index ($HMO -0.91%) sank, but they held their ground better than energy-related shares. The Oil Services Index ($OSX -2.93%) and Integrated Oil Index ($XOI -1.66%) gave way to profit taking pressure following their recent sharp rallies.
Charts courtesy www.stockcharts.com
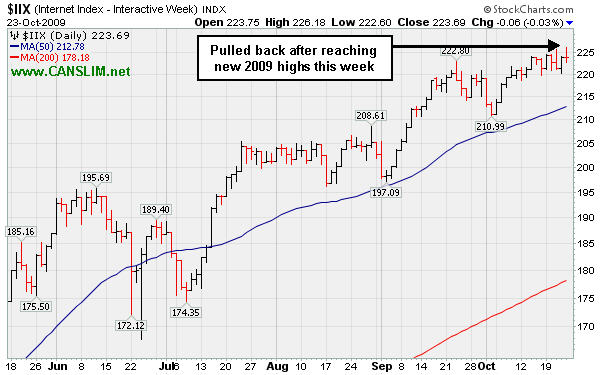
PICTURED: The Internet Index ($IIX -0.03%) pulled back after reaching new 2009 highs this week.
| Oil Services |
$OSX |
204.58 |
-6.18 |
-2.93% |
+68.53% |
| Healthcare |
$HMO |
1,144.12 |
-10.46 |
-0.91% |
+19.16% |
| Integrated Oil |
$XOI |
1,102.48 |
-18.61 |
-1.66% |
+12.53% |
| Semiconductor |
$SOX |
316.41 |
-10.43 |
-3.19% |
+49.13% |
| Networking |
$NWX |
233.98 |
-3.49 |
-1.47% |
+62.61% |
| Internet |
$IIX |
223.69 |
-0.06 |
-0.03% |
+67.22% |
| Broker/Dealer |
$XBD |
118.34 |
-3.62 |
-2.97% |
+52.76% |
| Retail |
$RLX |
395.05 |
+5.37 |
+1.38% |
+41.46% |
| Gold & Silver |
$XAU |
172.09 |
-2.03 |
-1.17% |
+38.95% |
| Bank |
$BKX |
46.48 |
-0.77 |
-1.63% |
+4.87% |
| Biotech |
$BTK |
877.07 |
-21.69 |
-2.41% |
+35.52% |
|
|
|
 |
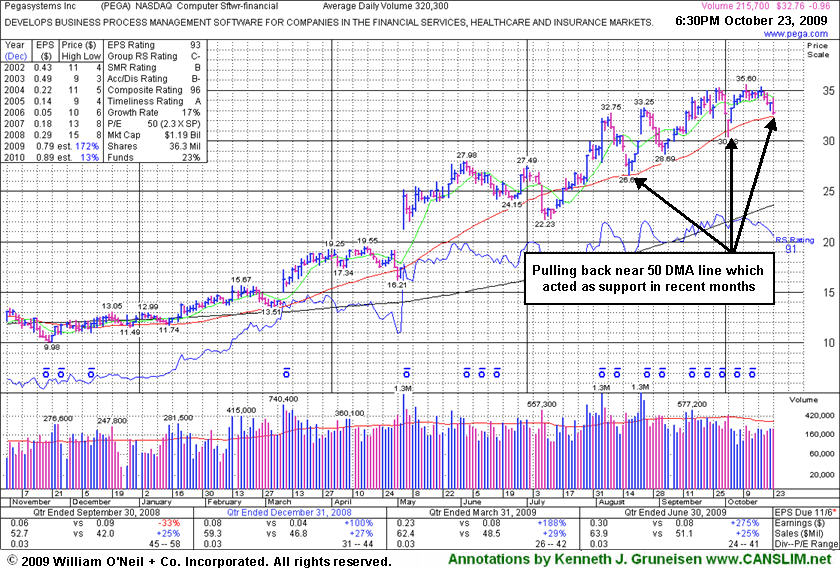
Quiet Consolidation Near Important Support Level
Kenneth J. Gruneisen - Passed the CAN SLIM® Master's Exam
Pegasystems Inc (PEGA -$0.96 or -1.02% to $32.76) gapped up today but then negatively reversed for a loss on light volume, pulling back near its 50 DMA line. This high-ranked Computer Software - Financial firm quietly ended the week just above that short-term average line. An upward trendline (not drawn) connecting its July-October lows also coincides in that area, helping define an important technical support level to watch. Violations could trigger technical sell signals, with its 10/02/09 intra-day low ($30.38) the next chart support level to keep an eye on.
The number of top-rated funds owning its shares rose from 43 in Sep '08 to 80 in Jun '09, which is a solid reassurance concerning the investment system's I criteria. PEGA has shown solid sales revenues increases and +25% earnings increases in the 3 last quarterly comparisons versus the year ago period. It also appears to have an easy comparison in the upcoming report for the quarter ended September 30, 2009 versus the year ago period's earnings of only 6 cents per share. The previously noted downturn in annual earnings (the A criteria) from 2003 to 2006 has been followed by a solid turn around and big earnings increases in '07 and '08, and Street expectations for '09 are calling for well above +25% growth.
|
|
|
Color Codes Explained :
Y - Better candidates highlighted by our
staff of experts.
G - Previously featured
in past reports as yellow but may no longer be buyable under the
guidelines.
***Last / Change / Volume quote data in this table corresponds with the timestamp on the note***
Symbol/Exchange
Company Name
Industry Group |
Last |
Chg. |
Vol
% DAV |
Date Featured |
Price Featured |
Latest Pivot Point
Featured |
Status |
| Latest Max Buy Price |
ARO
- NYSE
Aeropostale Inc
RETAIL - Apparel Stores
|
$42.43
|
-0.76
|
2,284,434
89% DAV
2,559,000
|
8/21/2009
(Date
Featured) |
$39.21
(Price
Featured) |
PP = $44.95 |
Y |
| MB = $47.20 |
Most Recent Note - 10/23/2009 4:34:55 PM
Y - Rallied from support at its 50 DMA line this week. Any subsequent violation could raise concerns and trigger a technical sell signal. Additional analysis (in response to a member inquiry) was included in the "Ken's Mailbag" section of the 10/21/09 After-Market Update (read here). Two months earlier, ARO was featured in yellow in the 8/21/09 Mid-Day BreakOuts Report (read here).
>>> The latest Featured Stock Update with an annotated graph appeared on 10/22/2009. click here.
|
|
C
A
S
I |
News |
Chart |
SEC
View all notes Alert
me of new notes
Company
Profile
|
ARST
-
|
$24.91
|
+0.17
|
306,386
46% DAV
667,600
|
9/1/2009
(Date
Featured) |
$19.91
(Price
Featured) |
PP = $20.90 |
G |
| MB = $21.95 |
Most Recent Note - 10/23/2009 4:35:50 PM
G - Quietly consolidating in a tight range above prior chart highs after rallying from a base-on-base type pattern, but it is extended from its 9/04/09 "late stage" breakout. ARST was first featured in yellow at $19.91 in the 9/01/09 mid-day report with an annotated daily graph (read here).
>>> The latest Featured Stock Update with an annotated graph appeared on 10/21/2009. click here.
|
|
C
A
S
I |
News |
Chart |
SEC
View all notes Alert
me of new notes
Company
Profile
|
ASIA
-
|
$22.46
|
-0.34
|
829,696
104% DAV
795,100
|
10/14/2009
(Date
Featured) |
$23.05
(Price
Featured) |
PP = $22.19 |
Y |
| MB = $23.30 |
Most Recent Note - 10/23/2009 4:38:00 PM
Y - Loss on average volume today was its 4th consecutive small loss, consolidating above its pivot point but below its "max buy" level. Prior chart highs in the $21-22 area are important support to watch on pullbacks. It was highlighted in yellow in the 10/14/09 mid-day report (read here) as it gapped up for a new 52-week high with 5 times average volume, triggering a technical buy signal by blasting above its pivot point. First featured in the August 2009 CANSLIM.net News (read here).
>>> The latest Featured Stock Update with an annotated graph appeared on 10/14/2009. click here.
|
|
C
A
S
I |
News |
Chart |
SEC
View all notes Alert
me of new notes
Company
Profile
|
BIDU
- NASDAQ
Baidu Inc Ads
INTERNET - Internet Information Providers
|
$435.31
|
+19.71
|
3,255,778
177% DAV
1,843,300
|
9/8/2009
(Date
Featured) |
$351.80
(Price
Featured) |
PP = $368.59 |
G |
| MB = $387.02 |
Most Recent Note - 10/23/2009 4:45:53 PM
G - Choppy action has not allowed it to form a sound base in recent weeks. It gapped up today, posting a considerable gain with above average volume for a new all-time high. It is up about +23% from its price when featured in yellow in the 9/08/09 Mid-Day BreakOuts Report (read here).
>>> The latest Featured Stock Update with an annotated graph appeared on 10/7/2009. click here.
|
|
C
A
S
I |
News |
Chart |
SEC
View all notes Alert
me of new notes
Company
Profile
|
CACC
- NASDAQ
Credit Acceptance Corp
FINANCIAL SERVICES - Credit Services
|
$36.61
|
+0.04
|
18,391
44% DAV
41,700
|
9/29/2009
(Date
Featured) |
$33.48
(Price
Featured) |
PP = $32.60 |
G |
| MB = $34.23 |
Most Recent Note - 10/23/2009 4:48:06 PM
G - Volume has been drying up in recent weeks while stubbornly holding its ground and hovering near all-time highs. Prior chart highs and its 50 DMA line coincide in the $32 area, an important level to watch on pullbacks. The Finance - Consumer/Commercial Loans firm has maintained a great track record of annual and quarterly sales revenues and earnings increases. It was featured on 9/29/09 in yellow in the mid-day report (read here).
>>> The latest Featured Stock Update with an annotated graph appeared on 10/15/2009. click here.
|
|
C
A
S
I |
News |
Chart |
SEC
View all notes Alert
me of new notes
Company
Profile
|
CRM
- NYSE
Salesforce.com Inc
INTERNET - Internet Software & Services
|
$63.12
|
+0.45
|
1,436,354
69% DAV
2,095,200
|
8/16/2009
(Date
Featured) |
$47.12
(Price
Featured) |
PP = $45.59 |
G |
| MB = $47.87 |
Most Recent Note - 10/23/2009 5:09:46 PM
G - It has steadily advanced and is now extended from any sound base. Initial technical support to watch is prior chart highs in the $59 area which coincide with an upward trendline connecting its July, August and October chart lows, both just above additional support at its 50 DMA line.
>>> The latest Featured Stock Update with an annotated graph appeared on 10/5/2009. click here.
|
|
C
A
S
I |
News |
Chart |
SEC
View all notes Alert
me of new notes
Company
Profile
|
EBIX
- NASDAQ
Ebix Inc
COMPUTER SOFTWARE & SERVICES - Business Software & Services
|
$65.75
|
+0.00
|
269,698
128% DAV
211,200
|
8/28/2009
(Date
Featured) |
$45.86
(Price
Featured) |
PP = $45.35 |
G |
| MB = $47.62 |
Most Recent Note - 10/23/2009 5:11:14 PM
G - After steadily advancing into new all-time high territory it is now very extended from any sound base, well above support at its 50 DMA line, and more than +94% above its 200 DMA line - all of which are reminders to be watchful for sell signals.
>>> The latest Featured Stock Update with an annotated graph appeared on 10/13/2009. click here.
|
|
C
A
S
I |
News |
Chart |
SEC
View all notes Alert
me of new notes
Company
Profile
|
GMCR
- NASDAQ
Green Mtn Coffee Roastrs
FOOD & BEVERAGE - Processed & Packaged Goods
|
$74.64
|
+0.42
|
616,574
49% DAV
1,248,800
|
10/5/2009
(Date
Featured) |
$71.11
(Price
Featured) |
PP = $75.89 |
Y |
| MB = $79.68 |
Most Recent Note - 10/23/2009 5:15:12 PM
Y - Early this week it rallied above is pivot point with volume barely meeting the minimum guideline needed to trigger a proper technical buy signal, but it quietly slumped back under its pivot point as it closed the week. Keep in mind this may be considered a 3rd or 4th stage base, and thus more failure prone, meanwhile its earlier breakouts were backed by far more impressive volume.
>>> The latest Featured Stock Update with an annotated graph appeared on 10/12/2009. click here.
|
|
C
A
S
I |
News |
Chart |
SEC
View all notes Alert
me of new notes
Company
Profile
|
PEGA
- NASDAQ
Pegasystems Inc
COMPUTER SOFTWARE & SERVICES - Business Software & Services
|
$32.76
|
-0.96
|
219,583
68% DAV
320,900
|
9/9/2009
(Date
Featured) |
$31.14
(Price
Featured) |
PP = $33.35 |
Y |
| MB = $35.02 |
Most Recent Note - 10/23/2009 5:17:59 PM
Y - This high-ranked Computer Software - Financial firm gapped up but then negatively reversed for a loss on light volume, pulling back near its 50 DMA line. That short-term average and its upward trendline are important technical support levels to watch.
>>> The latest Featured Stock Update with an annotated graph appeared on 10/23/2009. click here.
|
|
C
A
S
I |
News |
Chart |
SEC
View all notes Alert
me of new notes
Company
Profile
|
SWI
- NYSE
Solarwinds Inc
COMPUTER SOFTWARE & SERVICES - Application Software
|
$19.84
|
+0.23
|
474,060
88% DAV
539,200
|
9/30/2029
(Date
Featured) |
$22.03
(Price
Featured) |
PP = $21.72 |
G |
| MB = $22.81 |
Most Recent Note - 10/23/2009 5:20:46 PM
G - Halted its slide this week but failed to rebound after gaps down on 10/20 & 10/21 for considerable losses with heavy volume violated its 50 DMA line and recent chart lows in the $20.50 area, triggering technical sell signals. Its color code was changed to green based on the weakness, and it would need to promptly repair its 50 DMA violation for its outlook to improve. This high-ranked Computer Software - Enterprise firm was featured in the October 2009 issue of CANSLIM.net News (read here).
>>> The latest Featured Stock Update with an annotated graph appeared on 10/20/2009. click here.
|
|
C
A
S
I |
News |
Chart |
SEC
View all notes Alert
me of new notes
Company
Profile
|
WNS
- NYSE
W N S Holdings Ltd Ads
DIVERSIFIED SERVICES - Business/Management Services
|
$15.65
|
-0.20
|
35,420
60% DAV
58,600
|
9/28/2009
(Date
Featured) |
$15.28
(Price
Featured) |
PP = $16.10 |
G |
| MB = $16.91 |
Most Recent Note - 10/23/2009 5:24:08 PM
G - Closed the week just above its 50 DMA line after distributional pressure raised concerns and technically negated its 10/16/09 breakout. Featured in yellow in the 9/28/09 mid-day report (read here). Quarterly earnings have been above the +25% guideline and its annual earnings history has been great, satisfying the C & A criteria. However, sales revenues growth has decelerated.
>>> The latest Featured Stock Update with an annotated graph appeared on 10/16/2009. click here.
|
|
C
A
S
I |
News |
Chart |
SEC
View all notes Alert
me of new notes
Company
Profile
|
|
|
|
THESE ARE NOT BUY RECOMMENDATIONS!
Comments contained in the body of this report are technical
opinions only. The material herein has been obtained
from sources believed to be reliable and accurate, however,
its accuracy and completeness cannot be guaranteed.
This site is not an investment advisor, hence it does
not endorse or recommend any securities or other investments.
Any recommendation contained in this report may not
be suitable for all investors and it is not to be deemed
an offer or solicitation on our part with respect to
the purchase or sale of any securities. All trademarks,
service marks and trade names appearing in this report
are the property of their respective owners, and are
likewise used for identification purposes only.
This report is a service available
only to active Paid Premium Members.
You may opt-out of receiving report notifications
at any time. Questions or comments may be submitted
by writing to Premium Membership Services 665 S.E. 10 Street, Suite 201 Deerfield Beach, FL 33441-5634 or by calling 1-800-965-8307
or 954-785-1121.
|
|
|


