You are not logged in.
This means you
CAN ONLY VIEW reports that were published prior to Wednesday, March 19, 2025.
You
MUST UPGRADE YOUR MEMBERSHIP if you want to see any current reports.
AFTER MARKET UPDATE - WEDNESDAY, OCTOBER 22ND, 2014
Previous After Market Report Next After Market Report >>>
|
|
|
|
DOW |
-153.49 |
16,461.32 |
-0.92% |
|
Volume |
779,352,030 |
-2% |
|
Volume |
1,819,177,960 |
-0% |
|
NASDAQ |
-36.63 |
4,382.85 |
-0.83% |
|
Advancers |
946 |
30% |
|
Advancers |
732 |
26% |
|
S&P 500 |
-14.17 |
1,927.11 |
-0.73% |
|
Decliners |
2,144 |
67% |
|
Decliners |
2,040 |
72% |
|
Russell 2000 |
-15.98 |
1,096.87 |
-1.44% |
|
52 Wk Highs |
99 |
|
|
52 Wk Highs |
56 |
|
|
S&P 600 |
-7.76 |
634.63 |
-1.21% |
|
52 Wk Lows |
26 |
|
|
52 Wk Lows |
35 |
|
|
 |
Major Averages Pulled Back With Slightly Less Volume
Kenneth J. Gruneisen - Passed the CAN SLIM® Master's Exam
Stocks declined on Wednesday in another volatile trading session. The Dow erased an early gain of as many as 39 points and finished lower by 153 points at 16,461. The S&P 500, which rose as many as 8 points, closed down 14 points to 1,927. The NASDAQ fell 36 points to 4,382. Volume totals were reported slightly lower than the prior session totals. Breadth was negative as decliners led advancers by more than a 2-1 margin on the NYSE and by nearly 3-1 on the Nasdaq exchange. Leadership expanded as there were 47 high-ranked companies from the CANSLIM.net Leaders List that made new 52-week highs and appeared on the CANSLIM.net BreakOuts Page, up from the prior session total of 27 stocks. New 52-week highs outnumbered new 52-week lows on the NYSE and on the Nasdaq exchange. There were gains for 2 of the 6 high-ranked companies currently included on the Featured Stocks Page. Disciplined investors know that new buying efforts may be made under the fact-based investment system only in stocks meeting all key criteria.
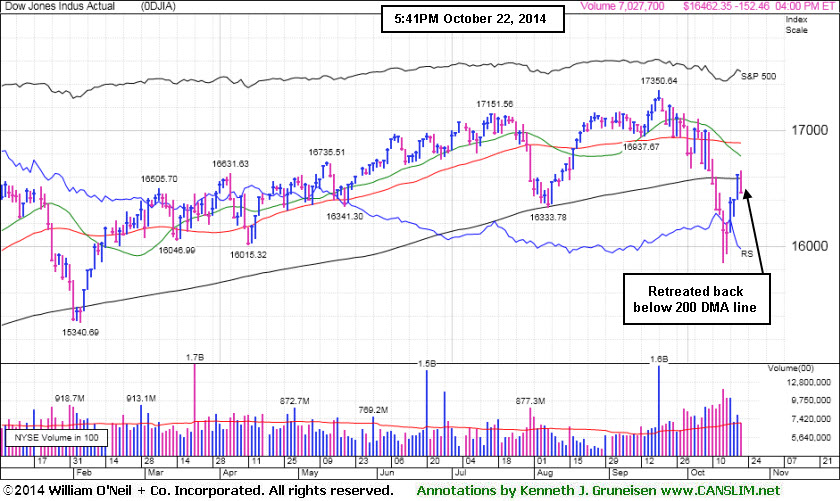
PICTURED: The Dow Jones Industrial Average fell back below its 200-day moving average (DMA) line.
The major averages retreated as a drop in WTI crude to a two-year low pushed energy stocks lower. Schlumberger (SLB -1.76%) and shares of EOG Resources (EOG -4.12%) fell. At the close eight of the 10 sectors in the S&P 500 were in negative territory. Materials and industrials were also notable decliners. Dow Chemical (DOW -1.24%) fell after disappointing third-quarter earnings results. Boeing (BA -4.46%) sank as concerns over the costs of airplane production overshadowed a positive earnings report. The typically defensive utilities and consumer staples groups were relative outperformers. NRG Energy (NRG +1.99%) and PepsiCo (PEP +0.78%) gained.
Yahoo!,(YHOO +4.53%) and Broadcom (BRCM +5.46%).posted big gains following earnings reports, meanwhile Discover Financial (DFS -5.23%) fell, After the close a notable earnings announcement was expected from AT&T (T -0.35%).
On the economic front consumer prices in September unexpectedly rose by 0.1%, after falling by 0.2% in August. Treasuries were little changed. The benchmark 10-year note was virtually unchanged to yield 2.22%. The 30-year bond declined 3/32 to yield 3.00%.
Large gains on Tuesday backed by higher volume totals while leadership (stocks hitting new 52-week highs) expanded met the definition of a "follow-through day" confirming a new uptrend for the market (M criteria). The S&P 500 Index and the Nasdaq Composite Index both remained above their respective 200-day moving average (DMA) lines following Wednesday's retreat, but the Dow Jones Industrial Average slumped back below its 200 DMA line.
The CANSLIM.net Featured Stocks Page shows the most action-worthy candidates and their latest notes and a Headline Link directs members to the latest detailed analysis with data-packed graphs annotated by a Certified expert along with links to additional resources. The Premium Member Homepage includes "dynamic archives" to all prior pay reports published.
|
 Kenneth J. Gruneisen started out as a licensed stockbroker in August 1987, a couple of months prior to the historic stock market crash that took the Dow Jones Industrial Average down -22.6% in a single day. He has published daily fact-based fundamental and technical analysis on high-ranked stocks online for two decades. Through FACTBASEDINVESTING.COM, Kenneth provides educational articles, news, market commentary, and other information regarding proven investment systems that work in good times and bad.
Comments contained in the body of this report are technical opinions only and are not necessarily those of Gruneisen Growth Corp. The material herein has been obtained from sources believed to be reliable and accurate, however, its accuracy and completeness cannot be guaranteed. Our firm, employees, and customers may effect transactions, including transactions contrary to any recommendation herein, or have positions in the securities mentioned herein or options with respect thereto. Any recommendation contained in this report may not be suitable for all investors and it is not to be deemed an offer or solicitation on our part with respect to the purchase or sale of any securities. |
|
 |
Commodity-Linked Groups Led Broad Retreat
Kenneth J. Gruneisen - Passed the CAN SLIM® Master's Exam
Commodity-linked groups suffered the largest losses on Wednesday as the Gold & Silver Index ($XAU -3.58%), Oil Services Index ($OSX -3.07%), and the Integrated Oil Index ($XOI -1.70%) fell. The Broker/Dealer Index ($XBD -1.58%) outpaced the Bank Index ($BKX -0.74%) to the downside while a loss for the Retail Index ($RLX -0.79%) also created a drag on the major averages. The Networking Index ($NWX -1.74%) and Semiconductor Index ($SOX -1.37%) both dragged the tech sector lower while the Biotechnology Index ($BTK -0.27%) ended the session with a smaller loss.
Charts courtesy www.stockcharts.com
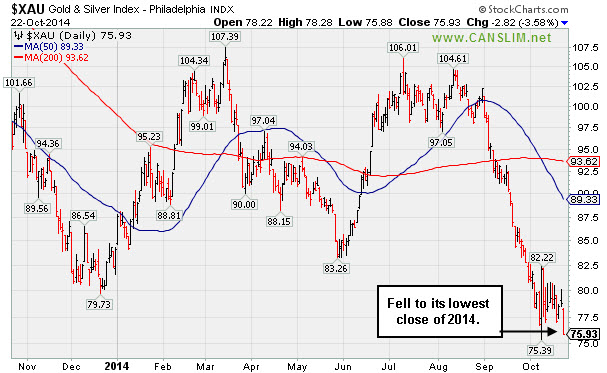
PICTURED: The Gold & Silver Index ($XAU -3.58%) fell to its lowest close of 2014.
| Oil Services |
$OSX |
243.74 |
-7.73 |
-3.07% |
-13.27% |
| Integrated Oil |
$XOI |
1,435.92 |
-24.79 |
-1.70% |
-4.47% |
| Semiconductor |
$SOX |
596.93 |
-8.32 |
-1.37% |
+11.57% |
| Networking |
$NWX |
298.45 |
-5.28 |
-1.74% |
-7.87% |
| Broker/Dealer |
$XBD |
162.20 |
-2.61 |
-1.58% |
+1.02% |
| Retail |
$RLX |
921.79 |
-7.31 |
-0.79% |
-1.92% |
| Gold & Silver |
$XAU |
75.93 |
-2.82 |
-3.58% |
-9.77% |
| Bank |
$BKX |
68.11 |
-0.51 |
-0.74% |
-1.66% |
| Biotech |
$BTK |
3,122.96 |
-8.42 |
-0.27% |
+34.01% |
|
|
|
 |
Breakout Cleared "Double Bottom" Base Pattern
Kenneth J. Gruneisen - Passed the CAN SLIM® Master's Exam
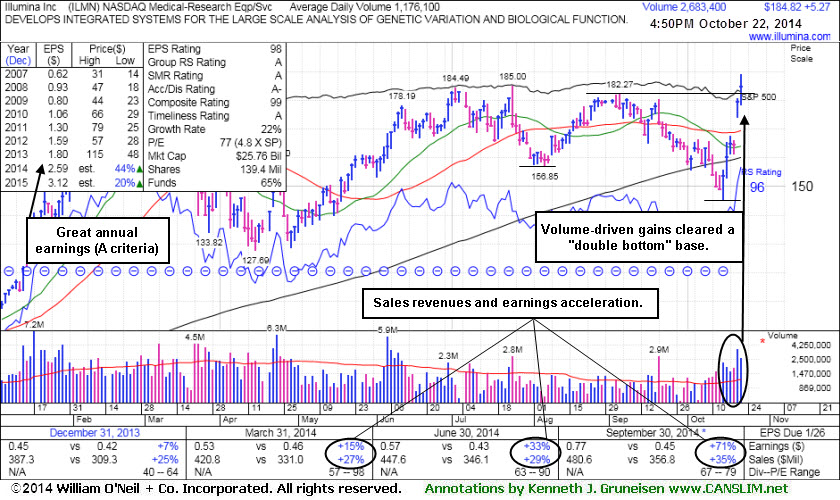
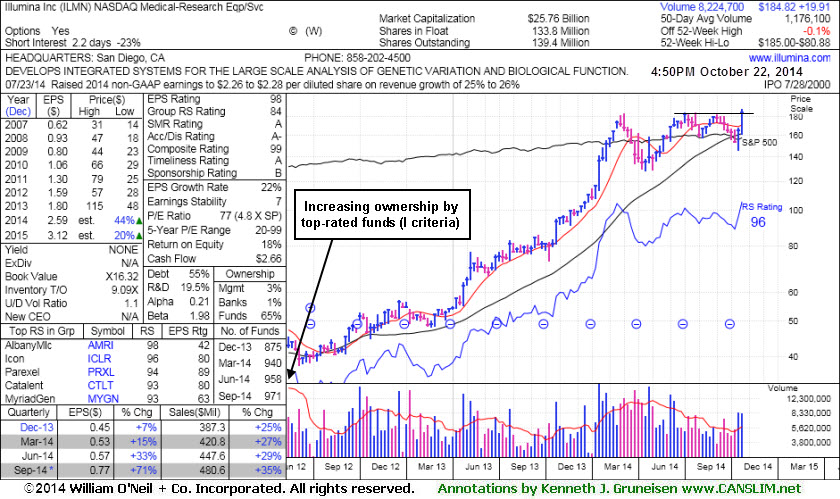
Illumina Inc (ILMN +$5.27 or +2.94% to $184.82) was highlighted in yellow in the earlier mid-day report (read here) with pivot point cited based on its 9/04/14 high in a "double bottom" base pattern. The considerable volume-driven gain added to its winning streak and triggered a technical buy signal while it hit a new 52-week high today, clearing previously stubborn resistance in the $182-185 area. Disciplined investors avoid chasing stocks more than +5% above prior highs, and they always limit losses by selling any stock that falls more than -7% from their purchase price.
This Medical - Research Equipment/Services firm reported earnings +71% on +35% sales revenues for the Sep '14 quarter, its 2nd consecutive quarterly comparison with earnings above the +25% minimum guideline (C criteria). Sequential quarterly comparisons show encouraging sales revenues and earnings acceleration. Its current Relative Strength (RS) rank of 96 is well above the 80+ minimum guideline for buy candidates. Historic examples of the market's biggest winners typically showed their relative strength lines (the jagged blue line) usually spiked to new highs ahead of, or while the stock was making new highs. In this case, however, its RS line peaked a bit higher in February of 2014. Its annual earnings (A criteria) growth history has improved steadily since a downturn in FY '09.
ILMN endured deep consolidations below its 200-day moving average (DMA) line then made impressive progress since last shown in this FSU section on 6/12/09 with annotated graphs under the headline, "Sinking RS Rating Indicates Mediocre Price Performance". when the company began offering a new high-quality personal genome sequencing for consumers.
|
|
|
Color Codes Explained :
Y - Better candidates highlighted by our
staff of experts.
G - Previously featured
in past reports as yellow but may no longer be buyable under the
guidelines.
***Last / Change / Volume data in this table is the closing quote data***
Symbol/Exchange
Company Name
Industry Group |
PRICE |
CHANGE
(%Change) |
Day High |
Volume
(% DAV)
(% 50 day avg vol) |
52 Wk Hi
% From Hi |
Featured
Date |
Price
Featured |
Pivot Featured |
|
Max Buy |
ACT
-
NYSE
Actavis plc
Medical-Generic Drugs
|
$231.41
|
-0.72
-0.31% |
$235.83
|
1,647,218
74.27% of 50 DAV
50 DAV is 2,218,000
|
$249.94
-7.41%
|
6/20/2014
|
$216.53
|
PP = $230.87
|
|
MB = $242.41
|
Most Recent Note - 10/21/2014 6:12:28 PM
Y - Color code is changed to yellow after rebounding above its 50 DMA line today helping its outlook improve. Found support at its 200 DMA line following damaging losses marked by volume. See the latest FSU analysis for more details and new annotated graphs.
>>> FEATURED STOCK ARTICLE : Quiet Gains Help Generic Drug Firm Rise Above 50-Day Average - 10/21/2014
View all notes |
Set NEW NOTE alert |
CANSLIM.net Company Profile |
SEC
News |
Chart |
Request a new note
C
A N
S L
I M


|
AFSI
-
NASDAQ
Amtrust Financial Svcs
INSURANCE - Property and; Casualty Insurance
|
$49.96
|
+0.01
0.02% |
$51.08
|
1,823,014
262.30% of 50 DAV
50 DAV is 695,000
|
$50.00
-0.08%
|
10/17/2014
|
$45.24
|
PP = $46.02
|
|
MB = $48.32
|
 Most Recent Note - 10/22/2014 12:06:41 PM
G - Rallying further above its "max buy" level with today's 5th consecutive volume-driven gain. Finished at the session high with a gap up and considerable volume-driven gain on the prior session triggering a technical buy signal. Prior highs in the $46-47 area define support to watch on pullbacks.
>>> FEATURED STOCK ARTICLE : Perched Near High After Rebounding From 200-Day Average - 10/17/2014
View all notes |
Set NEW NOTE alert |
CANSLIM.net Company Profile |
SEC
News |
Chart |
Request a new note
C
A N
S L
I M
|
FB
-
NASDAQ
Facebook Inc Cl A
INTERNET
|
$78.37
|
-0.32
-0.41% |
$79.85
|
41,742,043
121.50% of 50 DAV
50 DAV is 34,357,000
|
$79.71
-1.68%
|
9/9/2014
|
$76.67
|
PP = $76.84
|
|
MB = $80.68
|
Most Recent Note - 10/21/2014 6:05:13 PM
Y - Wedged near its 52-week high with below average volume behind today's gain. Rebound above the 50 DMA line ($75.83) helped its outlook improve and its color code was changed to yellow.
>>> FEATURED STOCK ARTICLE : Volume-Driven Losses Triggered Sell Signals After Slumping Into Prior Base - 10/16/2014
View all notes |
Set NEW NOTE alert |
CANSLIM.net Company Profile |
SEC
News |
Chart |
Request a new note
C
A N
S L
I M
|
ILMN
-
NASDAQ
Illumina Inc
DRUGS - Biotechnology
|
$184.82
|
+5.27
2.94% |
$188.98
|
2,683,430
228.18% of 50 DAV
50 DAV is 1,176,000
|
$185.00
-0.10%
|
10/22/2014
|
$188.77
|
PP = $182.27
|
|
MB = $191.38
|
Most Recent Note - 10/22/2014 6:01:20 PM
Y - Triggered a technical buy signal and it was highlighted in yellow in the earlier mid-day report (read here) with pivot point cited based on its 9/04/14 high in a "double bottom" base pattern. Considerable volume-driven gain hit a new 52-week high while clearing previously stubborn resistance in the $182-185 area. Reported earnings +71% on +35% sales revenues for the Sep '14 quarter, its 2nd consecutive quarterly comparison with earnings above the +25% minimum guideline (C criteria). Sequential quarterly comparisons show encouraging sales revenues and earnings acceleration. See the latest FSU analysis for more details and new annotated graphs.
>>> FEATURED STOCK ARTICLE : Breakout Cleared "Double Bottom" Base Pattern - 10/22/2014
View all notes |
Set NEW NOTE alert |
CANSLIM.net Company Profile |
SEC
News |
Chart |
Request a new note
C
A N
S L
I M
|
PANW
-
NYSE
Palo Alto Networks
Computer Sftwr-Security
|
$102.58
|
-2.10
-2.01% |
$105.61
|
1,806,968
82.36% of 50 DAV
50 DAV is 2,194,000
|
$106.79
-3.94%
|
7/30/2014
|
$84.21
|
PP = $85.88
|
|
MB = $90.17
|
Most Recent Note - 10/22/2014 6:02:41 PM
G - Small loss today on lighter volume broke a streak of 6 consecutive gains. Recent low ($87.83 on 10/13/14) and 50 DMA line define important near-term support where violations would trigger technical sell signals.
>>> FEATURED STOCK ARTICLE : Prompt Rebound Above 50-Day Average an Encouraging Sign of Support - 10/14/2014
View all notes |
Set NEW NOTE alert |
CANSLIM.net Company Profile |
SEC
News |
Chart |
Request a new note
C
A N
S L
I M
|
Symbol/Exchange
Company Name
Industry Group |
PRICE |
CHANGE
(%Change) |
Day High |
Volume
(% DAV)
(% 50 day avg vol) |
52 Wk Hi
% From Hi |
Featured
Date |
Price
Featured |
Pivot Featured |
|
Max Buy |
STRT
-
NASDAQ
Strattec Security Corp
AUTOMOTIVE - Auto Parts
|
$82.31
|
-0.51
-0.62% |
$83.30
|
15,694
65.39% of 50 DAV
50 DAV is 24,000
|
$89.87
-8.42%
|
9/19/2014
|
$86.06
|
PP = $89.97
|
|
MB = $94.47
|
Most Recent Note - 10/21/2014 6:08:10 PM
Y - Consolidating above its 50 DMA line where it found prompt support. Recent low ($72.13 on 10/15/14) defines important near-term support to watch. Reporting Sep '14 quarterly earnings on Thursday.
>>> FEATURED STOCK ARTICLE : Building Base-On-Base Pattern Ahead of Earnings News - 10/20/2014
View all notes |
Set NEW NOTE alert |
CANSLIM.net Company Profile |
SEC
News |
Chart |
Request a new note
C
A N
S L
I M
|
|
|
|
THESE ARE NOT BUY RECOMMENDATIONS!
Comments contained in the body of this report are technical
opinions only. The material herein has been obtained
from sources believed to be reliable and accurate, however,
its accuracy and completeness cannot be guaranteed.
This site is not an investment advisor, hence it does
not endorse or recommend any securities or other investments.
Any recommendation contained in this report may not
be suitable for all investors and it is not to be deemed
an offer or solicitation on our part with respect to
the purchase or sale of any securities. All trademarks,
service marks and trade names appearing in this report
are the property of their respective owners, and are
likewise used for identification purposes only.
This report is a service available
only to active Paid Premium Members.
You may opt-out of receiving report notifications
at any time. Questions or comments may be submitted
by writing to Premium Membership Services 665 S.E. 10 Street, Suite 201 Deerfield Beach, FL 33441-5634 or by calling 1-800-965-8307
or 954-785-1121.
|
|
|

