You are not logged in.
This means you
CAN ONLY VIEW reports that were published prior to Monday, April 14, 2025.
You
MUST UPGRADE YOUR MEMBERSHIP if you want to see any current reports.
AFTER MARKET UPDATE - THURSDAY, OCTOBER 22ND, 2009
Previous After Market Report Next After Market Report >>>
|
|
|
|
DOW |
+131.95 |
10,081.31 |
+1.33% |
|
Volume |
1,314,663,000 |
-6% |
|
Volume |
2,326,404,780 |
-12% |
|
NASDAQ |
+14.56 |
2,165.29 |
+0.68% |
|
Advancers |
2,044 |
65% |
|
Advancers |
1,695 |
60% |
|
S&P 500 |
+11.51 |
1,092.91 |
+1.06% |
|
Decliners |
987 |
32% |
|
Decliners |
1,008 |
36% |
|
Russell 2000 |
+8.27 |
613.38 |
+1.37% |
|
52 Wk Highs |
151 |
|
|
52 Wk Highs |
52 |
|
|
S&P 600 |
+3.97 |
323.94 |
+1.24% |
|
52 Wk Lows |
5 |
|
|
52 Wk Lows |
11 |
|
|
 |
Economic And Earnings News Helps Indices Rebound On Lighter Volume
Adam Sarhan, Contributing Writer,
A series of stronger than expected economic and earnings data helped lift the market on Thursday. However, volume was lighter than the prior session on both exchanges which is the opposite of what bullish investors would like to see- higher volume advances and lower volume declines. Advancers led decliners by a 2-to-1 ratio on the NYSE and by better than a 3-to-2 ratio on the Nasdaq exchange. There were only 9 high-ranked companies from the CANSLIM.net Leaders List, making a new 52-week high and appearing on the CANSLIM.net BreakOuts Page, sharply lower than the 38 issues that appeared on the prior session. New 52-week highs still substantially outnumbered new 52-week lows on both major exchanges.
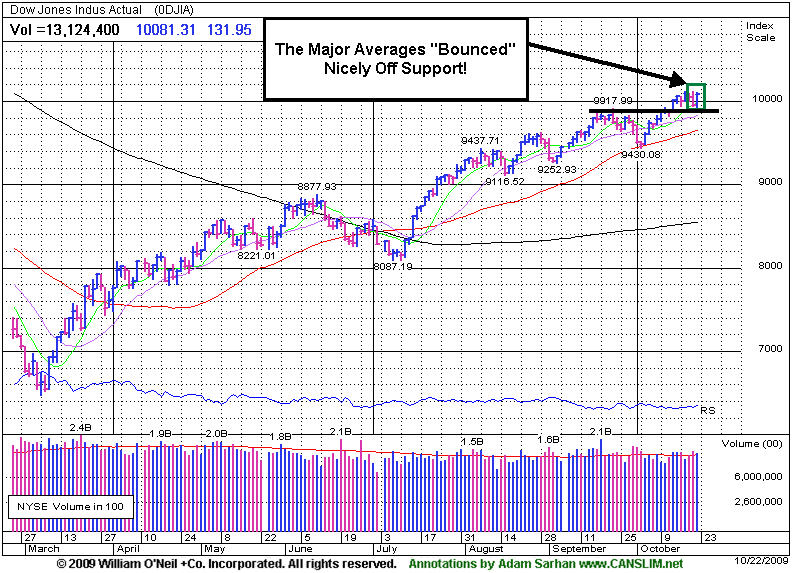
It was very encouraging to see the major averages quickly recover and close near their intra-day highs after Wednesday's ominous negative reversal. A batch of healthy economic and earnings data saved the day on Thursday and played a pivotal role in sending the market higher. Well known companies like Travelers Cos. (TRV +7.66%), McDonald’s Corp. (MCD +2.01%) and American Express (AXP +3.82%) fueled the recovery thesis that the worst recession since the 1930s is behind us.
On the economic front, the Labor Department reported that initial jobless claims rose to 531,000 last week which was exceeded the average estimate by 16,000. A separate report showed home prices unexpectedly slid which sent a flurry of homebuilders higher. The underlying theme is that lower home prices will spark demand which in turn will help increase revenues for these companies. Finally, the Conference Board released said its index of leading economic indicators grew for a sixth consecutive month which is a healthy economic data point.
So far, approximately +79% of the companies in the S&P 500 Index that have reported Q3 results have topped estimates, which would mark the highest rate since 1993! Overseas, China’s economy grew by its fastest pace in a year as stimulus spending and record lending growth helped the nation lead the world out of recession. The stronger-than-expected growth rate sparked concerns that Beijing would curb their fiscal and monetary measures in the near future. China's Gross domestic product surged +8.9% in the third quarter from the same period last year.
PICTURED: The Dow Jones Industrial Average (and the other popular market averages) bounced off support today!
|
|
|
 |
Financial Group Shows Encouraging Resilience
Kenneth J. Gruneisen - Passed the CAN SLIM® Master's Exam
The Broker/Dealer Index ($XBD +2.50%) posted a gain and the Bank Index ($BKX +3.35%) rallied to repair the prior session's 50-day moving average violation as the broader market rallied on Thursday. The Retail Index ($RLX +1.67%) and tech indexes finished unanimously higher as the Biotechnology Index ($BTK +0.55%), Networking Index ($NWX +0.72%), Internet Index ($IIX +1.17%), and Semiconductor Index ($SOX +1.29%) posted gains. The Healthcare Index ($HMO +2.16%) also posted a solid gain. Strength in energy-related shares gave both the Integrated Oil Index ($XOI +0.99%) and Oil Services Index ($OSX +1.41%) a small boost. Meanwhile, the Gold & Silver Index ($XAU -0.13%), a good proxy for another popular defensive "safe haven" area, lagged.
Charts courtesy www.stockcharts.com
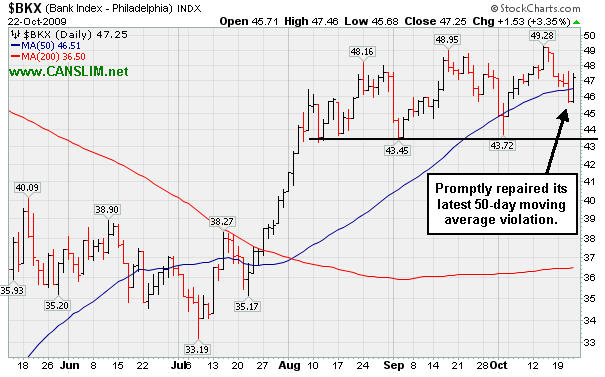
PICTURED: The Bank Index ($BKX +3.35%) promptly repaired its latest 50-day moving average (DMA) line, which was a somewhat encouraging sign. Upon a subsequent breach of that important short-term average, its September and October lows are the next chart support level of concern.
| Oil Services |
$OSX |
210.76 |
+2.93 |
+1.41% |
+73.62% |
| Healthcare |
$HMO |
1,154.58 |
+24.46 |
+2.16% |
+20.25% |
| Integrated Oil |
$XOI |
1,121.09 |
+10.95 |
+0.99% |
+14.43% |
| Semiconductor |
$SOX |
326.84 |
+4.17 |
+1.29% |
+54.05% |
| Networking |
$NWX |
237.47 |
+1.70 |
+0.72% |
+65.04% |
| Internet |
$IIX |
223.75 |
+2.59 |
+1.17% |
+67.26% |
| Broker/Dealer |
$XBD |
121.96 |
+2.98 |
+2.50% |
+57.43% |
| Retail |
$RLX |
389.68 |
+6.40 |
+1.67% |
+39.54% |
| Gold & Silver |
$XAU |
174.12 |
-0.22 |
-0.13% |
+40.59% |
| Bank |
$BKX |
47.25 |
+1.53 |
+3.35% |
+6.61% |
| Biotech |
$BTK |
898.76 |
+4.92 |
+0.55% |
+38.88% |
|
|
|
 |
Aeropostale Bounced At 50-Day Moving Average Line
Kenneth J. Gruneisen - Passed the CAN SLIM® Master's Exam
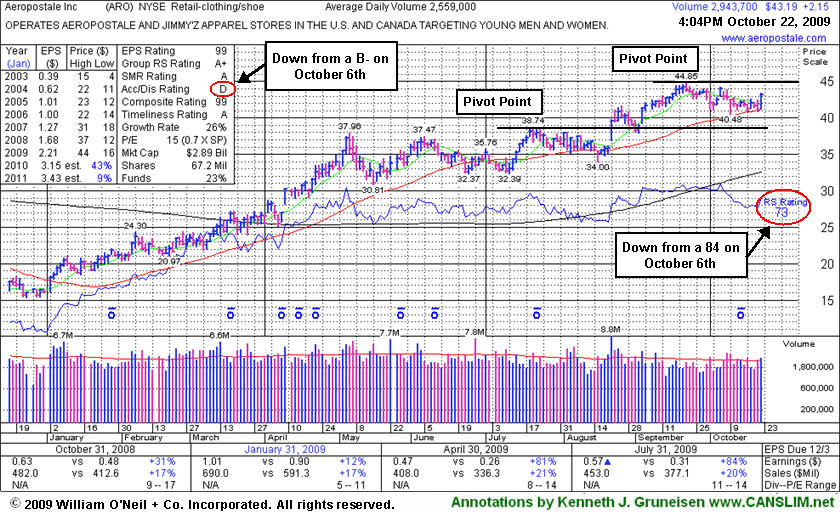
Aeropostale Inc. (ARO +$1.58 or +3.59% to $44.05) posted a solid gain today with slightly higher volume, which helped it rally up from support at its 50-day moving average (DMA) line. Additional analysis in response to a member inquiry was included in the "Ken's Mailbag" section of the 10/21/09 After-Market Update (read here). Its color code was changed to yellow again, and new pivot point and max buy levels have just been noted. It appears to be building a new flat base while finding support at its 50 DMA line, its short-term average which has been enduring its first test since its latest sound breakout occurred. A more serious 50 DMA line violation could subsequently raise concerns and trigger a technical sell signal, with the next important chart support level being its prior highs in the $38 area.
This high-ranked leader in the Retail - Clothing/shoe group has encountered some very obvious distributional pressure in recent weeks. Its Accumulation/Distribution rank (see red circle on left) has slumped to a D from a B- on October 6th, when it last appeared in this FSU section. Its Relative Strength rank (see the larger red circle on the right) also fell to 72 from 84 over that same time frame, indicating its relative under-performance in recent weeks. ARO was featured in yellow with new pivot point and max buy levels noted in the 8/21/09 Mid-Day BreakOuts Report (read here). It has a great annual earnings history (the A criteria), and the 2 latest quarterly comparisons showed +81% and +84% earnings increases, well above the investment system's +25% guideline. The number of top-rated funds owning an interest in its shares rose from 207 in Dec '08 to 238 in Jun '09, which is good news concerning the I criteria.
|
|
|
Color Codes Explained :
Y - Better candidates highlighted by our
staff of experts.
G - Previously featured
in past reports as yellow but may no longer be buyable under the
guidelines.
***Last / Change / Volume quote data in this table corresponds with the timestamp on the note***
Symbol/Exchange
Company Name
Industry Group |
Last |
Chg. |
Vol
% DAV |
Date Featured |
Price Featured |
Latest Pivot Point
Featured |
Status |
| Latest Max Buy Price |
ARO
- NYSE
Aeropostale Inc
RETAIL - Apparel Stores
|
$43.19
|
+2.15
|
2,947,067
115% DAV
2,552,300
|
8/21/2009
(Date
Featured) |
$39.21
(Price
Featured) |
PP = $44.95 |
Y |
| MB = $47.20 |
Most Recent Note - 10/22/2009 5:44:55 PM
Y - A solid gain today with slightly higher volume helped it rally up from support at its 50 DMA line. Additional analysis in response to a member inquiry was included in the "Ken's Mailbag" section of the 10/21/09 After-Market Update (read here). Its color code was changed to yellow again, and new pivot point and max buy levels are being noted. A more serious 50 DMA line violation could subsequently raise concerns and trigger a technical sell signal. The next key chart support level is prior highs in the $38 area. It was featured in yellow in the 8/21/09 Mid-Day BreakOuts Report (read here).
>>> The latest Featured Stock Update with an annotated graph appeared on 10/22/2009. click here.
|
|
C
A
S
I |
News |
Chart |
SEC
View all notes Alert
me of new notes
Company
Profile
|
ARST
-
|
$24.73
|
-0.12
|
560,066
85% DAV
660,600
|
9/1/2009
(Date
Featured) |
$19.91
(Price
Featured) |
PP = $20.90 |
G |
| MB = $21.95 |
Most Recent Note - 10/22/2009 4:16:48 PM
G - Consolidating in a tight range above prior chart highs after rallying from a base-on-base type pattern, but extended from its 9/04/09 "late stage" breakout. ARST was first featured in yellow at $19.91 in the 9/01/09 mid-day report with an annotated daily graph (read here).
>>> The latest Featured Stock Update with an annotated graph appeared on 10/21/2009. click here.
|
|
C
A
S
I |
News |
Chart |
SEC
View all notes Alert
me of new notes
Company
Profile
|
ASIA
-
|
$22.80
|
-0.18
|
965,587
122% DAV
793,200
|
10/14/2009
(Date
Featured) |
$23.05
(Price
Featured) |
PP = $22.19 |
Y |
| MB = $23.30 |
Most Recent Note - 10/22/2009 4:23:37 PM
Y - Today was its 3rd consecutive small loss on slightly higher than average volume. While consolidating above its pivot point but below its "max buy" level its color code was changed to yellow again. Prior chart highs in the $21-22 area are important support to watch on pullbacks. It was highlighted in yellow in the 10/14/09 mid-day report (read here) as it gapped up for a new 52-week high with 5 times average volume, triggering a technical buy signal by blasting above its pivot point. First featured in the August 2009 CANSLIM.net News (read here).
>>> The latest Featured Stock Update with an annotated graph appeared on 10/14/2009. click here.
|
|
C
A
S
I |
News |
Chart |
SEC
View all notes Alert
me of new notes
Company
Profile
|
BIDU
- NASDAQ
Baidu Inc Ads
INTERNET - Internet Information Providers
|
$415.60
|
+9.68
|
1,265,005
69% DAV
1,837,100
|
9/8/2009
(Date
Featured) |
$351.80
(Price
Featured) |
PP = $368.59 |
G |
| MB = $387.02 |
Most Recent Note - 10/22/2009 4:28:51 PM
G - Quietly consolidating after recent gains challenged its 2007 all-time high of $429. It is extended from a proper buy point under the investment system guidelines and now up $63.80 (+18%) from when BIDU was featured in yellow in the 9/08/09 Mid-Day BreakOuts Report (read here).
>>> The latest Featured Stock Update with an annotated graph appeared on 10/7/2009. click here.
|
|
C
A
S
I |
News |
Chart |
SEC
View all notes Alert
me of new notes
Company
Profile
|
CACC
- NASDAQ
Credit Acceptance Corp
FINANCIAL SERVICES - Credit Services
|
$36.57
|
+0.68
|
19,568
47% DAV
41,900
|
9/29/2009
(Date
Featured) |
$33.48
(Price
Featured) |
PP = $32.60 |
G |
| MB = $34.23 |
Most Recent Note - 10/22/2009 4:32:03 PM
G - Quietly consolidating and stubbornly holding its ground near all-time highs. Prior chart highs in the $32 area are important support to watch on pullbacks. The Finance - Consumer/Commercial Loans firm has maintained a great track record of annual and quarterly sales revenues and earnings increases. It was featured on 9/29/09 in yellow in the mid-day report (read here).
>>> The latest Featured Stock Update with an annotated graph appeared on 10/15/2009. click here.
|
|
C
A
S
I |
News |
Chart |
SEC
View all notes Alert
me of new notes
Company
Profile
|
CRM
- NYSE
Salesforce.com Inc
INTERNET - Internet Software & Services
|
$62.67
|
-0.82
|
1,019,201
49% DAV
2,068,600
|
8/16/2009
(Date
Featured) |
$47.12
(Price
Featured) |
PP = $45.59 |
G |
| MB = $47.87 |
Most Recent Note - 10/22/2009 4:33:21 PM
G - Pulled back on light volume today following its gain on 10/21/09 for a new 2009 high. It is extended from any sound base. Technical support to watch now is prior chart highs in the $59 area which coincide with an upward trendline connecting its July, August and October chart lows, both just above additional support at its 50 DMA line.
>>> The latest Featured Stock Update with an annotated graph appeared on 10/5/2009. click here.
|
|
C
A
S
I |
News |
Chart |
SEC
View all notes Alert
me of new notes
Company
Profile
|
EBIX
- NASDAQ
Ebix Inc
COMPUTER SOFTWARE & SERVICES - Business Software & Services
|
$65.75
|
+2.81
|
242,562
117% DAV
207,100
|
8/28/2009
(Date
Featured) |
$45.86
(Price
Featured) |
PP = $45.35 |
G |
| MB = $47.62 |
Most Recent Note - 10/22/2009 4:35:23 PM
G - Gain today on near average volume for a new all-time high. It is very extended from any sound base, well above support at its 50 DMA line, and more than +94% above its 200 DMA line - all of which are reminders to be watchful for sell signals.
>>> The latest Featured Stock Update with an annotated graph appeared on 10/13/2009. click here.
|
|
C
A
S
I |
News |
Chart |
SEC
View all notes Alert
me of new notes
Company
Profile
|
GMCR
- NASDAQ
Green Mtn Coffee Roastrs
FOOD & BEVERAGE - Processed & Packaged Goods
|
$74.22
|
-0.69
|
866,939
69% DAV
1,252,900
|
10/5/2009
(Date
Featured) |
$71.11
(Price
Featured) |
PP = $75.89 |
Y |
| MB = $79.68 |
Most Recent Note - 10/22/2009 4:40:13 PM
Y - Today was its second consecutive loss on lighter volume as it sank further below its recently cited pivot point, raising some concerns. On 10/19/09 it rallied above is pivot point with +57% above average volume, barely meeting the minimum guideline needed to trigger a proper technical buy signal. Keep in mind this may be considered a 3rd or 4th stage base, and thus more failure prone, meanwhile its earlier breakouts were backed by far more impressive volume.
>>> The latest Featured Stock Update with an annotated graph appeared on 10/12/2009. click here.
|
|
C
A
S
I |
News |
Chart |
SEC
View all notes Alert
me of new notes
Company
Profile
|
PEGA
- NASDAQ
Pegasystems Inc
COMPUTER SOFTWARE & SERVICES - Business Software & Services
|
$33.72
|
+0.01
|
216,990
67% DAV
323,700
|
9/9/2009
(Date
Featured) |
$31.14
(Price
Featured) |
PP = $33.35 |
Y |
| MB = $35.02 |
Most Recent Note - 10/22/2009 4:43:56 PM
Y - Positively reversed today and closed near its session high after a small gap down. Consolidating in a tight trading range near its all-time high and just above its 50 DMA line. That short-term average and its upward trendline are important technical support levels to watch. This high-ranked Computer Software - Financial firm found support near its 50 DMA line on recent pullbacks.
>>> The latest Featured Stock Update with an annotated graph appeared on 10/8/2009. click here.
|
|
C
A
S
I |
News |
Chart |
SEC
View all notes Alert
me of new notes
Company
Profile
|
SWI
- NYSE
Solarwinds Inc
COMPUTER SOFTWARE & SERVICES - Application Software
|
$19.61
|
+0.10
|
888,323
171% DAV
518,000
|
9/30/2029
(Date
Featured) |
$22.03
(Price
Featured) |
PP = $21.72 |
G |
| MB = $22.81 |
Most Recent Note - 10/22/2009 4:47:53 PM
G - Halted its slide today after gaps down for losses on above average volume on the 2 prior sessions following its latest earnings report violated its 50 DMA line and recent chart lows in the $20.50 area, triggering technical sell signals. Its color code was changed to green based on the weakness, and it would need to promptly repair its 50 DMA violation for its outlook to improve. This high-ranked Computer Software - Enterprise firm was featured in the October 2009 issue of CANSLIM.net News (read here).
>>> The latest Featured Stock Update with an annotated graph appeared on 10/20/2009. click here.
|
|
C
A
S
I |
News |
Chart |
SEC
View all notes Alert
me of new notes
Company
Profile
|
WNS
- NYSE
W N S Holdings Ltd Ads
DIVERSIFIED SERVICES - Business/Management Services
|
$15.85
|
-0.23
|
97,038
169% DAV
57,300
|
9/28/2009
(Date
Featured) |
$15.28
(Price
Featured) |
PP = $16.10 |
G |
| MB = $16.91 |
Most Recent Note - 10/22/2009 4:55:34 PM
G - Closed near its session high after an intra-day 50 DMA line breach, yet it posted a 3rd consecutive loss on ever increasing volume. Recent action is indicative of distributional pressure and raised concerns by its close below its pivot point which negated its technical breakout after clearing stubborn $16 resistance last week. Featured in yellow in the 9/28/09 mid-day report (read here). Quarterly earnings have been above the +25% guideline and its annual earnings history has been great, satisfying the C & A criteria. However, sales revenues growth has decelerated.
>>> The latest Featured Stock Update with an annotated graph appeared on 10/16/2009. click here.
|
|
C
A
S
I |
News |
Chart |
SEC
View all notes Alert
me of new notes
Company
Profile
|
|
|
|
THESE ARE NOT BUY RECOMMENDATIONS!
Comments contained in the body of this report are technical
opinions only. The material herein has been obtained
from sources believed to be reliable and accurate, however,
its accuracy and completeness cannot be guaranteed.
This site is not an investment advisor, hence it does
not endorse or recommend any securities or other investments.
Any recommendation contained in this report may not
be suitable for all investors and it is not to be deemed
an offer or solicitation on our part with respect to
the purchase or sale of any securities. All trademarks,
service marks and trade names appearing in this report
are the property of their respective owners, and are
likewise used for identification purposes only.
This report is a service available
only to active Paid Premium Members.
You may opt-out of receiving report notifications
at any time. Questions or comments may be submitted
by writing to Premium Membership Services 665 S.E. 10 Street, Suite 201 Deerfield Beach, FL 33441-5634 or by calling 1-800-965-8307
or 954-785-1121.
|
|
|


