You are not logged in.
This means you
CAN ONLY VIEW reports that were published prior to Monday, April 14, 2025.
You
MUST UPGRADE YOUR MEMBERSHIP if you want to see any current reports.
AFTER MARKET UPDATE - FRIDAY, OCTOBER 21ST, 2011
Previous After Market Report Next After Market Report >>>
|
|
|
|
DOW |
+267.01 |
11,808.79 |
+2.31% |
|
Volume |
1,190,284,860 |
+24% |
|
Volume |
1,947,007,480 |
-2% |
|
NASDAQ |
+38.84 |
2,637.46 |
+1.49% |
|
Advancers |
2,628 |
85% |
|
Advancers |
1,953 |
74% |
|
S&P 500 |
+22.86 |
1,238.25 |
+1.88% |
|
Decliners |
392 |
13% |
|
Decliners |
561 |
21% |
|
Russell 2000 |
+16.00 |
712.42 |
+2.30% |
|
52 Wk Highs |
60 |
|
|
52 Wk Highs |
39 |
|
|
S&P 600 |
+8.79 |
392.99 |
+2.29% |
|
52 Wk Lows |
9 |
|
|
52 Wk Lows |
26 |
|
|
 |
Dow Finishes 4th Consecutive Week Higher
Kenneth J. Gruneisen - Passed the CAN SLIM® Master's Exam
For the week, the Dow Jones Industrial Average was up +1.4%, scoring a fourth straight winning week. The S&P 500 Index gained +1.1%, but the Nasdaq Composite Index was down -1.1% for the week. Friday the trading volume total reported on the NYSE was higher while volume was slightly lower on the Nasdaq exchange versus the prior session. Advancing issues beat decliners by more than 6-1 on the NYSE and by 3-1 on the Nasdaq exchange. New 52-week highs outnumbered new 52-week lows on the NYSE and on the Nasdaq exchange. There were 30 high-ranked companies from the CANSLIM.net Leaders List that made new 52-week highs and appeared on the CANSLIM.net BreakOuts Page, up sharply from the prior session total of 6 stocks. There were gains for 7 of the 9 high-ranked companies currently included on the Featured Stocks Page.

Wall Street ended the week with a strong rally, thanks to a healthy round of corporate earnings and high hopes for a debt agreement in Europe within the next week. Two Federal Reserve officials also said the Fed may consider another round of asset purchases to boost economic growth. Financial stocks, including Morgan Stanley (MS +2.47%), advanced following gains in European lenders.
Impressive profit reports ranged from restaurant chains to a key audio equipment maker, Harmon International Industries (HAR +20.55%). McDonald's Corp (MCD +3.72%) added 23 points to the Dow Jones Industrials while hitting an all-time high. Chipotle Mexican Grill Inc (CMG +8.31%) rose after raising prices, selling more burritos and opening new stores. Ford Motor Co (F +4.79%) rose after Standard & Poor's upgraded its credit rating on the automaker.
The October 2011 issue of our monthly newsletter CANSLIM.net News will be published soon. The Q3 2011 Webcast (aired on September 28th) is now available "ON DEMAND" - (CLICK HERE) It provides an informative review of current market conditions, leading groups, and best buy candidates. All upgraded members are eligible to access the webcast presentation at no additional cost! Via the Premium Member Homepage links to all prior reports and webcasts are always available.
PICTURED: The Dow Jones Industrial Average rallied above its prior high to it best level since 8/04/11 while approaching its 200-day moving average (DMA) line. Subsequent gains above that important long-term average would be a meaningful technical improvement in the market's health.
|
 Kenneth J. Gruneisen started out as a licensed stockbroker in August 1987, a couple of months prior to the historic stock market crash that took the Dow Jones Industrial Average down -22.6% in a single day. He has published daily fact-based fundamental and technical analysis on high-ranked stocks online for two decades. Through FACTBASEDINVESTING.COM, Kenneth provides educational articles, news, market commentary, and other information regarding proven investment systems that work in good times and bad.
Comments contained in the body of this report are technical opinions only and are not necessarily those of Gruneisen Growth Corp. The material herein has been obtained from sources believed to be reliable and accurate, however, its accuracy and completeness cannot be guaranteed. Our firm, employees, and customers may effect transactions, including transactions contrary to any recommendation herein, or have positions in the securities mentioned herein or options with respect thereto. Any recommendation contained in this report may not be suitable for all investors and it is not to be deemed an offer or solicitation on our part with respect to the purchase or sale of any securities. |
|
 |
Influential Financials Rise Amid Widespread Gains
Kenneth J. Gruneisen - Passed the CAN SLIM® Master's Exam
Gains for the influential Broker/Dealer Index ($XBD +2.71%) and Bank Index ($BKX +1.57%) were reassuring and the Retail Index ($RLX +2.10%) also tallied a solid gain on Friday. The Biotechnology Index ($BTK +3.25%) and the Semiconductor Index ($SOX +2.26%) outpaced the Internet Index ($IIX +1.66%) and Networking Index ($NWX +0.92%) in the tech sector. Energy-related shares were on the rise as the Oil Services Index ($OSX +1.56%) and Integrated Oil Index ($XOI +2.20%) traded up. The defensive groups including the Gold & Silver Index ($XAU +1.88%) and Healthcare Index ($HMO +2.66%) also enjoyed gains on the widely positive session.
Charts courtesy www.stockcharts.com

PICTURED 1: The Broker/Dealer Index's ($XBD +2.71%) gap up gain helped it make more progress above its 50-day moving average (DMA) line.
Charts courtesy www.stockcharts.com
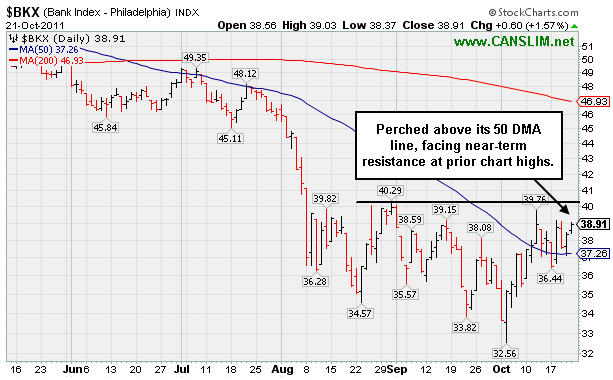
PICTURED 2: The Bank Index ($BKX +1.57%) is perched above its 50 DMA line, facing near-term resistance at prior chart highs.
| Oil Services |
$OSX |
218.59 |
+3.36 |
+1.56% |
-10.82% |
| Healthcare |
$HMO |
1,980.10 |
+51.35 |
+2.66% |
+17.03% |
| Integrated Oil |
$XOI |
1,205.82 |
+26.01 |
+2.20% |
-0.61% |
| Semiconductor |
$SOX |
372.10 |
+8.22 |
+2.26% |
-9.64% |
| Networking |
$NWX |
226.11 |
+2.05 |
+0.92% |
-19.41% |
| Internet |
$IIX |
291.92 |
+4.77 |
+1.66% |
-5.14% |
| Broker/Dealer |
$XBD |
87.80 |
+2.31 |
+2.71% |
-27.74% |
| Retail |
$RLX |
547.52 |
+11.24 |
+2.10% |
+7.70% |
| Gold & Silver |
$XAU |
184.87 |
+3.41 |
+1.88% |
-18.41% |
| Bank |
$BKX |
38.91 |
+0.60 |
+1.57% |
-25.47% |
| Biotech |
$BTK |
1,155.83 |
+36.35 |
+3.25% |
-10.93% |
|
|
|
 |
Favorable Characteristics Following Years of Good Earnings Growth
Kenneth J. Gruneisen - Passed the CAN SLIM® Master's Exam
Often, when a leading stock is setting up to breakout of a solid base it is highlighted in CANSLIM.net's Mid-Day Breakouts Report. The most relevant factors are noted in the report which allows prudent CANSLIM oriented investors to place the issue in their watch list. After doing any necessary backup research, the investor is prepared to act if and when the stock triggers a technical buy signal (breaks above its pivot point on more than +50% average turnover). In the event the stock fails to trigger a technical buy signal and its price declines then it will simply be removed from the watch list.
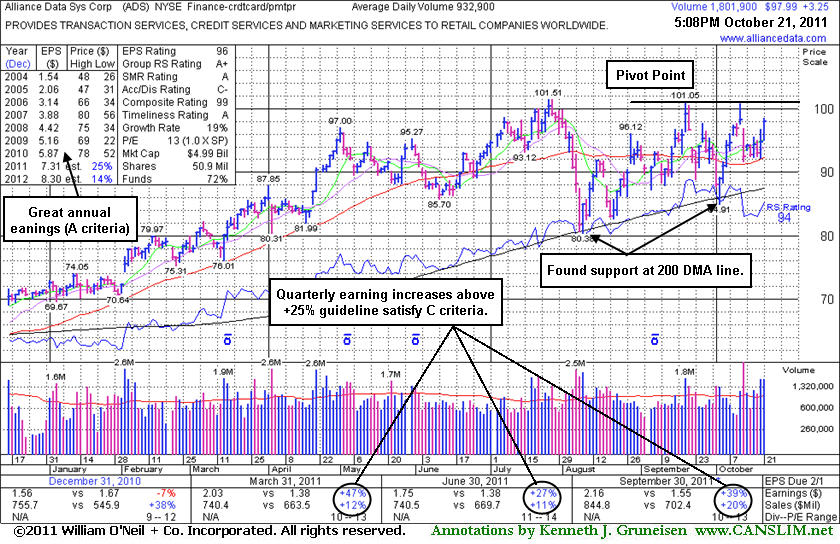
Alliance Data Systems Corporation (ADS +$3.25 or +3.43% to $97.99) was featured in yellow with a pivot point based on its 9/20/11 high plus 10 cents in the mid-day report earlier today. It was on the rise, rallying within close range of its all-time high, and finished near the session high with a second consecutive volume-driven gain. It found support at its 200-day moving average (DMA) line again during the latest consolidation. Subsequent volume-driven gains above its pivot point may trigger a technical buy signal. As always, protect your capital buy selling if any stock falls 7-8% your purchase price.
Its last appearance in this FSU section with an annotated graph was way back on 1/23/07 with an annotated graph under the headline, "High Ranked Leader Perched Near Highs". It has maintained a good annual earnings (A criteria) history, even through challenging economic times in recent years which created flaws in the A criteria for many growth stocks. Its past 3 quarterly comparisons (Mar, Jun, and Sep '11) showed earnings per share increases greater than the +25% minimum guideline (C criteria). Current leadership from other companies in the Finance - Credit Card/Payment Processing group (L criteria) is a favorable characteristic. Ownership by top-rated funds also rose from 731 in Mar '11 to 807 in Sep '11, a reassuring sign concerning the I criteria.
|
|
|
Color Codes Explained :
Y - Better candidates highlighted by our
staff of experts.
G - Previously featured
in past reports as yellow but may no longer be buyable under the
guidelines.
***Last / Change / Volume data in this table is the closing quote data***
Symbol/Exchange
Company Name
Industry Group |
PRICE |
CHANGE
(%Change) |
Day High |
Volume
(% DAV)
(% 50 day avg vol) |
52 Wk Hi
% From Hi |
Featured
Date |
Price
Featured |
Pivot Featured |
|
Max Buy |
AAPL
-
NASDAQ
Apple Inc
COMPUTER HARDWARE - Personal Computers
|
$392.87
|
-2.44
-0.62% |
$399.14
|
22,171,794
100.51% of 50 DAV
50 DAV is 22,058,800
|
$426.70
-7.93%
|
9/16/2011
|
$399.14
|
PP = $404.60
|
|
MB = $424.83
|
Most Recent Note - 10/20/2011 6:27:57 PM
G - It has not formed a sound base pattern and ownership by top-rated funds has fallen some. See the latest FSU analysis for more details and a new annotated graph.
>>> The latest Featured Stock Update with an annotated graph appeared on 10/20/2011. Click here.
View all notes |
Alert me of new notes |
CANSLIM.net Company Profile |
SEC |
Zacks Reports |
StockTalk |
News |
Chart |
Request a new note
C
A N
S L
I M


|
ADS
-
NYSE
Alliance Data Sys Corp
COMPUTER SOFTWARE and SERVICES - Information and Delivery Service
|
$97.99
|
+3.25
3.43% |
$98.50
|
1,833,997
196.59% of 50 DAV
50 DAV is 932,900
|
$101.51
-3.47%
|
10/21/2011
|
$97.94
|
PP = $101.15
|
|
MB = $106.21
|
 Most Recent Note - 10/21/2011 7:05:16 PM
Y - Posted a second consecutive gain today with nearly 2 times average volume, rallying within close range of its all-time high. Found support at its 200 DMA line again during the latest consolidation. Color code was changed to yellow with pivot point based on its 9/20/11 high plus 10 cents, and subsequent volume-driven gains above its pivot point may trigger a technical buy signal. See the latest FSU analysis for more details and a new annotated graph.
>>> The latest Featured Stock Update with an annotated graph appeared on 10/21/2011. Click here.
View all notes |
Alert me of new notes |
CANSLIM.net Company Profile |
SEC |
Zacks Reports |
StockTalk |
News |
Chart |
Request a new note
C
A N
S L
I M
|
ALXN
-
NASDAQ
Alexion Pharmaceuticals
DRUGS - Drug Manufacturers - Other
|
$68.38
|
+1.62
2.43% |
$69.41
|
1,828,207
116.36% of 50 DAV
50 DAV is 1,571,200
|
$70.20
-2.59%
|
9/15/2011
|
$63.20
|
PP = $60.81
|
|
MB = $63.85
|
Most Recent Note - 10/20/2011 11:56:14 AM
G - Off its earlier high following a small gap today after reporting earnings +48% on +44% sales revenues for the quarter ended September 30, 2011 versus the year ago period. Hovering in a tight range near its all-time high, this high-ranked Medical - Biomed/Biotech group leader is extended from its prior base. Support to watch includes prior resistance in the $59-60 area and its upwardly tilted 50 DMA line.
>>> The latest Featured Stock Update with an annotated graph appeared on 10/18/2011. Click here.
View all notes |
Alert me of new notes |
CANSLIM.net Company Profile |
SEC |
Zacks Reports |
StockTalk |
News |
Chart |
Request a new note
C
A N
S L
I M
|
CELG
-
NASDAQ
Celgene Corp
DRUGS - Drug Manufacturers - Major
|
$66.93
|
+0.98
1.49% |
$67.37
|
3,138,168
81.27% of 50 DAV
50 DAV is 3,861,200
|
$67.01
-0.12%
|
9/16/2011
|
$61.21
|
PP = $62.59
|
|
MB = $65.72
|
Most Recent Note - 10/20/2011 6:35:31 PM
G - Traded within one cent of its 52-week high today yet finished near the middle of its intra-day range with a small gain on below average volume.
>>> The latest Featured Stock Update with an annotated graph appeared on 10/14/2011. Click here.
View all notes |
Alert me of new notes |
CANSLIM.net Company Profile |
SEC |
Zacks Reports |
StockTalk |
News |
Chart |
Request a new note
C
A N
S L
I M
|
ISRG
-
NASDAQ
Intuitive Surgical Inc
HEALTH SERVICES - Medical Appliances and Equipment
|
$415.63
|
-2.78
-0.66% |
$420.00
|
542,215
120.55% of 50 DAV
50 DAV is 449,800
|
$425.49
-2.32%
|
10/19/2011
|
$424.69
|
PP = $415.29
|
|
MB = $436.05
|
Most Recent Note - 10/21/2011 1:06:17 PM
Y - Holding its ground in a tight range since its 10/19/11 gap up gain on heavy volume triggered a technical buy signal. Prior highs define important support to watch on pullbacks. See the latest FSU analysis for more details and an annotated graph.
>>> The latest Featured Stock Update with an annotated graph appeared on 10/19/2011. Click here.
View all notes |
Alert me of new notes |
CANSLIM.net Company Profile |
SEC |
Zacks Reports |
StockTalk |
News |
Chart |
Request a new note
C
A N
S L
I M
|
Symbol/Exchange
Company Name
Industry Group |
PRICE |
CHANGE
(%Change) |
Day High |
Volume
(% DAV)
(% 50 day avg vol) |
52 Wk Hi
% From Hi |
Featured
Date |
Price
Featured |
Pivot Featured |
|
Max Buy |
LABL
-
NASDAQ
Multi Color Corp
CONSUMER NON-DURABLES - Packaging and Containers
|
$26.99
|
+1.15
4.45% |
$27.10
|
30,563
53.25% of 50 DAV
50 DAV is 57,400
|
$28.00
-3.61%
|
10/17/2011
|
$27.81
|
PP = $28.10
|
|
MB = $29.51
|
Most Recent Note - 10/21/2011 5:42:48 PM
Y - Posted a solid gain today on light volume finishing -3.6% off its 52-week high. Little overhead supply remains to act as resistance. Subsequent volume-driven gains into new high ground may trigger a technical buy signal. Annual earnings (A criteria) history included a slight dip in FY '09 earnings.
>>> The latest Featured Stock Update with an annotated graph appeared on 10/17/2011. Click here.
View all notes |
Alert me of new notes |
CANSLIM.net Company Profile |
SEC |
Zacks Reports |
StockTalk |
News |
Chart |
Request a new note
C
A N
S L
I M
|
MG
-
NYSE
Mistras Group Inc
DIVERSIFIED SERVICES - Bulding and Faci;ity Management Services
|
$23.00
|
+0.03
0.13% |
$23.36
|
338,473
151.65% of 50 DAV
50 DAV is 223,200
|
$23.51
-2.17%
|
8/10/2011
|
$17.89
|
PP = $17.58
|
|
MB = $18.46
|
Most Recent Note - 10/19/2011 12:33:46 PM
G - Inching up to yet another new all-time high today, getting more extended from its prior base. Prior highs in the $20-21 area define initial chart support to watch above its 50 DMA line.
>>> The latest Featured Stock Update with an annotated graph appeared on 10/12/2011. Click here.
View all notes |
Alert me of new notes |
CANSLIM.net Company Profile |
SEC |
Zacks Reports |
StockTalk |
News |
Chart |
Request a new note
C
A N
S L
I M
|
OPNT
-
NASDAQ
Opnet Technologies
INTERNET - Internet Software and Services
|
$42.68
|
+2.78
6.97% |
$42.77
|
311,309
193.48% of 50 DAV
50 DAV is 160,900
|
$42.51
0.40%
|
10/11/2011
|
$38.45
|
PP = $42.02
|
|
MB = $44.12
|
Most Recent Note - 10/21/2011 7:11:54 PM
Y - Gapped up today and rallied above its pivot point to a new 52-week high triggering a technical buy signal, finishing the session strong with volume nearly 2 times average behind its considerable gain. Due to report earnings on Wednesday, November 9th.
>>> The latest Featured Stock Update with an annotated graph appeared on 10/11/2011. Click here.
View all notes |
Alert me of new notes |
CANSLIM.net Company Profile |
SEC |
Zacks Reports |
StockTalk |
News |
Chart |
Request a new note
C
A N
S L
I M
|
V
-
NYSE
Visa Inc Cl A
DIVERSIFIED SERVICES - Business/Management Services
|
$93.43
|
+2.08
2.28% |
$93.43
|
3,532,146
64.34% of 50 DAV
50 DAV is 5,489,700
|
$94.75
-1.39%
|
9/20/2011
|
$93.91
|
PP = $90.93
|
|
MB = $95.48
|
Most Recent Note - 10/20/2011 6:32:53 PM
G - Posted a small gain today with lighter than average volume after a damaging distribution day on the prior session. Choppy action in recent weeks is not recognized as a sound base pattern.
>>> The latest Featured Stock Update with an annotated graph appeared on 10/10/2011. Click here.
View all notes |
Alert me of new notes |
CANSLIM.net Company Profile |
SEC |
Zacks Reports |
StockTalk |
News |
Chart |
Request a new note
C
A N
S L
I M
|
|
|
|
THESE ARE NOT BUY RECOMMENDATIONS!
Comments contained in the body of this report are technical
opinions only. The material herein has been obtained
from sources believed to be reliable and accurate, however,
its accuracy and completeness cannot be guaranteed.
This site is not an investment advisor, hence it does
not endorse or recommend any securities or other investments.
Any recommendation contained in this report may not
be suitable for all investors and it is not to be deemed
an offer or solicitation on our part with respect to
the purchase or sale of any securities. All trademarks,
service marks and trade names appearing in this report
are the property of their respective owners, and are
likewise used for identification purposes only.
This report is a service available
only to active Paid Premium Members.
You may opt-out of receiving report notifications
at any time. Questions or comments may be submitted
by writing to Premium Membership Services 665 S.E. 10 Street, Suite 201 Deerfield Beach, FL 33441-5634 or by calling 1-800-965-8307
or 954-785-1121.
|
|
|

