You are not logged in.
This means you
CAN ONLY VIEW reports that were published prior to Monday, April 14, 2025.
You
MUST UPGRADE YOUR MEMBERSHIP if you want to see any current reports.
AFTER MARKET UPDATE - MONDAY, OCTOBER 20TH, 2014
Previous After Market Report Next After Market Report >>>
|
|
|
|
DOW |
+19.26 |
16,399.67 |
+0.12% |
|
Volume |
723,272,000 |
-31% |
|
Volume |
1,560,972,790 |
-24% |
|
NASDAQ |
+57.63 |
4,316.07 |
+1.35% |
|
Advancers |
2,294 |
72% |
|
Advancers |
2,031 |
68% |
|
S&P 500 |
+17.25 |
1,904.01 |
+0.91% |
|
Decliners |
814 |
25% |
|
Decliners |
854 |
29% |
|
Russell 2000 |
+12.64 |
1,094.97 |
+1.17% |
|
52 Wk Highs |
37 |
|
|
52 Wk Highs |
18 |
|
|
S&P 600 |
+7.19 |
631.88 |
+1.15% |
|
52 Wk Lows |
28 |
|
|
52 Wk Lows |
40 |
|
|
 |
Major Averages Rose With Less Volume Conviction
Kenneth J. Gruneisen - Passed the CAN SLIM® Master's Exam
The major averages posted gains on Monday. The volume totals were reported lighter than the prior session total on the NYSE and on the Nasdaq exchange, revealing a lack of serious institutional buying demand. Breadth was positive as advancers led decliners by nearly a 3-1 margin on the NYSE and 5-2 on the Nasdaq exchange. Leadership remained scant as there were 6 high-ranked companies from the CANSLIM.net Leaders List that made new 52-week highs and appeared on the CANSLIM.net BreakOuts Page, matching the prior session total of 6 stocks. New 52-week highs outnumbered new 52-week lows on the NYSE while new 52-week lows outnumbered new 52-week highs on the Nasdaq exchange. There were gains for 4 of the 5 high-ranked companies currently included on the Featured Stocks Page, a list that has waned as market conditions eroded. Distributional action raised concerns while leadership (stocks hitting new 52-week highs) waned and a deteriorating market (M criteria) environment was repeatedly noted in this commentary. New buying efforts are discouraged during market corrections while the fact-based investment system prompts disciplined investors to lean toward reducing market exposure.
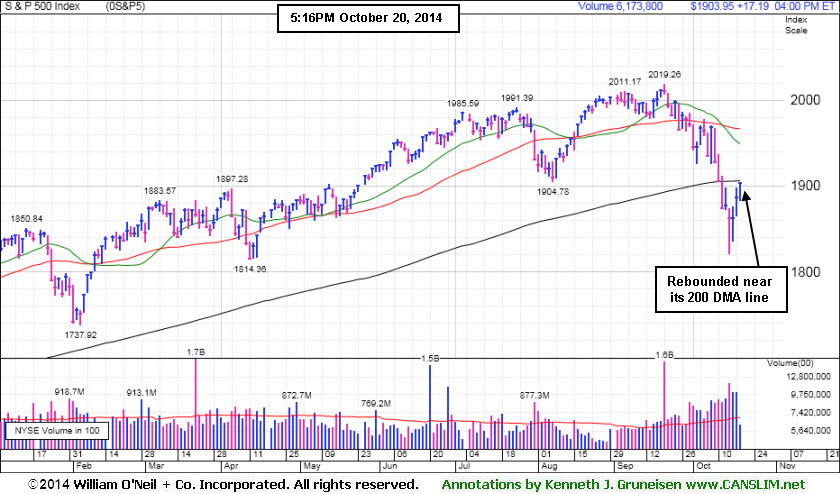
PICTURED: The Dow, which declined as many as 119 points, finished up 19 points to 16,399. The S&P 500 gained 17 points to 1,904. The NASDAQ was 57 points higher at 4,316.
The major averages increased as investors turned their attention to corporate profits. All 10 sectors of the S&P 500 were in positive territory. Consumer stocks paced the advance. Shares of PepsiCo (PEP +2.23%) were higher. Hasbro (HAS +4.94%) rose after the company topped analyst expectations for third quarter profits. In tech, Apple (AAPL +2.14%) rose ahead of its strong earnings results after the market close. Industrials were a relative underperformer. Shares of CSX Corp (CSX -1.03%) fell after merger talks with Canadian Pacific (CP -1.54%) dissipated. IBM (IBM -7.11%) fell, which weighed on the Dow, after the company disappointed earning expectations and announced it will pay $1.5 billion to Globalfoundries in order to shed its chip division.
Treasuries erased earlier losses to finish higher. The benchmark 10-year note climbed 1/32 to yield 2.19%. Commodities were mixed. On the NYMEX WTI crude began the week on a higher note, as it advanced 0.1% to $82.83 per barrel. Gold climbed +0.5% on the COMEX to $1,244 per ounce as the dollar fell.
The CANSLIM.net Featured Stocks Page shows the most action-worthy candidates and their latest notes and a Headline Link directs members to the latest detailed analysis with data-packed graphs annotated by a Certified expert along with links to additional resources. The Premium Member Homepage includes "dynamic archives" to all prior pay reports published.
|
 Kenneth J. Gruneisen started out as a licensed stockbroker in August 1987, a couple of months prior to the historic stock market crash that took the Dow Jones Industrial Average down -22.6% in a single day. He has published daily fact-based fundamental and technical analysis on high-ranked stocks online for two decades. Through FACTBASEDINVESTING.COM, Kenneth provides educational articles, news, market commentary, and other information regarding proven investment systems that work in good times and bad.
Comments contained in the body of this report are technical opinions only and are not necessarily those of Gruneisen Growth Corp. The material herein has been obtained from sources believed to be reliable and accurate, however, its accuracy and completeness cannot be guaranteed. Our firm, employees, and customers may effect transactions, including transactions contrary to any recommendation herein, or have positions in the securities mentioned herein or options with respect thereto. Any recommendation contained in this report may not be suitable for all investors and it is not to be deemed an offer or solicitation on our part with respect to the purchase or sale of any securities. |
|
 |
Tech, Retail, Financial, and Commodity-Linked Groups Rose
Kenneth J. Gruneisen - Passed the CAN SLIM® Master's Exam
Financial shares had a slightly positive bias as the Bank Index ($BKX +0.58%) outpaced the Broker/Dealer Index ($XBD +0.17%). The Retail Index ($RLX +1.64%) also underpinned the major indices' advance while the tech sector saw unanimous gains from the Semiconductor Index ($SOX +1.53%), Biotechnology Index ($BTK +1.25%), and the Networking Index ($NWX +0.44%). Commodity-linked groups also drifted higher as the Integrated Oil Index ($XOI +0.65%), Oil Services Index ($OSX +1.42%), and the Gold & Silver Index ($XAU +1.91%) rose.
Charts courtesy www.stockcharts.com
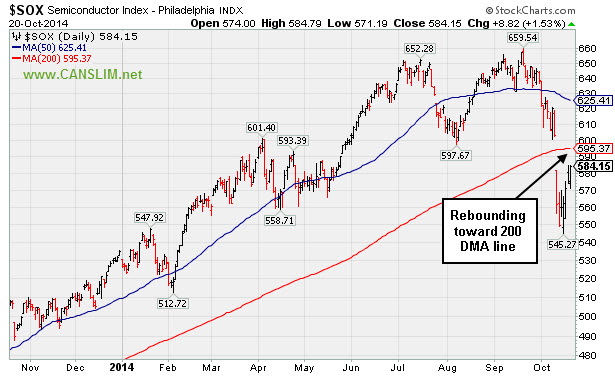
PICTURED: The Semiconductor Index ($SOX +1.53%),has been rebounding toward its 200-day moving average (DMA) line.
| Oil Services |
$OSX |
243.57 |
+3.41 |
+1.42% |
-13.33% |
| Integrated Oil |
$XOI |
1,421.56 |
+9.22 |
+0.65% |
-5.43% |
| Semiconductor |
$SOX |
584.15 |
+8.82 |
+1.53% |
+9.18% |
| Networking |
$NWX |
295.74 |
+1.30 |
+0.44% |
-8.71% |
| Broker/Dealer |
$XBD |
161.97 |
+0.27 |
+0.17% |
+0.88% |
| Retail |
$RLX |
907.52 |
+14.68 |
+1.64% |
-3.43% |
| Gold & Silver |
$XAU |
78.55 |
+1.47 |
+1.91% |
-6.65% |
| Bank |
$BKX |
67.20 |
+0.39 |
+0.58% |
-2.97% |
| Biotech |
$BTK |
3,055.40 |
+37.86 |
+1.25% |
+31.11% |
|
|
|
 |
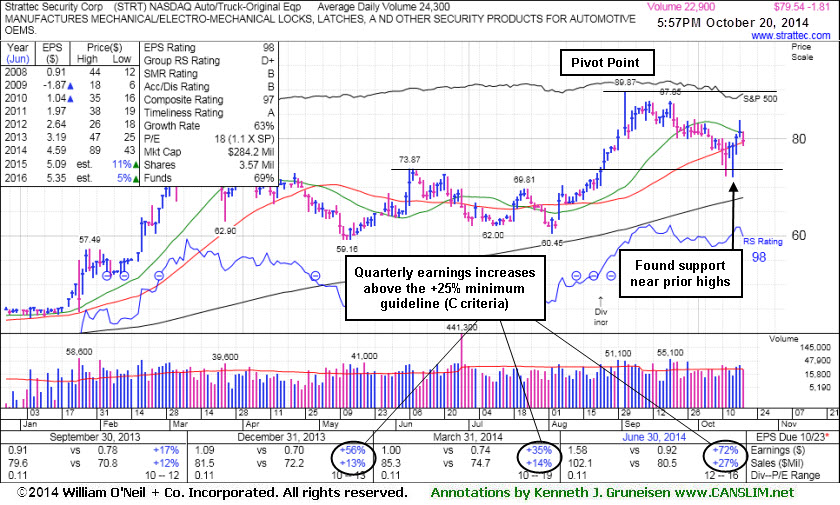
Building Base-On-Base Pattern Ahead of Earnings News
Kenneth J. Gruneisen - Passed the CAN SLIM® Master's Exam
Strattec Security Corp (STRT -$1.81 or -2.22% to $79.54) recently found encouraging support near its 50-day moving average (DMA) line while building on a base-on-base pattern. However, poor market conditions (M criteria) have raised overriding concerns arguing against any new buying efforts until a solid follow through day from at least one of the major averages confirms that strength is returning to the broader market. The recent low ($72.13 on 10/15/14) defines important near-term support to watch where any violation would raise more serious concerns. Meanwhile, it faces near term resistance due to overhead supply up through the $89 level. Subsequent volume-driven gains above the pivot point cited may trigger a new (or add-on) technical buy signal.
STRT was last shown in this FSU section on 9/26/14 with annotated graphs under the headline, "Consolidating Above Prior Highs and 50-Day Moving Average Line". It was first highlighted in yellow at $71.47 with pivot point based on its 6/06/14 high plus 10 cents in the 8/22/14 mid-day report (read here).
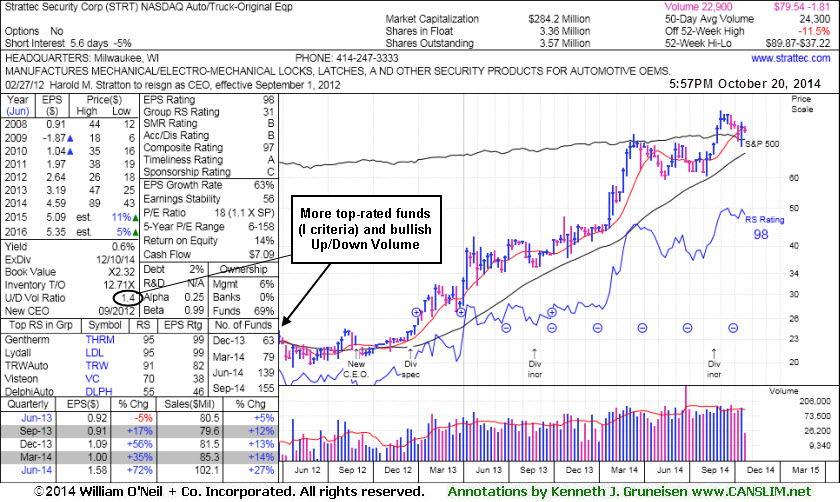
Keep in mind that it is due to report earnings results for the Sep '14 quarter on Thursday, October 23rd, and volume and volatility often increase near earnings news. The thinly-traded stock has a small supply (S criteria) of only 3.36 million shares in the public float which can contribute to greater price volatility in the event of institutional buying or selling. Quarterly earnings increases through Jun '14 above the +25% minimum guideline satisfy the C criteria and its annual earnings (A criteria) history has been strong. Increasing ownership by top-rated funds (I criteria) is a reassuring sign. The number of top-rated funds owning its shares rose from 59 in Sep '14 to 155 in Sep '14, a very reassuring sign concerning the I criteria. Its current Up/Down Volume Ratio of 1.4 is an unbiased indication its shares have been under accumulation over the past 50 days. The Auto/Truck - Original Equipment group's strong Group Relative Strength rank is a reassuring sign concerning the L criteria.
 \ \
|
|
|
Color Codes Explained :
Y - Better candidates highlighted by our
staff of experts.
G - Previously featured
in past reports as yellow but may no longer be buyable under the
guidelines.
***Last / Change / Volume data in this table is the closing quote data***
Symbol/Exchange
Company Name
Industry Group |
PRICE |
CHANGE
(%Change) |
Day High |
Volume
(% DAV)
(% 50 day avg vol) |
52 Wk Hi
% From Hi |
Featured
Date |
Price
Featured |
Pivot Featured |
|
Max Buy |
ACT
-
NYSE
Actavis plc
Medical-Generic Drugs
|
$226.67
|
+1.94
0.86% |
$226.99
|
1,696,335
75.70% of 50 DAV
50 DAV is 2,241,000
|
$249.94
-9.31%
|
6/20/2014
|
$216.53
|
PP = $230.87
|
|
MB = $242.41
|
Most Recent Note - 10/16/2014 6:27:10 PM
G - Halted its slide with a gain today after testing support at its 200 DMA line. Streak of 5 consecutive losses marked by volume triggered technical sell signals. Only a prompt rebound above its 50 DMA line would help its outlook improve.
>>> FEATURED STOCK ARTICLE : Held Ground Above Prior Highs Defining Near-Term Support - 10/8/2014
View all notes |
Set NEW NOTE alert |
CANSLIM.net Company Profile |
SEC
News |
Chart |
Request a new note
C
A N
S L
I M


|
AFSI
-
NASDAQ
Amtrust Financial Svcs
INSURANCE - Property and; Casualty Insurance
|
$45.33
|
+0.66
1.48% |
$45.73
|
1,000,810
150.27% of 50 DAV
50 DAV is 666,000
|
$47.10
-3.76%
|
10/17/2014
|
$45.24
|
PP = $46.02
|
|
MB = $48.32
|
 Most Recent Note - 10/20/2014 12:18:50 PM
Y - Fundamentals remain strong (C and A criteria) and it today's 3rd consecutive volume-driven gain is challenging its 52-week high and previously stubborn resistance in the $46-47 area. Highlighted in yellow with new pivot point cited based on its 8/07/14 high in the 10/17/14 mid-day report (read here). Subsequent volume-driven gains above the pivot point may trigger a technical buy signal. See the latest FSU analysis for more details and annotated graphs.
>>> FEATURED STOCK ARTICLE : Perched Near High After Rebounding From 200-Day Average - 10/17/2014
View all notes |
Set NEW NOTE alert |
CANSLIM.net Company Profile |
SEC
News |
Chart |
Request a new note
C
A N
S L
I M
|
FB
-
NASDAQ
Facebook Inc Cl A
INTERNET
|
$76.95
|
+1.00
1.32% |
$77.09
|
34,427,984
101.10% of 50 DAV
50 DAV is 34,054,000
|
$79.71
-3.46%
|
9/9/2014
|
$76.67
|
PP = $76.84
|
|
MB = $80.68
|
Most Recent Note - 10/17/2014 5:28:41 PM
G - Volume-driven gain today helped it rebound and close just above the 50 DMA line ($75.83) helping its outlook to improve and its color code is changed to yellow. See the latest FSU analysis for more details and annotated graphs.
>>> FEATURED STOCK ARTICLE : Volume-Driven Losses Triggered Sell Signals After Slumping Into Prior Base - 10/16/2014
View all notes |
Set NEW NOTE alert |
CANSLIM.net Company Profile |
SEC
News |
Chart |
Request a new note
C
A N
S L
I M
|
PANW
-
NYSE
Palo Alto Networks
Computer Sftwr-Security
|
$100.88
|
+1.55
1.56% |
$102.00
|
2,093,580
97.97% of 50 DAV
50 DAV is 2,137,000
|
$106.79
-5.53%
|
7/30/2014
|
$84.21
|
PP = $85.88
|
|
MB = $90.17
|
Most Recent Note - 10/16/2014 6:22:01 PM
G - Prompt rebound above the 50 DMA line helped its outlook improve. Recent low ($87.83 on 10/13/14) defines important near-term support where any subsequent violation would raise more serious concerns and trigger a more worrisome technical sell signal.
>>> FEATURED STOCK ARTICLE : Prompt Rebound Above 50-Day Average an Encouraging Sign of Support - 10/14/2014
View all notes |
Set NEW NOTE alert |
CANSLIM.net Company Profile |
SEC
News |
Chart |
Request a new note
C
A N
S L
I M
|
STRT
-
NASDAQ
Strattec Security Corp
AUTOMOTIVE - Auto Parts
|
$79.54
|
-1.81
-2.22% |
$81.64
|
22,890
95.38% of 50 DAV
50 DAV is 24,000
|
$89.87
-11.50%
|
9/19/2014
|
$86.06
|
PP = $89.97
|
|
MB = $94.47
|
Most Recent Note - 10/20/2014 6:11:13 PM
Y - Consolidating near 50 DMA line. Poor market conditions (M criteria) have raised overriding concerns arguing against any new buying efforts until strength returns. Recent low ($72.13 on 10/15/14) defines important near-term support to watch. Reporting Sep '14 quarterly earnings on Thursday. See the latest FSU analysis for more details and new annotated graphs.
>>> FEATURED STOCK ARTICLE : Building Base-On-Base Pattern Ahead of Earnings News - 10/20/2014
View all notes |
Set NEW NOTE alert |
CANSLIM.net Company Profile |
SEC
News |
Chart |
Request a new note
C
A N
S L
I M
|
Symbol/Exchange
Company Name
Industry Group |
PRICE |
CHANGE
(%Change) |
Day High |
Volume
(% DAV)
(% 50 day avg vol) |
52 Wk Hi
% From Hi |
Featured
Date |
Price
Featured |
Pivot Featured |
|
Max Buy |
|
|
|
THESE ARE NOT BUY RECOMMENDATIONS!
Comments contained in the body of this report are technical
opinions only. The material herein has been obtained
from sources believed to be reliable and accurate, however,
its accuracy and completeness cannot be guaranteed.
This site is not an investment advisor, hence it does
not endorse or recommend any securities or other investments.
Any recommendation contained in this report may not
be suitable for all investors and it is not to be deemed
an offer or solicitation on our part with respect to
the purchase or sale of any securities. All trademarks,
service marks and trade names appearing in this report
are the property of their respective owners, and are
likewise used for identification purposes only.
This report is a service available
only to active Paid Premium Members.
You may opt-out of receiving report notifications
at any time. Questions or comments may be submitted
by writing to Premium Membership Services 665 S.E. 10 Street, Suite 201 Deerfield Beach, FL 33441-5634 or by calling 1-800-965-8307
or 954-785-1121.
|
|
|

